
Journal of Geographical Sciences >
Spatio-temporal evolution and influencing factors of geopolitical relations among Arctic countries based on news big data
|
Li Meng (1995-), Master, specialized in big data analysis research. E-mail: limeng18@mails.ucas.ac.cn |
Received date: 2022-05-09
Accepted date: 2022-06-28
Online published: 2022-12-25
Supported by
National Natural Science Foundation of China(42071153)
The Strategic Priority Research Program of Chinese Academy of Sciences(XDA19040401)
The Strategic Priority Research Program of Chinese Academy of Sciences(XDA20080100)
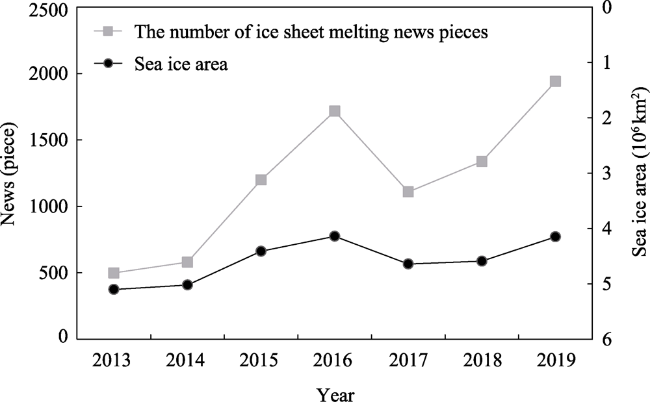
Global warming has caused the Arctic Ocean ice cover to shrink. This endangers the environment but has made traversing the Arctic channel possible. Therefore, the strategic position of the Arctic has been significantly improved. As a near-Arctic country, China has formulated relevant policies that will be directly impacted by changes in the international relations between the eight Arctic countries (regions). A comprehensive and real-time analysis of the various characteristics of the Arctic geographical relationship is required in China, which helps formulate political, economic, and diplomatic countermeasures. Massive global real-time open databases provide news data from major media in various countries. This makes it possible to monitor geographical relationships in real-time. This paper explores key elements of the social development of eight Arctic countries (regions) over 2013-2019 based on the GDELT database and the method of labeled latent Dirichlet allocation. This paper also constructs the national interaction network and identifies the evolution pattern for the relationships between Arctic countries (regions). The following conclusions are drawn. (1) Arctic news hotspot is now focusing on climate change/ice cap melting which is becoming the main driving factor for changes in geographical relationships in the Arctic. (2) There is a strong correlation between the number of news pieces about ice cap melting and the sea ice area. (3) With the melting of the ice caps, the social, economic, and military activities in the Arctic have been booming, and the competition for dominance is becoming increasingly fierce. In general, there is a pattern of domination by Russia and Canada.
LI Meng , YUAN Wen , YUAN Wu , NIU Fangqu , LI Hanqin , HU Duanmu . Spatio-temporal evolution and influencing factors of geopolitical relations among Arctic countries based on news big data[J]. Journal of Geographical Sciences, 2022 , 32(10) : 2036 -2052 . DOI: 10.1007/s11442-022-2035-0
Table 1 Event types in GDELT |
| Event type | ||||
|---|---|---|---|---|
| Make public statement | Appeal | Express intent to cooperate | Consult | Engage in diplomatic cooperation |
| Demand | Provide aid | Yield | Investigate | Engage in material cooperation |
| Disapprove | Reject | Threaten | Protest | Exhibit military posture |
| Reduce relations | Coerce | Assault | Fight | Engage in unconventional mass violence |
Table 2 Statistics on the number of news articles in the Arctic by topic from 2013-2019 |
| Year | Animal protection | Shipping traffic | Climate change | Economic Activities | Military activities | Regional governance | Resource development | Melting ice caps |
|---|---|---|---|---|---|---|---|---|
| 2013 | 324 | 398 | 766 | 625 | 1803 | 712 | 773 | 499 |
| 2014 | 671 | 575 | 977 | 1336 | 5422 | 1120 | 953 | 580 |
| 2015 | 956 | 2381 | 1625 | 1045 | 3616 | 1342 | 1434 | 1199 |
| 2016 | 1447 | 3915 | 1377 | 1195 | 3923 | 1476 | 1028 | 1716 |
| 2017 | 1029 | 1603 | 1326 | 832 | 4080 | 1460 | 943 | 1109 |
| 2018 | 1280 | 1193 | 2147 | 933 | 3244 | 1270 | 930 | 1338 |
| 2019 | 1589 | 1537 | 3591 | 991 | 4605 | 3162 | 1220 | 1940 |
Table 3 High frequency words corresponding to each news topic in the Arctic from 2013-2019 |
| Events | Top 1 | Top 2 | Top 3 | Top 4 | Top 5 | Top 6 | Top 7 | Top 8 |
|---|---|---|---|---|---|---|---|---|
| Melting ice caps | ice | climate | glacier | sheet | cap | record | researcher | melting |
| Animal protection | bear | polar | wildlife | climate | animal | ice | conservation | study |
| Shipping traffic | ship | cruise | ice | polar | route | coast | expedition | Norwegian |
| Regional governance | policy | development | region | oil | country | paper | cooperation | state |
| Climate change | climate | temperature | cold | weather | record | degree | polar | wind |
| Resource development | energy | oil | fuel | drilling | fossil | gas | company | climate |
| Economic activities | oil | market | price | natural | industry | company | car | gas |
| Military activities | military | defense | force | state | missile | Nordic | war | logistics |
Table 4 Correlation coefficient of various news topics in the Arctic region from 2013-2019 |
| Animal protection | Shipping traffic | Climate change | Economic Activities | Military activities | Regional governance | Resource development | Melting ice caps | |
|---|---|---|---|---|---|---|---|---|
| Animal protection | 1.0000 | 0.6217 | 0.7749 | 0.3240 | 0.3986 | 0.7586 | 0.4437 | 0.9701 |
| Shipping traffic | 0.6217 | 1.0000 | 0.1113 | 0.3716 | 0.1289 | 0.2053 | 0.4591 | 0.6684 |
| Climate change | 0.7749 | 0.1113 | 1.0000 | 0.0423 | 0.2843 | 0.9241 | 0.4914 | 0.7970 |
| Economic activities | 0.3240 | 0.3716 | 0.0423 | 1.0000 | 0.8159 | 0.1507 | 0.3534 | 0.2063 |
| Military activities | 0.3986 | 0.1289 | 0.2843 | 0.8159 | 1.0000 | 0.4624 | 0.3336 | 0.2617 |
| Regional governance | 0.7586 | 0.2053 | 0.9241 | 0.1507 | 0.4624 | 1.0000 | 0.5001 | 0.7947 |
| Resource development | 0.4437 | 0.4591 | 0.4914 | 0.3534 | 0.3336 | 0.5001 | 1.0000 | 0.5138 |
| Melting ice caps | 0.9701 | 0.6684 | 0.7970 | 0.2063 | 0.2617 | 0.7947 | 0.5138 | 1.0000 |
Figure 1 Correlation coefficients between the number of melting ice cap news pieces and sea ice area in the Arctic from 2013-2019 |
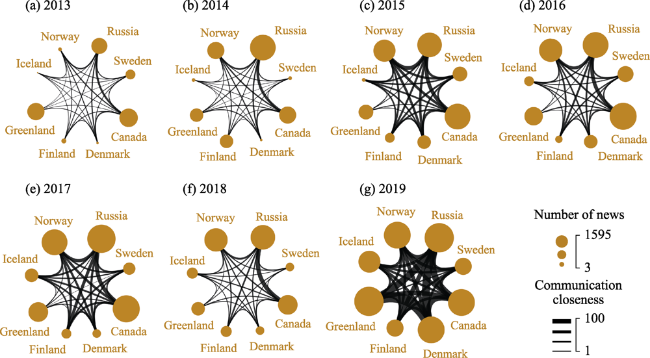
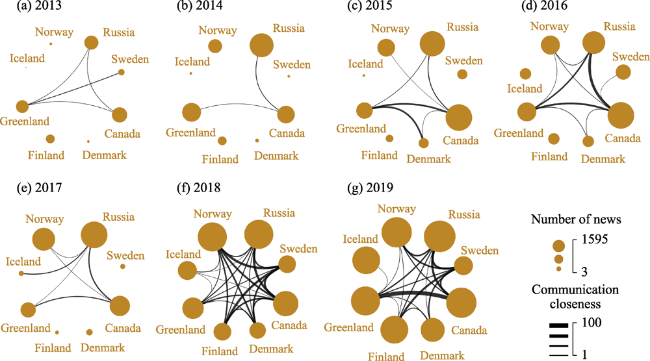
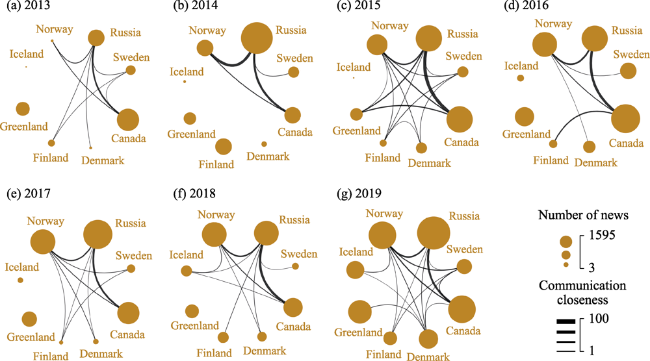
Figure 2 Changes in the national interaction network of regional governance in the Arctic from 2013-2019 |
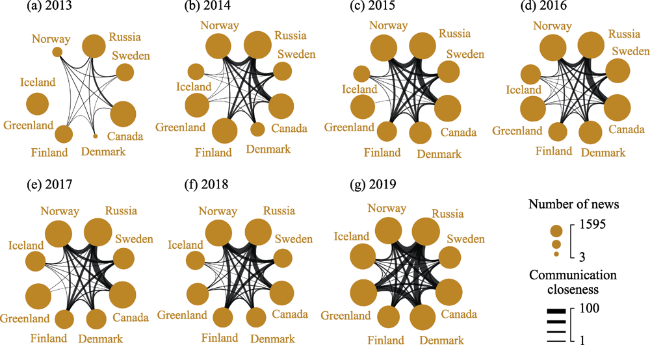
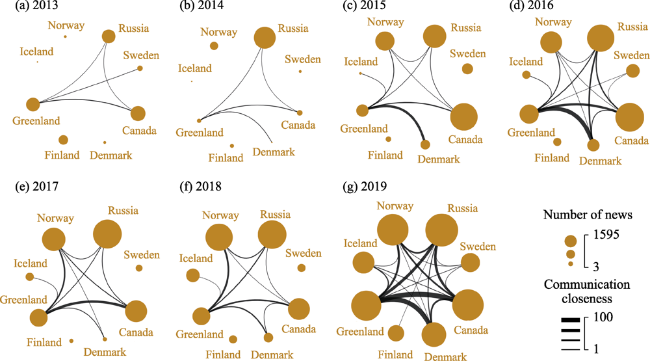
Figure 3 Changes in the national interaction network of military activity in the Arctic from 2013-2019 |
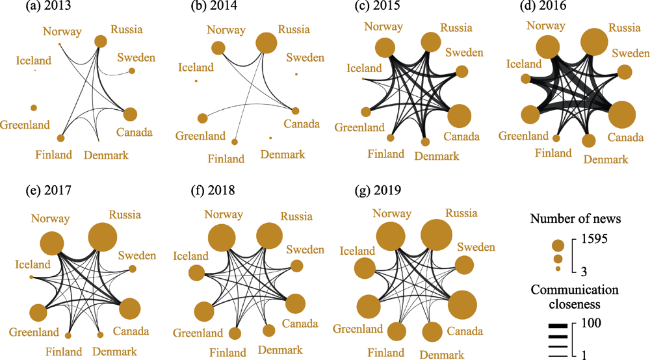
Figure 4 Changes in the national interaction network of channel traffic in the Arctic from 2013-2019 |
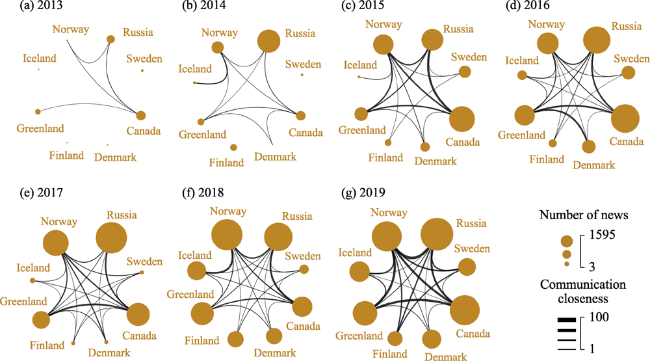
Figure 5 Changes in the national interaction network for climate change in the Arctic from 2013-2019 |
Figure 6 Changes in the national interaction network of shrunken ice cap theme from 2013-2019 |
Figure 7 Changes in the national interaction network for animal protection in the Arctic from 2013-2019. |
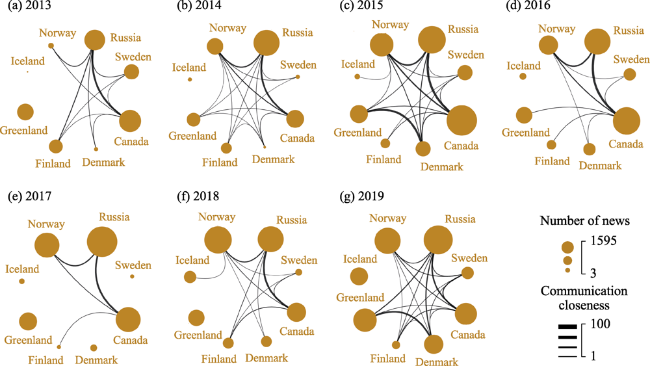
Figure 8 Changes in the national interaction network for resources in the Arctic from 2013-2019 |
Figure 9 Changes in the national interaction network for economic activity in the Arctic from 2013-2019 |
Table 5 Sentiment analysis of national interactive networks in the Arctic in 2019 |
| Interaction | Very negative | Nega- tive | Neu- tral | Posi- tive | Very positive | Interaction | Very negative | Nega- tive | Neu- tral | Posi- tive | Very positive |
|---|---|---|---|---|---|---|---|---|---|---|---|
| Canada-Russia | 1 | 125 | 2351 | 21 | 0 | Finland-Sweden | 0 | 10 | 893 | 10 | 0 |
| Norway-Russia | 0 | 54 | 2107 | 20 | 0 | Canada-Sweden | 0 | 18 | 857 | 1 | 0 |
| Denmark-Greenland | 0 | 10 | 1848 | 7 | 0 | Greenland-Norway | 0 | 4 | 818 | 19 | 1 |
| Canada-Greenland | 1 | 27 | 1568 | 18 | 0 | Iceland-Russia | 0 | 5 | 815 | 12 | 0 |
| Greenland-Russia | 0 | 41 | 1485 | 11 | 0 | Denmark-Sweden | 0 | 10 | 754 | 12 | 0 |
| Denmark-Russia | 0 | 9 | 1435 | 8 | 0 | Greenland-Iceland | 1 | 25 | 686 | 20 | 0 |
| Canada-Norway | 0 | 12 | 1394 | 17 | 0 | Canada-Finland | 0 | 45 | 647 | 8 | 2 |
| Finland-Russia | 0 | 72 | 1301 | 4 | 0 | Canada-Iceland | 1 | 8 | 632 | 16 | 0 |
| Norway-Sweden | 0 | 18 | 1136 | 14 | 0 | Denmark-Finland | 0 | 4 | 637 | 8 | 1 |
| Russia-Sweden | 0 | 29 | 1046 | 3 | 0 | Denmark-Iceland | 0 | 3 | 624 | 12 | 0 |
| Denmark-Norway | 0 | 7 | 957 | 19 | 0 | Finland-Iceland | 0 | 3 | 523 | 14 | 0 |
| Canada-Denmark | 0 | 5 | 953 | 10 | 0 | Iceland-Sweden | 0 | 7 | 487 | 8 | 0 |
| Iceland-Norway | 0 | 7 | 916 | 28 | 0 | Greenland-Sweden | 2 | 15 | 412 | 0 | 0 |
| Finland-Norway | 1 | 23 | 903 | 16 | 0 | Finland-Greenland | 0 | 8 | 380 | 1 | 0 |
Note: The values in the table are the number of news items in different sentiment categories in the national interactive network; sentiment scores of [-100, -10) are “very negative,” [-10, -5) are “negative,” [-5, 5) are “neutral,” [” and [10,100] are “very positive.” The table is arranged in descending order of the total number of news items. |
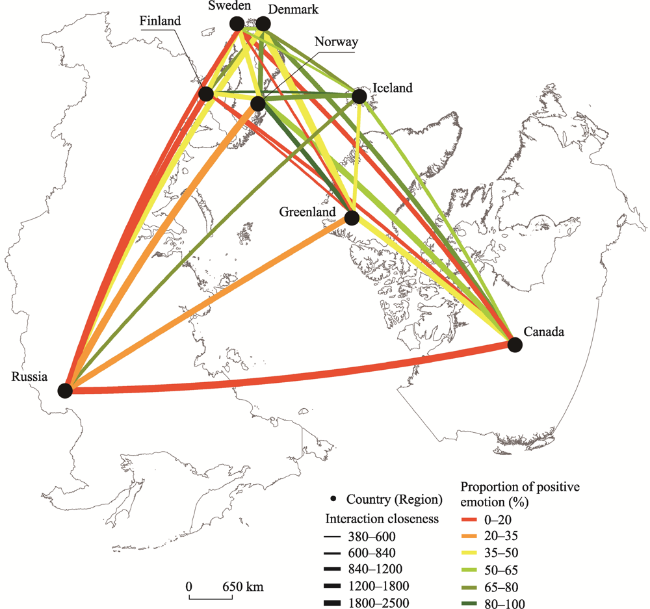
Figure 10 Spatial distribution of national interactive networks in the Arctic in 2019 |
| [1] |
|
| [2] |
|
| [3] |
|
| [4] |
|
| [5] |
|
| [6] |
|
| [7] |
|
| [8] |
|
| [9] |
|
| [10] |
|
| [11] |
|
| [12] |
|
| [13] |
|
| [14] |
|
| [15] |
|
| [16] |
|
| [17] |
|
| [18] |
|
| [19] |
|
| [20] |
|
| [21] |
|
| [22] |
|
| [23] |
|
| [24] |
|
| [25] |
|
| [26] |
|
/
| 〈 |
|
〉 |