
Journal of Geographical Sciences >
Increasing probability of concurrent drought between the water intake and receiving regions of the Hanjiang to Weihe River Water Diversion Project, China
|
Wang Xiaohong (1998-), Master Candidate, specialized in remote sensing of ecological environment. E-mail: sherryhale@163.com |
Received date: 2021-12-24
Accepted date: 2022-03-14
Online published: 2022-12-25
Supported by
National Natural Science Foundation of China(42171095)
National Natural Science Foundation of China(41801333)
Natural Science Foundation of Shaanxi Province(2020JQ-417)
Social Science Foundation of Shaanxi Province(2020D039)
Water diversion projects are an effective measure to mitigate water shortages in water-limited areas. Understanding the risk of such projects increasing concurrent drought between the water intake and receiving regions is essential for sustainable water management. This study calculates concurrent drought probability between the water intake and receiving regions of the Hanjiang to Weihe River Water Diversion Project using Standardized Precipitation Index and Copula functions. Results showed an increasing trend in drought probability across both the water intake and receiving regions from 2.67% and 8.38% to 12.47% and 14.18%, respectively, during 1969-2018. The return period of concurrent drought decreased from 111.11 to 13.05 years, indicating larger risk of simultaneous drought between the two regions. Projections from CMIP6 suggested that under the SSP 2-4.5 and 5-8.5 scenarios, concurrent drought probability would increase by 2.40% and 7.72% in 2019-2050 compared to that in 1969-1990, respectively. Although increases in precipitation during 2019-2050 could potentially alleviate drought conditions relative to those during 1991-2018, high precipitation variability adds to the uncertainty about future concurrent drought. These findings provide a basis for better understanding concurrent drought and its impact on water diversion projects in a changing climate, and facilitate the establishment of adaptation countermeasures to ensure sustainable water availability.
WANG Xiaohong , LIU Xianfeng , SUN Gaopeng . Increasing probability of concurrent drought between the water intake and receiving regions of the Hanjiang to Weihe River Water Diversion Project, China[J]. Journal of Geographical Sciences, 2022 , 32(10) : 1998 -2012 . DOI: 10.1007/s11442-022-2033-2
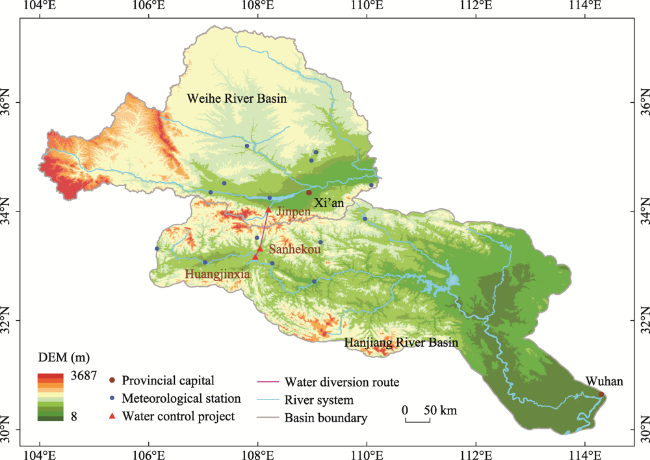
Figure 1 Summary of the study area |
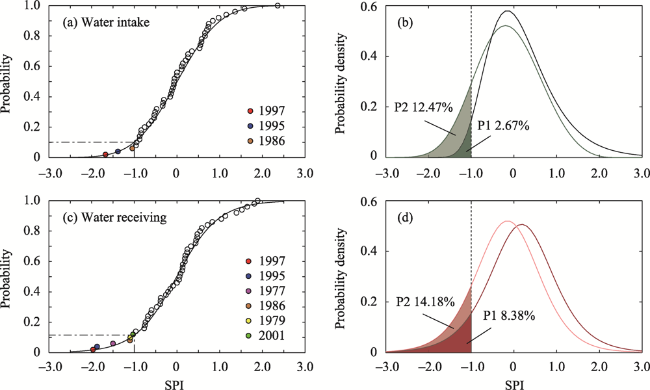
Figure 2 Probability distribution of 12-month SPI in the water intake (a) and receiving (c) regions during 1969- 2018. Probability density curves of 12-month SPI in the water intake (b) and receiving (d) regions in 1969-1990 (P1) and 1991-2018 (P2). The intersection of the black dashed lines represents the threshold of drought. The shaded portions and percentages represent the probability of meteorological drought (when SPI < -1). |
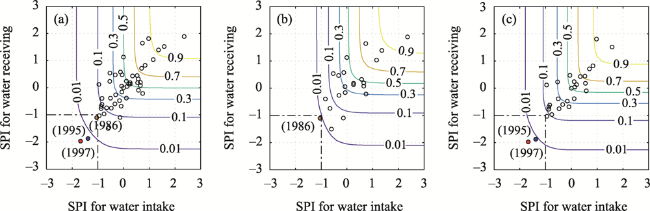
Figure 3 Probabilities of concurrent drought between the water intake and receiving basins during (a) 1969-2018, (b) 1969-1990 and (c) 1991-2018. The intersection of the black dashed lines represents concurrent drought occurred in the two areas. |
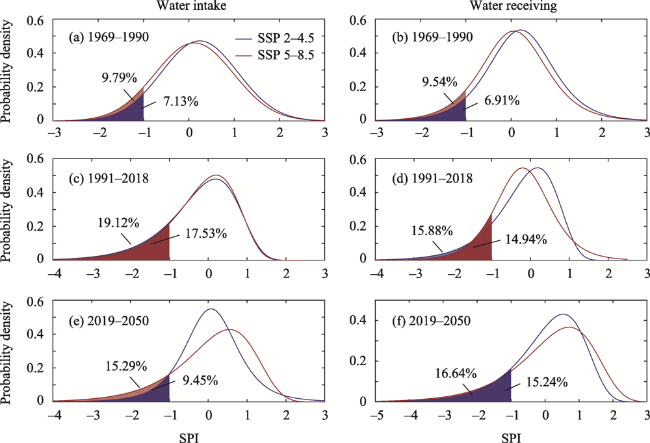
Figure 4 Probability density curves of 12-month SPI in the water intake and receiving regions in 1969-1990 (a, b), 1991-2018 (c, d) and 2019-2050 (e, f) based on CMIP6 outputs. The shaded portions and percentages represent drought probabilities (When SPI smaller than -1). |
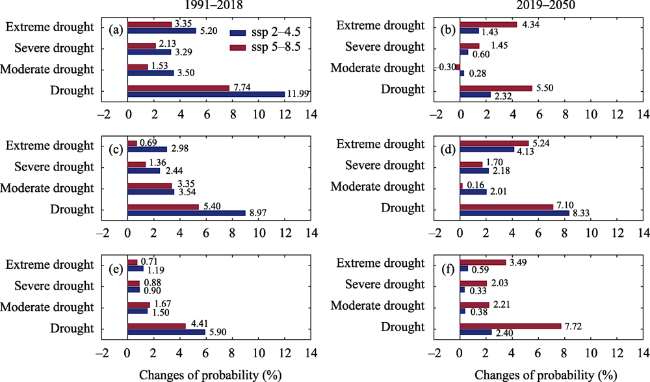
Figure 5 Changes in drought probabilities (%) under the SSP 2-4.5 and SSP 5-8.5 scenarios in 1991-2018 and 2019-2050 compared to those during 1969-1990 in the water intake (a, b) and receiving regions (c, d). Variations in probability of concurrent drought are shown in e and f. |
Table A1 Brief description of the subprojects of the Hanjiang to Weihe River Water Diversion Project |
| Name of the Subproject | Location | Water storage (106 m3) | Maximum height (m) | Designed discharge (m³/s) | Function |
|---|---|---|---|---|---|
| Huangjinxia Water Control Project | Upper Hanjiang, 62 km from Yang County | 229 | 68 | 70 | Water supply, power generation and improvement of navigation conditions |
| Sanhekou Water Control Project | 2 km from the junction of Jiaoxi River, Pu River and Wenshui River | 710 | 145 | 50 | Regulating and storing water |
| Qinling water conveyance tunnel | Connect the Sanhekou Water Control Project and the Huangchi River in Zhouzhi County | / | / | 70 | Transport water |
Table A2 Basic information of meteorological stations |
| Name | ID | Longitude | Latitude | Elevation (m) |
|---|---|---|---|---|
| Changwu | 53929 | 35°12'N | 107°48'E | 1206.5 |
| Tongchuan | 53947 | 35°05'N | 109°04'E | 978.9 |
| Baoji | 57016 | 34°21'N | 107°08'E | 612.4 |
| Fengxiang | 57025 | 34°31'N | 107°23'E | 781.1 |
| Yaoxian | 57037 | 34°56'N | 108°59'E | 710.0 |
| Huashan | 57046 | 34°29'N | 110°05'E | 2064.9 |
| Lueyang | 57106 | 33°19'N | 106°09'E | 794.2 |
| Hanzhong | 57127 | 33°04'N | 107°02'E | 509.5 |
| Foping | 57134 | 33°31'N | 107°59'E | 827.2 |
| Shangzhou | 57143 | 33°52'N | 109°58'E | 742.2 |
| Zhenan | 57144 | 33°26'N | 109°09'E | 693.7 |
| Shiquan | 57232 | 33°03'N | 108°16'E | 484.9 |
| Wugong | 57234 | 34°15'N | 108°13'E | 447.8 |
| Ankang | 57245 | 32°43'N | 109°02'E | 290.8 |
Table A3 CMIP6 models and corresponding variables used in this study along with Pearson correlation coefficient with site observations at a significance level of p < 0.01. Only one ensemble member (r1i1p1f1) was used for each model. All the GCM outputs were interpolated into 0.5° × 0.5° for further analysis |
| Model abbreviation | Institute ID | Horizontal resolution (°lon × °lat) | Ensembles variables | Study area | ||
|---|---|---|---|---|---|---|
| Water intake | Water receiving | |||||
| BCC-CSM2-MR | BCC | 1.125, 1.125 (gn) | r1i1p1f1 | pr | 0.5938 | 0.5388 |
| BCC-CSM2-MR | BCC | 1.125, 1.125 (gn) | r1i1p1f1 | ta | 0.9732 | 0.9738 |
| CNRM-CM6-1 | CNRM-CERFACS | 1.406, 1.406 (gr) | r1i1p1f1 | pr | 0.4633 | 0.4126 |
| FGOALS-f3-L | LASG-CESS | 1.25, 1 (gr) | r1i1p1f1 | pr | 0.5778 | 0.5135 |
| GFDL-ESM4 | NOAA GFDL | 1.25, 1 (gr1) | r1i1p1f1 | pr | 0.5447 | 0.5310 |
| MIROC6 | MIROC | 1.406, 1.406 (gn) | r1i1p1f1 | pr | 0.5403 | 0.4820 |
| MRI-ESM2-0 | MRI | 1.125, 1.125 (gn) | r1i1p1f1 | pr | 0.4598 | 0.4101 |
| MPI-ESM1-2-LR | MPI-M | 1.875, 1.875 (gn) | r1i1p1f1 | ta | 0.9739 | 0.9735 |
Table A4 Classification of drought according to SPI |
| Index value | Category |
|---|---|
| Extreme drought | SPI ≤ ‒2.0 |
| Severe drought | -2.0 < SPI ≤ ‒1.5 |
| Moderate drought | -1.5 < SPI ≤ ‒1.0 |
| Near normal | -1.0 < SPI ≤ 1.0 |
| Moderately wet | 1.0 < SPI ≤ 1.5 |
| Very wet | 1.5 < SPI ≤ 2.0 |
| Extremely wet | SPI > 2.0 |
Table A5 Goodness-of-fit values of the five probability distributions of SPI in both areas in 1969-2018 |
| Region | Margin | p value |
|---|---|---|
| Water intake | Normal | 0.9837 |
| Logistic | 0.9057 | |
| Generalized extreme value | 0.9675 | |
| t location-scale | 0.9762 | |
| Extreme value | 0.3369 | |
| Water receiving | Normal | 0.9246 |
| Logistic | 0.9627 | |
| Generalized extreme value | 0.8944 | |
| t location-scale | 0.9389 | |
| Extreme value | 0.3159 |
Table A6 The correlation coefficient of SPI in the water intake and receiving regions |
| Data source | Period | Pearson (rn) | Spearman (ρn) | Kendall (τn) |
|---|---|---|---|---|
| Observation | 1969-2018 | 0.8154 | 0.7565 | 0.5902 |
| Simulation under SSP 2-4.5 | 1969-2050 | 0.8016 | 0.7634 | 0.5748 |
| Simulation under SSP 5-8.5 | 1969-2050 | 0.8295 | 0.8231 | 0.6387 |
Table A7 Goodness-of-fit values of Copula functions between the optimal marginal distributions in the two regions |
| Period | 1969-2018 | 1969-1990 | 1991-2018 | ||||
|---|---|---|---|---|---|---|---|
| criterion | AIC | BIC | AIC | BIC | AIC | BIC | |
| Copulas | t | -2291.16 | -2271.69 | -1887.2 | -1867.7 | -2071.8 | -2052.3 |
| Gaussian | -2297.85 | -2278.38 | -1887.8 | -1868.4 | -2074.4 | -2055.0 | |
| Clayton | -2240.16 | -2220.69 | -1885.5 | -1866.0 | -2045.9 | -2026.4 | |
| Gumbel | -2387.53 | -2368.06 | -1942.7 | -1923.3 | -2129.4 | -2109.9 | |
| Frank | -2398.88 | -2379.41 | -1974.7 | -1955.2 | -2172.2 | -2152.7 | |
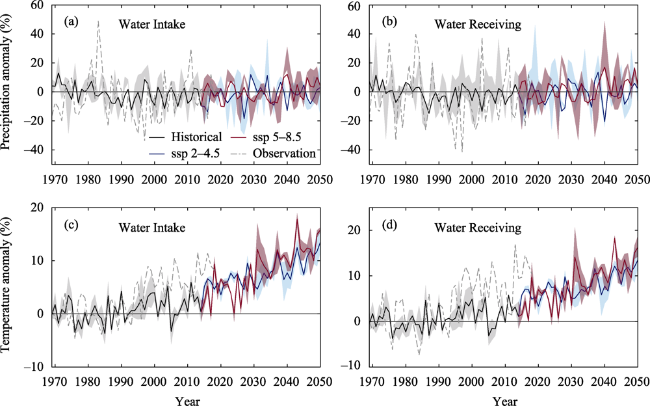
Figure A1 Variations in annual precipitation and mean temperature in the water intake (a, c) and water receiving (b, d) basins in 1969-2050 compared to multi-year average in 1969-1990. The solid lines and shaded areas indicate the averages and extreme value of CMIP6 outputs. |
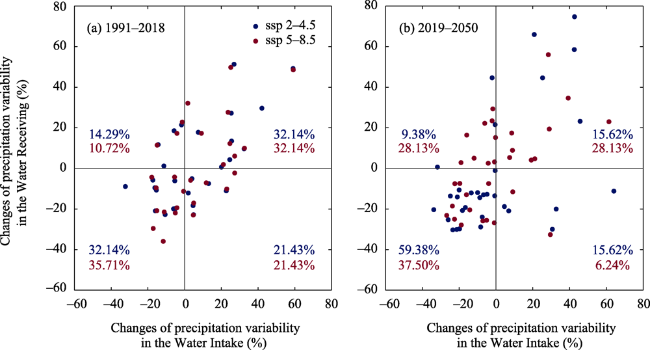
Figure A2 Variations in precipitation variability in the water intake versus water receiving basins in 1991-2018 (a), 2019-2050 (b) relative to the multi-year average in 1970-1990. The steps for calculating precipitation variability are as follows: 1) 12-month SPI series in the two regions in 1969-2050 are calculated based on monthly precipitation under the SSP 2-4.5 and 5-8.5 scenarios, respectively; 2) calculate the standard deviation of 12-month SPI in each year from 1970-2050, which represents the precipitation variability in the corresponding year. The precipitation variability in 1969 is ignored because 12-month SPI in 1969 has only one value. |
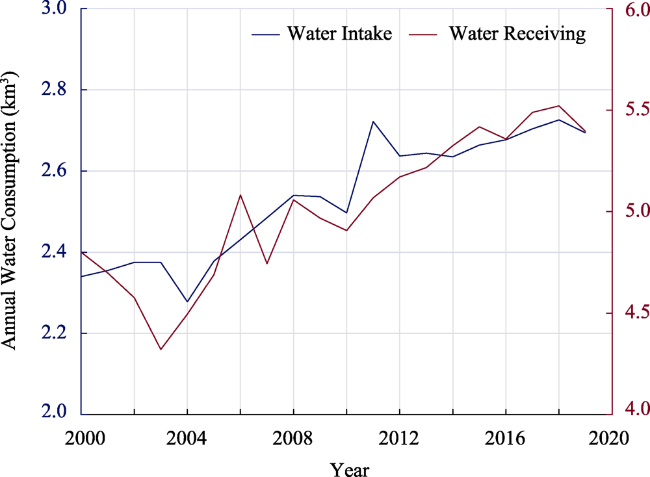
Figure A3 Annual water consumption in the water intake and receiving regions in 2000-2019 (Collected from the Annual Bulletin of Water Resources in Shaanxi Province, available at: http://slt.shaanxi.gov.cn/) |
| [1] |
|
| [2] |
|
| [3] |
|
| [4] |
|
| [5] |
|
| [6] |
|
| [7] |
|
| [8] |
|
| [9] |
China Meteorological Administration (CMA), 1995. Shaanxi has a rare drought this year. Accessed 15 October 2021. http://www.cma.gov.cn/kppd/kppdqxsj/kppdtqqh/201212/t20121214_196461.html.
|
| [10] |
|
| [11] |
|
| [12] |
|
| [13] |
|
| [14] |
|
| [15] |
|
| [16] |
|
| [17] |
|
| [18] |
|
| [19] |
|
| [20] |
|
| [21] |
|
| [22] |
|
| [23] |
|
| [24] |
|
| [25] |
Hubei Provincial Department of Water Resources (HPDWR), 2014. Jingmen Bureau emergency monitoring for the operation of the Yangtze-to-Hanjiang water diversion project. Accessed 15 October 2021. http://slt.hubei.gov.cn/sw/zzjg/jcdt/jmsw/201408/t20140812_3161232.shtml.
|
| [26] |
|
| [27] |
|
| [28] |
|
| [29] |
|
| [30] |
|
| [31] |
|
| [32] |
|
| [33] |
|
| [34] |
|
| [35] |
|
| [36] |
|
| [37] |
|
| [38] |
|
| [39] |
|
| [40] |
|
| [41] |
|
| [42] |
|
| [43] |
|
| [44] |
Ministry of Water Resources of the People’s Republic of China (MWR-PRC), 2016a. The proposal of the second phase project of the Han-to-Wei Water Diversion Project passed the review of the Ministry of Water Resources. Accessed 15 October 2021. http://www.mwr.gov.cn/xw/dfss/201702/t20170212_821844.html.
|
| [45] |
Ministry of Water Resources of the People’s Republic of China (MWR-PRC), 2016b. The dam for the Sanhekou Water Control Project of the Han-to-Wei Water Diversion Project has officially started to pour. Accessed 15 October 2021. http://www.mwr.gov.cn/ztpd/2015ztbd/jktjjsgszdslgcjs/jzcx/201611/t20161121_772290.html.
|
| [46] |
|
| [47] |
|
| [48] |
|
| [49] |
|
| [50] |
|
| [51] |
|
| [52] |
|
| [53] |
|
| [54] |
Shaanxi Provincial Department of Water Resources (SPDWR), 2020. Reply letter to the 3rd meeting of the 12th Provincial CPPCC No.894. Accessed 15 October 2021. http://slt.shaanxi.gov.cn/zfxxgk/fdzdgknr/jyta/202011/t20201118_2119133.html.
|
| [55] |
|
| [56] |
|
| [57] |
|
| [58] |
|
| [59] |
|
| [60] |
|
| [61] |
|
| [62] |
|
| [63] |
|
| [64] |
|
| [65] |
|
| [66] |
|
| [67] |
|
| [68] |
|
| [69] |
|
| [70] |
|
| [71] |
|
| [72] |
|
| [73] |
|
| [74] |
|
| [75] |
|
| [76] |
|
| [77] |
|
| [78] |
|
| [79] |
|
| [80] |
|
| [81] |
|
| [82] |
|
| [83] |
|
| [84] |
|
| [85] |
|
/
| 〈 |
|
〉 |