
Journal of Geographical Sciences >
Spatio-temporal correlation between human activity intensity and land surface temperature on the north slope of Tianshan Mountains
|
Chen Hongjin (1998-), Master Candidate, specialized in the research of human activity intensity and the human-land relationship. E-mail: ZLYZXLX@163.com |
Received date: 2022-05-22
Accepted date: 2022-07-10
Online published: 2022-12-25
Supported by
National Natural Science Foundation of China(41461086)
National Natural Science Foundation of China(41761108)
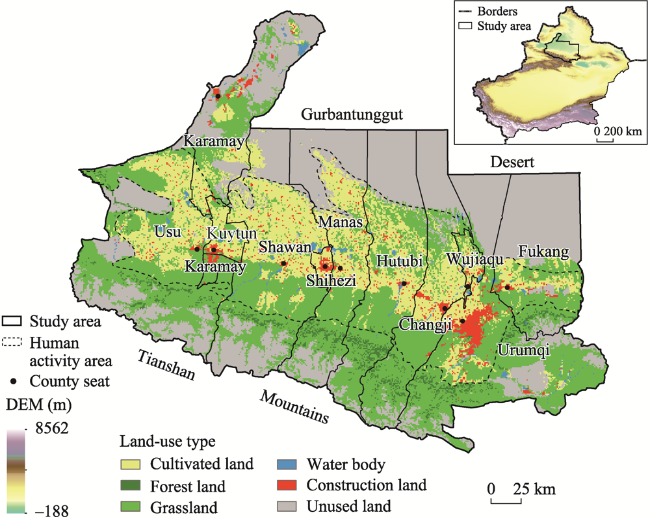
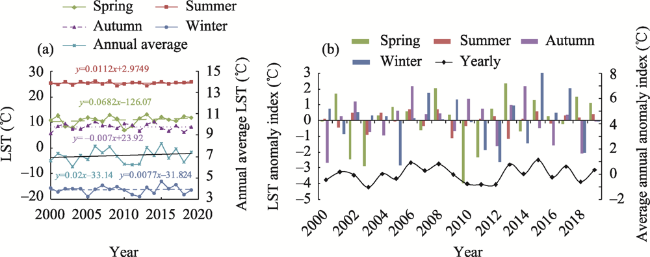
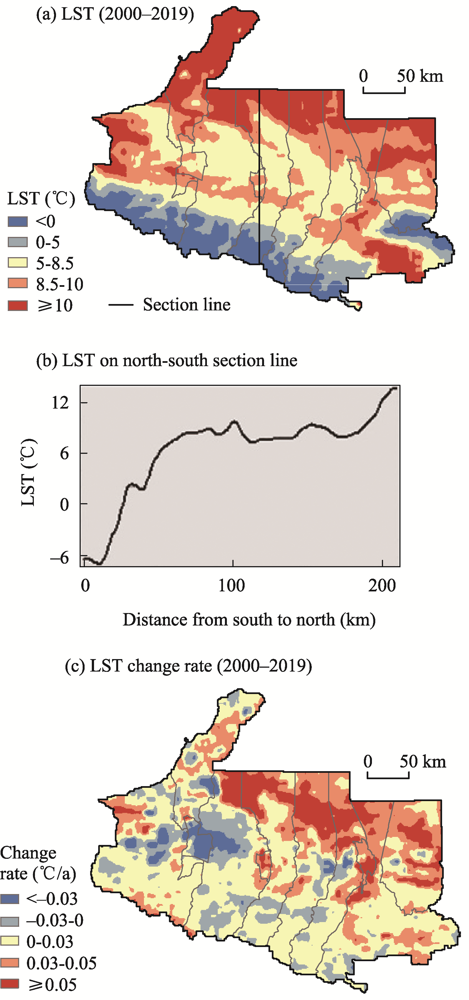
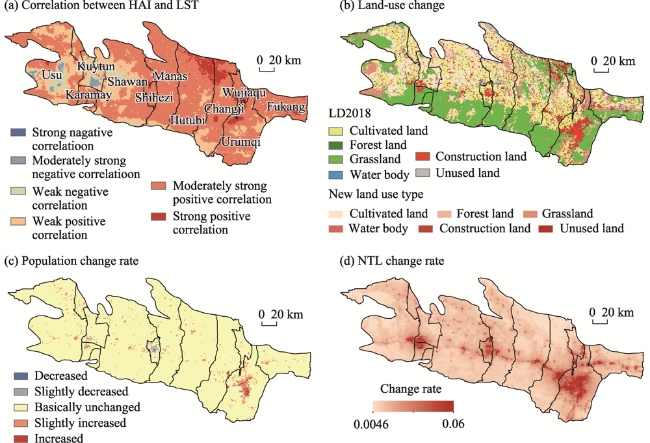
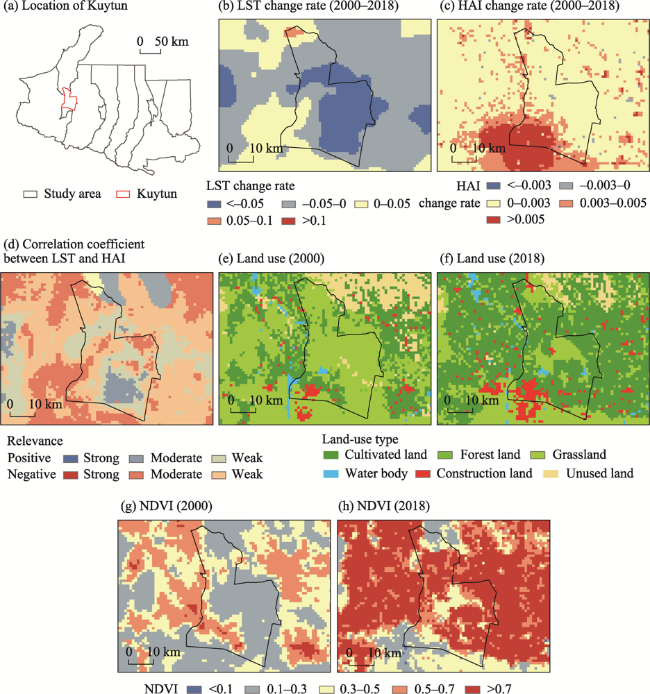
Research on the spatio-temporal correlation between the intensity of human activities and the temperature of earth surfaces is of great significance in many aspects, including fully understanding the causes and mechanisms of climate change, actively adapting to climate change, pursuing rational development, and protecting the ecological environment. Taking the north slope of Tianshan Mountains, located in the arid area of northwestern China and extremely sensitive to climate change, as the research area, this study retrieves the surface temperature of the mountain based on MODIS data, while characterizing the intensity of human activities thereby data on the night light, population distribution and land use. The evolution characteristics of human activity intensity and surface temperature in the study area from 2000 to 2018 were analyzed, and the spatio-temporal correlation between them was further explored. It is found that: (1) The average human activity intensity (0.11) in the research area has kept relatively low since this century, and the overall trend has been slowly rising in a stepwise manner (0.0024·a-1); in addition, the increase in human activity intensity has lagged behind that in construction land and population by 1-2 years. (2) The annual average surface temperature in the area is 7.18 ℃ with a pronounced growth. The rate of change (0.02 ℃·a-1) is about 2.33 times that of the world. The striking boost in spring (0.068 ℃·a-1) contributes the most to the overall warming trend. Spatially, the surface temperature is low in the south and high in the north, due to the prominent influence of the underlying surface characteristics, such as elevation and vegetation coverage. (3) The intensity of human activity and the surface temperature are remarkably positively correlated in the human activity areas there, showing a strong distribution in the east section and a weak one in the west section. The expression of its spatial differentiation and correlation is comprehensively affected by such factors as scopes of human activities, manifestations, and land-use changes. Vegetation-related human interventions, such as agriculture and forestry planting, urban greening, and afforestation, can effectively reduce the surface warming caused by human activities. This study not only puts forward new ideas to finely portray the intensity of human activities but also offers a scientific reference for regional human-land coordination and overall development.
CHEN Hongjin , LIU Lin , ZHANG Zhengyong , LIU Ya , TIAN Hao , KANG Ziwei , WANG Tongxia , ZHANG Xueying . Spatio-temporal correlation between human activity intensity and land surface temperature on the north slope of Tianshan Mountains[J]. Journal of Geographical Sciences, 2022 , 32(10) : 1935 -1955 . DOI: 10.1007/s11442-022-2030-5
Figure 1 Overview of the study area (north slope of Tianshan Mountains) |
Table 1 Data sources |
| Data | Spatial Resolution | Time | Sources |
|---|---|---|---|
| MOD11C3 | 0.05°×0.05° | 2000-2019 | ladsweb.nascom.nasa.gov/data/search |
| LU | 1 km×1 km | 2005, 2010, 2015, 2018 | http://www.resdc.cn/Default.aspx |
| NDVI | 1 km×1 km | 2000-2018 | http://www.resdc.cn/Default.aspx |
| DMSP/OLS | 1 km×1 km | 2000-2013 | http://www.resdc.cn/Default.aspx |
| NPP-VIIRS | 500 m×500 m | 2014-2018 | https://ngdc.noaa.gov/eog/dmsp/downloadV4composites.html |
| PD | 1 km×1 km | 2000-2018 | https://landscan.ornl.gov/landscan-datasets |
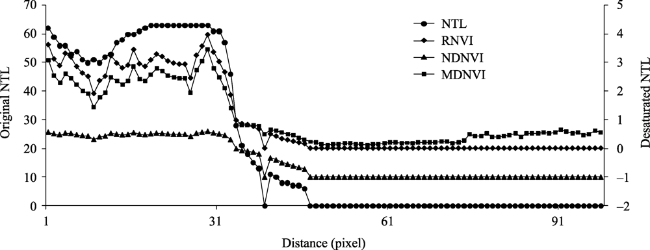
Figure 2 Comparison of night light brightness value and saturation index value of the zonal transect on the north slope of Tianshan Mountains in 2010 |
Table 2 Weight of land-use type |
| Land-use type | Cultivated land | Forest land | Grassland | Water body | Construction land | Unused land |
|---|---|---|---|---|---|---|
| Weights | 0.30 | 0.05 | 0.05 | 0.05 | 0.55 | 0.00 |
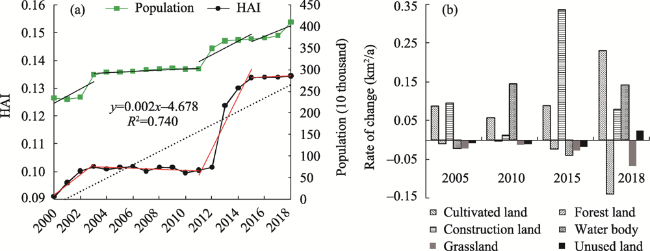
Figure 3 Annual average HAI and population changes (a) and area change rate of various land-use types (b) on the north slope of Tianshan Mountains, 2000-2018 |
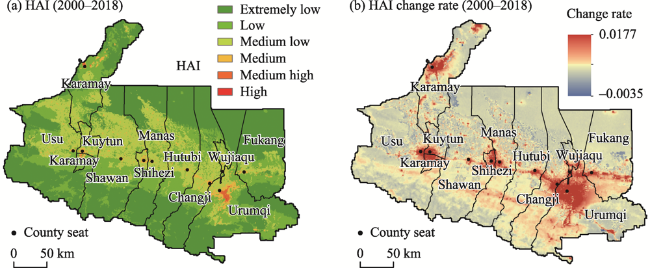
Figure 4 Spatial distribution of the intensity (a) and change rate (b) of human activity on the north slope of Tianshan Mountains, 2000-2018 |
Figure 5 Average surface temperature, seasonal variation and surface temperature anomaly index on the north slope of Tianshan Mountains, 2000-2019 |
Figure 6 Average annual surface temperature (a) and inter-annual rate of change (b) on the north slope of Tianshan Mountains, 2000-2019 |
Figure 7 The correlation coefficients between surface temperature and human activity intensity (a), land-use change (b), population(c) and NTL (d) change rate on the north slope of Tianshan Mountains, 2000-2018 |
Figure 8 LST, HAI, land use, NDVI and their changes in Kuytun, 2000-2018 |
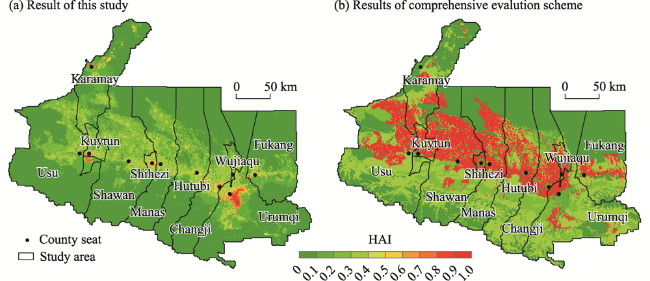
Figure 9 Comparison of different representations of human activity intensity on the north slope of Tianshan Mountains in 2018 |
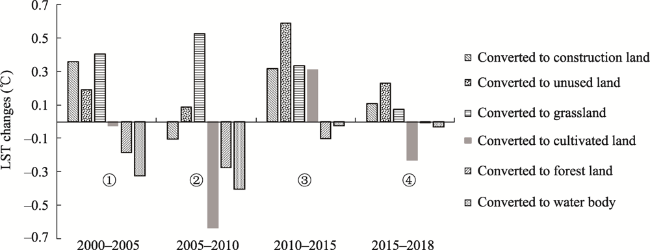
Figure 10 Surface temperature change in land use type conversion area |
| [1] |
|
| [2] |
|
| [3] |
|
| [4] |
|
| [5] |
|
| [6] |
|
| [7] |
|
| [8] |
|
| [9] |
|
| [10] |
|
| [11] |
|
| [12] |
|
| [13] |
|
| [14] |
|
| [15] |
|
| [16] |
|
| [17] |
|
| [18] |
|
| [19] |
|
| [20] |
|
| [21] |
|
| [22] |
|
| [23] |
|
| [24] |
|
| [25] |
|
| [26] |
|
| [27] |
|
| [28] |
|
| [29] |
|
| [30] |
|
| [31] |
|
| [32] |
|
| [33] |
|
| [34] |
|
| [35] |
|
| [36] |
|
| [37] |
|
| [38] |
|
| [39] |
|
| [40] |
|
| [41] |
|
| [42] |
|
| [43] |
|
| [44] |
|
| [45] |
|
| [46] |
|
| [47] |
|
| [48] |
|
| [49] |
|
| [50] |
|
| [51] |
|
| [52] |
|
| [53] |
|
| [54] |
|
| [55] |
|
| [56] |
|
| [57] |
|
| [58] |
|
| [59] |
|
| [60] |
|
| [61] |
|
| [62] |
|
| [63] |
|
/
| 〈 |
|
〉 |