Research Articles

Examining spatio-temporal variations in carbon budget and carbon compensation zoning in Beijing-Tianjin-Hebei urban agglomeration based on major functional zones

  • XIA Siyou , 1, 2 ,
  • YANG Yu , 1, 2, 3, *
Expand
  • 1.Key Laboratory of Regional Sustainable Development Modeling, Institute of Geographic Sciences and Natural Resources Research, CAS, Beijing 100101, China
  • 2.College of Resources and Environment, University of Chinese Academy of Sciences, Beijing 100049, China
  • 3.Institute of Strategy Research of Guangdong-Hong Kong-Macao Greater Bay Area, Guangzhou 510070, China
* Yang Yu (1984-), PhD and Professor, E-mail:

Xia Siyou (1991-), PhD Candidate, specializing in energy geography and regional studies. E-mail:

Received date: 2022-03-31

  Accepted date: 2022-05-08

  Online published: 2022-12-25

Supported by

National Natural Science Foundation of China(42121001)

National Natural Science Foundation of China(42130712)

National Natural Science Foundation of China(42022007)

Youth Innovation Promotion Association, CAS(2018069)

Abstract

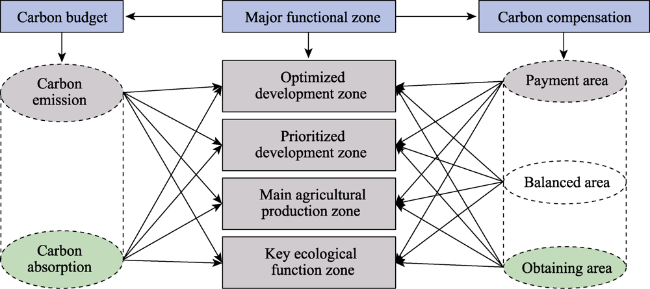
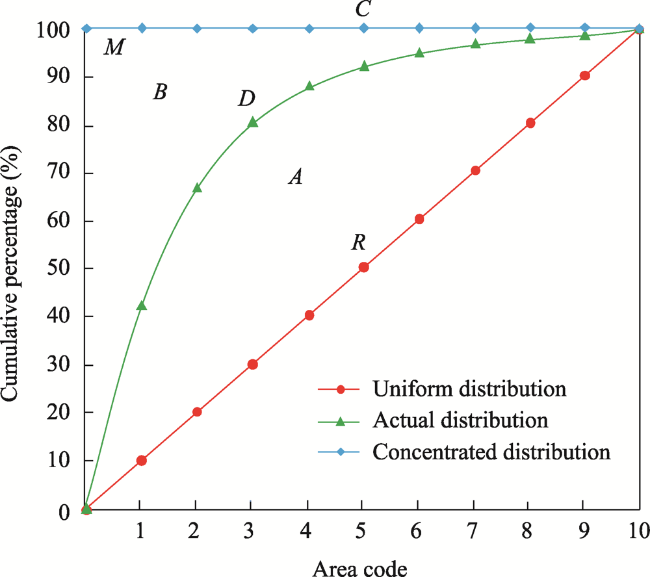
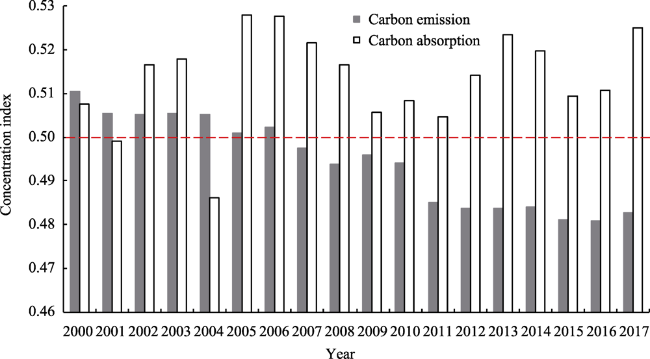
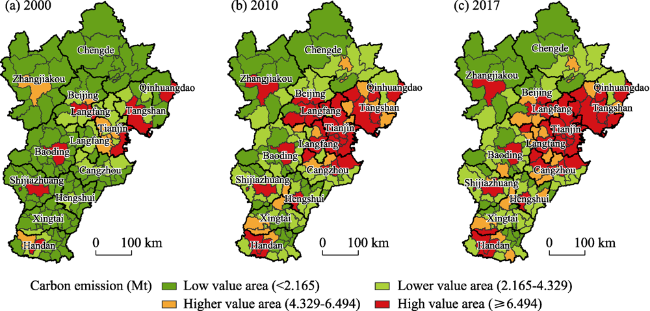
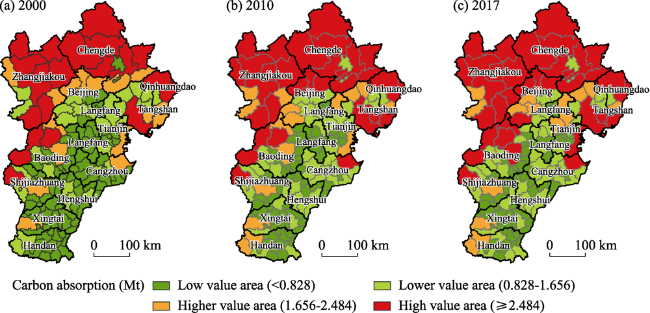
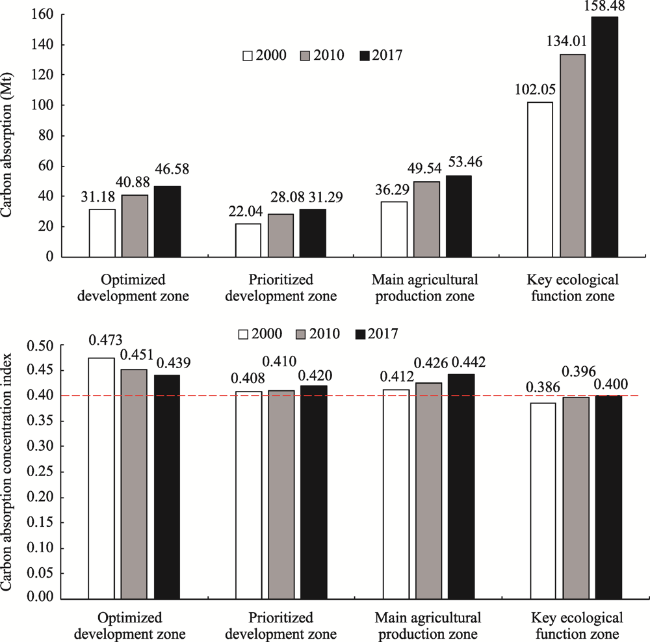
Research on the carbon budget and zoning for carbon compensation in major functional zones (MFZs) is important for formulating strategies for low-carbon development for each functional zone, promoting the collaborative governance of the regional ecological environment, and achieving high-quality development. Such work can also contribute to achieving peak emissions and carbon neutrality. This paper constructs a theoretical framework for the carbon budget and carbon compensation from the perspective of the MFZ, uses 157 county-level units of the Beijing-Tianjin-Hebei urban agglomeration (BTHUA) as the study area, and introduces the concentration index, normalized revealed comparative advantage index, and Self Organizing Mapping-K-means (SOM-K-means) model to examine spatio-temporal variations in the carbon budget and carbon compensation zoning for the BTHUA from the perspective of MFZs. The authors propose a scheme for the spatial minimization of carbon emissions as oriented by low-carbon development. The results show that: (1) From 2000 to 2017, the carbon budget exhibited an upward trend of volatility, its centralization index was higher than the “warning line” of 0.4, and large regional differences in it were noted on the whole. (2) There were significant regional differences in the carbon budget, and carbon emissions exhibited a core-periphery spatial pattern, with a high-value center at Beijing-Tianjin-Tangshan that gradually decreased as it moved outward. However, the spatial pattern of carbon absorption tended to be stable, showing an inverted “U-shaped” pattern. It was high in the east, north, and west, and was low in the middle and the south. (3) The carbon budget was consistent with the strategic positioning of the MFZ, and the optimized development zone and key development zone were the main pressure-bearing areas for carbon emissions, while the key ecological functional zone was the dominant zone of carbon absorption. The difference in the centralization index of carbon absorption among the functional zones was smaller than that in the centralization index of carbon emissions. (4) There were 53 payment areas, 64 balanced areas, and 40 obtaining areas in the study area. Nine types of carbon compensation zones were finally formed in light of the strategic objectives of the MFZ, and directions and strategies for low-carbon development are proposed for each type. (5) It is important to strengthen research on the carbon balance and horizontal carbon compensation at a microscopic scale, enrich the theoretical framework of regional carbon compensation, integrate it into the carbon trading market, and explore diversified paths for achieving peak emissions and carbon neutrality.

Cite this article

XIA Siyou , YANG Yu . Examining spatio-temporal variations in carbon budget and carbon compensation zoning in Beijing-Tianjin-Hebei urban agglomeration based on major functional zones[J]. Journal of Geographical Sciences, 2022 , 32(10) : 1911 -1934 . DOI: 10.1007/s11442-022-2029-y

1 Introduction

Climate change and its impacts constitute the most serious environmental problem facing the world today. As an important greenhouse gas, CO2 is closely related to global warming (Su et al., 2013; Liu et al., 2019). International consensus has developed around global emissions reduction to cope with global climate change, and more than 130 countries and regions around the world have put forward their goals of carbon neutrality. To limit the rise in global temperature to 2℃, or possibly 1.5℃, a commitment of the Paris Agreement, China has pledged to achieve peak carbon dioxide emissions by 2030 and carbon neutrality by 2060. During the 14th Five-Year Plan (2021-2025), China’s goal for the construction of an ecological civilization will focus on emissions reduction, encouraging the synergy between pollution and emissions reduction, and promoting the comprehensive and green transformation of economic and social development. According to the goal of carbon neutrality, we need to not only control the total amount of carbon emissions in China, but also realize synergy and fairness in carbon emissions reduction among regions of the country. The carbon budget is a focus of research on global climate change as well as an important aspect of China’s green and low-carbon development (Melillo et al., 2002; Allen et al., 2009; Hu et al., 2014). A considerable amount of research has been published on accounting for the carbon budget (Fang et al., 2015; Zhao et al., 2016b), spatial and temporal differences in it (Zhao et al., 2014; Zhang et al., 2015), the relationships between the carbon budget and the industrial structure (Xu et al., 2014), economic growth (Wang et al., 2017), and land use structure (Fan et al., 2018), and factors influencing the carbon budget (Lai, 2010; Zhang et al., 2013; Zhao et al., 2016a). Regional differences lead to different capacities of the carbon budget in different regions, and carbon compensation has emerged as a new field in the backdrop of global climate change, and green and low-carbon development. Research on carbon compensation has mainly been carried out from both theoretical and empirical perspectives. At the theoretical level, scholars have explained the connotations and essential characteristics of regional carbon compensation, summarized the basic framework of the model and system for carbon compensation (Li et al., 2013; Zhao et al., 2015), and proposed building a balanced account of the “carbon source and carbon sink” as well as a “national carbon compensation system” based on the differences in regional carbon sources/sinks (CECPA, 2008). At the empirical level, considerable research has been carried out on the mechanism of allocation of carbon emission quotas (Zhang et al., 2014), regional carbon compensation zoning (Zhao et al., 2014; 2016b; Li et al., 2019), and willingness to engage in carbon compensation (Wang et al., 2020) while considering forests (Galik et al., 2009), wetlands (Shen, 2013), agricultural land (Li, 2014), and tourist destinations (Ding, 2015).
As areas with a high concentration of population and economic activities that are driven by rapid industrialization and urbanization, urban agglomerations inevitably become the hub of environmental pollution and carbon emissions. The Beijing-Tianjin-Hebei urban agglomeration (BTHUA) is representative of this (Zhou et al., 2016a; 2020). The GDP of the Beijing-Tianjin-Hebei region was 8.5 trillion yuan in 2018, accounting for 9.44% of the national GDP. The region is also a major base of heavy industry in China, with carbon emissions of 1.085 billion tons in 2018 that accounted for about a ninth of total carbon emissions in the country. Environmental pollution characterized by CO2 emissions has become a major obstacle to the high-quality development of the Beijing-Tianjin-Hebei region (Zhou et al., 2017; Zang et al., 2020). The pattern of emission of CO2 in the BTHUA shows significant stratification and aggregation. However, the status of the supply and demand of carbon sequestration services in the region exhibits significant spatial heterogeneity. Areas with a surplus of carbon sequestration services are mostly concentrated in the north while those with deficits in them are mostly concentrated in Beijing and the south (Wang et al., 2014; Zhang et al., 2021). This pattern is closely related to the energy efficiency, economic growth, industrial structure, and energy structure of different cities (Zhou, 2016b; Li et al., 2017; Zhao et al., 2018). Achieving carbon equity among regions and formulating collaborative schemes for carbon reduction have become the key to promoting the collaborative innovation and development of the BTHUA.
As an important means of national spatial governance, the major functional zones (MFZs) originate from regional function theory, take into account the natural ecosystem and socio-economic system based on differences in functions of regional development, and divide the national space into four types: optimized development zone, prioritized development zone, restricted development zone, and prohibited development zone. The MFZ is the general blueprint for national spatial planning to develop specific functional zones according to local conditions and construct a reasonable spatial pattern of regional development (Fan, 2007; 2013). The MFZ strategy covers the dual objectives of economic development and ecological protection, and defines the functions of regions in the division of land and space in the form of functional zones. It is a new idea for regional economic development and environmental protection, and a major innovation in forming a pattern of development for land space in which the population, economy, resources, and environment are coordinated. It is important for building a regional system with a harmonious relationship between humans and land (Fan, 2015). After the State Council promulgated and implemented the National MFZ Plan in 2011, Beijing, Tianjin, and Hebei implemented it to promote resource conservation and environmental protection to ensure sustainable development. However, there are major differences in the intensity of spatial development of land, functional orientation, and direction of development in different MFZs. On the one hand, it may aggravate the imbalance between socio-economic development and ecological protection among MFZs (Wen et al., 2015). On the other hand, it may cause a difference in the combination of spaces for the carbon source and the carbon sink in each MFZ, and thus affect the spatial differentiation of the regional carbon budget and relationship of carbon compensation (Li et al., 2019). Analyzing spatial and temporal differences in the carbon budget and zoning for carbon compensation from the perspective of the MFZ is useful for realizing regional carbon equity and the coordinated reduction of carbon emissions. This also constitutes an important contribution of geographical thinking to the goals of carbon neutrality and low-carbon development.
Based on the above, this paper takes 157 county-level units in the BTHUA as the research object to explore the characteristics of spatial differentiation in the carbon budget and the scheme for carbon compensation in the BTHUA and its MFZs from 2000 to 2017. The scale of the research object was chosen based on two considerations. On the one hand, the county, as the basic unit of the national MFZ (Mao, 1991), is a combination of the macroscopic formulation of policy and its microscopic implementation. Research on the carbon budget at the county level is thus important for identifying the heterogeneity of regional strategies for carbon emissions reduction and implementing national policies to this end. On the other hand, there is still a relative lack of research at the current spatial scale on the carbon budget and carbon compensation at the county level. Although some scholars have discussed the carbon budget at the county level (Zhao et al., 2014; Li et al., 2019), most such analyses are based on cross-sectional data. It is thus important to strengthen research on the carbon budget over the longer term by scaling down the basic research units to the county level.

2 Research methods and data sources

2.1 Theoretical framework

Based on the core idea of regional function, this paper constructs a theoretical framework for the carbon budget and carbon compensation from the perspective of the MFZ (Figure 1). We first analyze the spatio-temporal variations of carbon budget among four MFZs—the optimized development zone, prioritized development zone, main agricultural production zone, and key ecological function zone. Then combined with the total amount of carbon emission, economic contribution capacity of carbon emission, ecological carrying capacity of carbon emission and land development degree, the carbon compensation payment area, balanced area and obtaining area are divided. Following this, we propose a zoning scheme for carbon compensation by considering the MFZ and carbon compensation zoning.
Figure 1 Theoretical framework of the carbon budget and carbon compensation under the major functional zones
First, the differences in regional functions form the basis for differences in the carbon budget. The optimized development zone and prioritized development zone can yield strong economic benefits, but their economic development generates large carbon emissions that have significant negative effects on the ecological environment. The main agricultural production zone and the key ecological function zone have significant positive effects on the ecological environment, but their protection of ecological functions inevitably restricts regional development and leads to the phenomenon of a “sudden loss” of the support from the relevant interest groups. Therefore, it is important to understand spatio-temporal variations in the carbon budget in the four types of MFZs to clarify the role and function of each in the carbon budget.
Second, carbon compensation zoning has the characteristics of regional comprehensiveness, and is influenced by such factors as the degrees of socio-economic and spatial development in the region. The prevalent zoning is based on the rate of carbon compensation (carbon absorption/carbon emission) (Zhao et al., 2016b), and the research perspective used is relatively simple. This makes it difficult to reflect the comprehensiveness of zoning. We draw lessons from past research (Li et al., 2019) to construct a four-dimensional (4D) framework of zoning for carbon compensation consisting of an overall scale, the social economy, ecological environment, and spatial structure (Figure 2). The total carbon emissions reflect the scale of regional carbon emissions. On the one hand, different stages of industrialization and urbanization lead to differences in the scale of carbon emissions. On the other hand, differences in the recognition and acceptance of low-carbon development in each zone of carbon compensation are eventually reflected in changes in the scale of carbon emissions. Owing to their different positions, the mode and objectives of development of different MFZs vary in the contributions that their carbon emission make to the economy. At the same time, the negative effects of carbon emissions during economic development form an important component of inter-regional carbon responsibility. The ecological environment is mainly manifested in the function of the carbon sink, which plays an important role in maintaining ecological balance. The protection of resources for the carbon sink incurs high cost or requires abandoning opportunities for regional development, which is bound to affect the fairness of spatial regional development. The carbon absorption function of the ecological environment should be fully considered in carbon compensation zoning. The degree of development of land is an important index to judge the potential of regional spatial development. Different degrees of utilization of the land space inevitably lead to differences in the combination of the land for the carbon source and sink, which in turn directly affects the scale of the regional carbon budget. Therefore, the structure of the land space is also a basic factor influencing the scheme of zoning for carbon compensation.
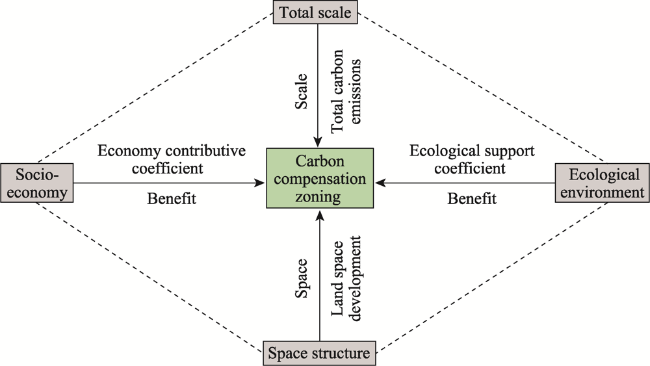
Figure 2 Four-dimensional framework of carbon compensation zoning
Third, the core idea of carbon compensation zoning is to realize the coordination of interests between carbon emitters and carbon sinks, with the aim of achieving regional carbon equity and collaborative emissions reduction. In terms of a scientific division of the scheme, the research area was divided into three types—a payment area, a balanced area, and an obtaining area—according to the theoretical framework of carbon compensation zoning (Li et al., 2019). A payment area is an area that needs to compensate for emissions and pay other areas by economic or non-economic means. A balanced area is one that does not require paying or obtaining a compensation for carbon emissions. An obtaining area is an area that obtains economic or non-economic compensation for emissions. The different functions of social development among the MFZs inevitably lead to carbon compensation to achieve an overall balance. A scientific and reasonable mechanism of carbon compensation is a powerful means of realizing regional and collaborative reduction in carbon emissions. The delineation of zones for carbon compensation based on the perspective of the MFZ can provide directional guidance for determining the horizontal relationship of carbon compensation and its direction of flow, and can help generate enthusiasm for eco-environmental protection.

2.2 Carbon budget concentration index

We used county-level data on the carbon budget in the BTHUA to construct an index to describe the degree of its concentration by using the Lorentz curve (Chai et al., 2016). All county-level units were first arranged in descending order of the carbon budget and their cumulative percentages were calculated. The county code was then taken as the abscissa (X) and the cumulative percentage as the ordinate (Y). We connected points of the cumulative percentage of carbon budget to form a line. This curve was the Lorentz curve (Figure 3).
Figure 3 Lorentz curve of the carbon budget
When the carbon budget was evenly distributed among all county- level units, the curve of the distribution was the diagonal R, a 45° line connecting the cumulative percentage of the carbon budget. This represented the absolute uniformity of the carbon budget. When the carbon budget was concentrated in a given county-level unit, the curve of the distribution was a straight line C located at 100%, and parallel to the X-axis of the cumulative percentage of the carbon budget. This represented the absolute concentration of the carbon budget. The actual curve of the distribution of the carbon budget was D. The more convex the curve was, the more concentrated the carbon budget was in some counties. Assuming that the area between the curves of the actual and the uniform distributions is A, the area between the curves of the concentrated and uniform distributions is M, and that between curves of the actual distribution and the OY-axis is B, the index of concentration of the carbon budget as calculated by the Lorentz curve can be expressed as:
$CEI=\frac{(A-R)}{(M-R)}\times 100%$
where CEI is the concentration index of the carbon budget, with a range of values of 0-1. The smaller CEI is, the more uniform is the distribution of the carbon budget, and vice versa. When CEI is zero, this means that the distribution of the carbon budget is absolutely uniform. When CEI is one, it means that its distribution is absolutely concentrated. In general, 0.4 is used as the “warning line” of the gap in the carbon budget; CEI<0.2 means a “highly average or absolutely average” distribution of the carbon budget, 0.2≤CEI<0.3 means a “relatively average” distribution, 0.3≤CEI<0.4 means a “reasonable” distribution, 0.4≤CEI<0.5 means a “large gap” in the distribution, and CEI≥0.5 indicates that the distribution of the carbon budget is “highly uneven.”

2.3 Normalized revealed comparative advantage index of the regional index

We used the four-dimensional framework of zoning for carbon compensation to choose the total amount of carbon emissions as the index reflecting the scale of total carbon compensation. Based on related research (Lu et al., 2012), the economic contribution coefficient (ECC) and ecological support coefficient (ESC) of carbon emissions are selected to express socio- economic and eco-environmental attributes, respectively, to reflect the social and economic benefits as well as the eco-environmental benefits of regional carbon compensation. The degree of development of the land space (the ratio of area of land for construction to the total area of land) is selected as an index to characterize the spatial structure of carbon compensation (Zhou et al., 2020). ECC and ESC are given as follows:
$ECC={\frac{Gi}{G}}/{\frac{Ci}{C}}\;$; $ESC={\frac{GAi}{GA}}/{\frac{Ci}{C}}\;$
where Gi and G are the GDPs of each county-level unit and the entire region, respectively, Ci and C are the carbon emissions of each county-level unit and the entire region, respectively, and CAi and CA are the carbon sequestrations of each county-level unit and the entire region, respectively.
The normalized revealed comparative advantage (NRCA) index is used to measure the competitiveness of products. It was developed by Yu et al. (2009) as an improvement over the revealed comparative advantage index by Balassa (1965). In this paper, the dominant attribute of carbon compensation zoning in the BTHUA was identified by this method. It can be expressed as:
$NRCA_{j}^{i}={X_{j}^{i}}/{X-{{{X}_{j}}{{X}^{i}}}/{XX}\;}\;$
where $X_{j}^{i}$ represents the index value of attribute j in county i, Xj represents the total index value of attribute j in all counties, Xi represents the total index value of all attributes in county i, and X represents the total index value of all counties and attributes. If NRCA>0, it means that the given county has a comparative advantage in this attribute. Otherwise, it means that the county has no comparative advantage in this attribute.

2.4 Classification of carbon compensation zoning

Based on the NRCA index of zoning for carbon compensation, the Self Organizing Mapping-K-means (SOM-K-means) model was selected to divide the zones of carbon compensation of the BTHUA. The self-organizing mapping network is a neural network that can solve the problem of unsupervised classification through self-organization (Kohonen, 1982). The K-means clustering algorithm is a clustering analysis algorithm that takes the square sum criterion of the error function to classify and organize data samples with similar characteristics. The SOM-K-means clustering model integrates the self-organization, adaptability, and fault tolerance of the SOM into the advantages of K-means, such as high efficiency, good interpretability, and fast convergence, to cluster the data samples in two stages (Zhou et al., 2010). In the first stage, the SOM is used to cluster the data samples, and the number of categories and the center points of each category are obtained. In the second stage, the results of clustering of the first stage are taken as input values and the final results are obtained by using the K-means clustering algorithm. The algorithm for the SOM-K-means clustering model has been provided in past work (Zhou et al., 2010).

2.5 Study area and data sources

We selected Beijing, Tianjin, and Hebei as the study area. Considering adjustments to the administrative division and the availability of data, six districts with the same major functions as Beijing—Dongcheng, Xicheng, Haidian, Chaoyang, Fengtai, and Shijingshan districts—were merged into one research unit. The districts in Tianjin, including Heping, Hexi, Hedong, Nankai, Hebei, and Hongqiao were merged into one research unit, and the central urban areas of various prefecture-level cities in Hebei Province were merged accordingly. A total of 157 county-level units were obtained after the merger.
The data on carbon emission and carbon sequestration used here were from Scientific Data (Chen et al., 2020). The data on carbon emissions and carbon sequestration for the Weichang Manchu-Mongolian Autonomous County were missing, and were supplemented by the average values of adjacent counties. The other socio-economic data were from the Beijing Statistical Yearbook (2001-2018), Tianjin Statistical Yearbook (2001-2018), Hebei Economic Yearbook (2001-2018), China County Statistical Yearbook (2001-2018), China Urban Construction Statistical Yearbook in 2017, and official data and statistical bulletins issued by the relevant institutions. Four types of MFZs (optimized development zone, prioritized development zone, main agricultural production zone, and key ecological function zone) were derived from the National MFZ Planning and provincial MFZ Planning for Beijing, Tianjin, and Hebei Provinces. The following should be noted: (1) “Carbon” in this paper refers to CO2. The research focuses on carbon emission and absorption within the chosen region, and does not consider the embodied carbon budget. (2) The area of land for construction in each district in Beijing was missing for 2017, and data from 2016 were used to compensate for this. The data were from the national spatial planning of each district in Beijing (2017-2035).

3 Spatio-temporal variations in carbon budget in Beijing-Tianjin-Hebei urban agglomeration

We used 50%, 100%, and 150% of the average carbon emissions and carbon absorption in the BTHUA from 2000 to 2017 as points of division to cleave carbon emissions and absorption into four levels: low, lower, higher, and high. The spatial distributions of carbon emissions and absorption in 2000, 2010, and 2017 were then visualized based on ArcGIS10.2 (Figures 4 and 7), and a chart of changes of the concentration index of the carbon budget in the BTHUA from 2000 to 2017 was drawn (Figure 6). The carbon budgets in the optimized development zone, prioritized development zone, main agricultural production zone, and key ecological function zone were decomposed, and the concentration index in them were calculated (Figures 5 and 8).
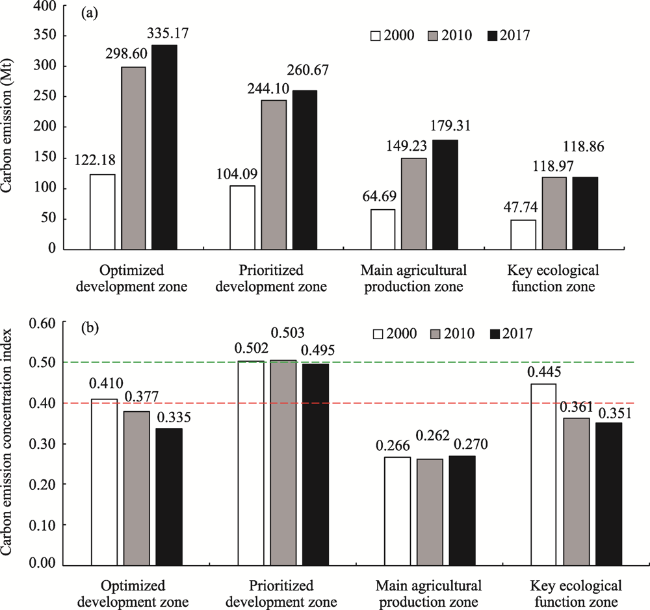
Figure 6 Concentration index of carbon budget in the Beijing-Tianjin-Hebei urban agglomeration from 2000 to 2017

3.1 Spatio-temporal variations in carbon emission in Beijing-Tianjin-Hebei urban agglomeration

Since 2000, carbon emissions in the BTHUA have steadily increased from 338.7 million tons to 920.4 million tons in 2012 and then fluctuated downward to 894 million tons in 2017. Especially after 2014, the downward trend was prominent, indicating that the coordinated development of Beijing-Tianjin-Hebei played an important role in alleviating carbon emissions in the BTHUA.
At the county level, the carbon emissions presented a “core-periphery” structure, with Beijing-Tianjin-Tangshan as the high-value center and gradually decreasing outward (Figure 4). In 2000, the areas with high carbon emissions included the Beijing urban area, Tongzhou District, Tianjin Binhai New Area, Shijiazhuang, Tangshan, Baoding, Zhangjiakou Municipal District, Handan, and Qinhuangdao. The higher-value areas included the Tianjin urban area, Wu’an, Wuqing, Xiqing, Dongli, Jinghai, and Shunyi. There were 16 high-value and higher-value areas of carbon emission in total. Areas of both kinds were production and consumption centers, with concentrated populations and developed economies, accounting for 39.99% of all carbon emissions. The other 141 counties were low-value and lower-value areas of carbon emission that were mainly distributed in the vast northern, western, and southern counties, and accounted for 60.01% of total carbon emissions. Compared with 2000, in 2010, the number of areas with low carbon emissions decreased, while the number of areas with high, higher and lower carbon emissions increased significantly. The number of high-value and higher-value areas increased to 51, and their ratio of carbon emissions increased to 69.09%. The number of lower-value areas increased from 25 to 55, and the number of low-value areas decreased from 116 to 51. The ratio of carbon emissions of these two types of areas decreased to 30.91%. By 2017, the number of area with high carbon emissions had risen to 39. They were distributed in the eastern Tianjin Tangshan coastal area, Shijiazhuang and Handan Municipal Districts in the south, Beijing and some districts in Langfang in the middle, and Baoding Municipal District and Zhangjiakou Municipal District in the northwest. The higher-value areas were mainly distributed around the high-value areas, including in 24 county units, such as Chengde, Cangzhou Municipal District, Changping, Gaobeidian, and Ningjin. The other 94 counties in the north, west, and south were mostly low- and lower-value areas, accounting for 25.47% of all carbon emissions and carrying less than 30% of the carbon emissions in the BTHUA.
Figure 4 Spatial distribution of carbon emissions in Beijing-Tianjin-Hebei urban agglomeration
Carbon emissions in various functional zones were consistent with the strategic positioning of the MFZs. Two types of urbanized zones, namely, the optimized development zone and the prioritized development zone, were the main pressure zones for carbon emissions in the BTHUA, and took on heavy responsibilities in terms of population absorption, economic development, and industrial agglomeration. Their carbon emissions were significantly higher than those of the main agricultural production zone and the key ecological function zone (Figure 5). Except in 2010 and 2017, when emissions in the key ecological function zone were basically the same, carbon emissions in the other three functional zones increased significantly. The upward trend in the optimized development zone was the most significant. However, the rising trend of carbon emission in the MFZs from 2010 to 2017 was significantly more moderate than that from 2000 to 2010, which indicates that the coordinated development of Beijing-Tianjin-Hebei had promoted the coordinated governance of the ecological environment and reduced the rate of growth in carbon emission in the BTHUA.
Figure 5 Carbon emissions and centralization index of different major functional zones
The concentration index shows that the index of concentration of carbon emissions in the BTHUA fluctuated from 0.510 in 2000 to 0.483 in 2017 (Figure 6), both of which were higher than the “warning line” of 0.4. From 2000 to 2006, the index of concentration of carbon emissions was higher than 0.5, leading to a highly uneven situation. After 2006, it was between 0.4 and 0.5, indicating that although regional differences in carbon emission in the BTHUA were decreasing, the overall difference was still large. The index of concentration of carbon emissions of each MFZ was different (Figure 5). The index of concentration of the prioritized development zone was the highest, hovering around 0.5 in 2000, 2010, and 2017, and its carbon emissions were highly uneven. In 2000, the index of concentration of carbon emissions in the key ecological functional zone and the optimized development zone exceeded the “warning line” of 0.4. The gap in carbon emissions was large but fell below 0.4 in 2010 and 2017, when emissions tended to be balanced. The index of concentration of carbon emissions in main agricultural production zone was stable at about 0.27, reflecting a relatively uniform situation.

3.2 Spatio-temporal variations in carbon absorption in Beijing-Tianjin-Hebei urban agglomeration

Carbon absorption in the BTHUA increased from 191.6 million tons in 2000 to 289.8 million tons in 2017, a growth rate of 51.25% compared with 2000. In particular after the coordinated development strategy for Beijing-Tianjin-Hebei was put forward in 2014, the ecological environment improved significantly, and the rising trend of carbon absorption was particularly prominent, reaching 312.8 million tons in 2016. This was the highest value in the research period.
At the county level, the spatial distribution of carbon absorption was relatively stable, and had an inverted “U-shaped” pattern that was high in the east, north, and west, and low in the middle and south (Figure 7). In 2000, there were 21 county-level units in the area of high carbon absorption, including the three municipal districts of Tangshan, Qinhuangdao, and Zhangjiakou as well as Fengning, Weichang, and Longhua. The areas with higher values were mainly distributed along the periphery of the high-value areas, including 16 county-level units, such as Shijiazhuang, Xingtai, Leting, Xinglong, Luannan, Changli, and Xingtai. The higher- and high-value counties had a good ecological environment and a strong ecological service function, and are important areas for ensuring the ecological security of the BTHUA. Less than 25% of the counties carried 61.08% of the carbon sequestration of the BTHUA. The other 120 counties were low- and lower-value areas of carbon absorption that were mainly distributed in the central and southern counties, Zhangjiakou Municipal District, and some counties in Zhangjiakou, Tangshan, and Qinhuangdao in the north. They accounted for less than 40% of carbon absorption. In 2010, the number of high-value areas of carbon absorption increased to 30 while the number of higher-value areas remained constant at 16. The ratio of carbon sequestration carried by these two types of areas increased to 67.58%. The number of lower-value areas increased from 28 to 42 and that of low-value areas decreased from 92 to 69. Their ratio of carbon sequestration decreased to 32.42%. Compared with 2010, the pattern of spatial distribution of carbon absorption in 2017 changed by little. There were 35 county-level units in the area of high carbon absorption, including the coastal areas of Tianjin, Tangshan, Qinhuangdao, and Cangzhou in the east, most counties of Chengde and Zhangjiakou in the north, Yanqing, Miyun, Huairou, and Fangshan in Beijing, and counties to the northwest of Baoding and Pingshan Counties in Shijiazhuang. Higher-value areas mainly included 15 counties, such as Qianxi, Zunhua, Yangquan, Xingtai, and Shexian. The other 107 counties in central and southern counties in the north, and some counties in Tangshan and Qinhuangdao were mostly low- and lower-value areas. Their ratio of carbon absorption decreased to 28.28%.
Figure 7 Spatial distribution of carbon absorption in the Beijing-Tianjin-Hebei urban agglomeration
Carbon absorption in various MFZs was consistent with their strategic positioning. Carbon absorption in the four MFZs exhibited a significant upward trend, especially in the key ecological functional zone. The order of carbon absorption of the MFZs was key ecological functional zone > main agricultural production zone > optimized development zone > prioritized development zone (Figure 8). The key ecological functional zone undertook the important tasks of regulating the regional climate, conserving water sources, preventing wind and fixing sand, and maintaining the natural “green heart.” The main agricultural production zone had a wide planting area for grains and vegetables, and a large amount of forested land. However, the optimized development zone and the prioritized development zone underwent a high degree of development of the land space. This led to the occupation of green ecological space for industry and urbanization, resulting in lower carbon absorption.
Figure 8 Carbon absorption and centralization index of the major functional zones
The index of concentration of carbon absorption in the BTHUA shows that except in 2000, 2001, and 2004, its value in the other years was significantly higher than that of concentration of carbon emissions, indicating that the uneven state of carbon absorption was significantly stronger than that of carbon emissions. The concentration index of carbon absorption in the BTHUA fluctuated greatly, from 0.508 in 2000 to 0.525 in 2017 (Figure 6), indicating that its distribution tended to be concentrated. Except in 2004, when the index of concentration of carbon absorption was between 0.4 and 0.5, it exceeded 0.5 in the other years and was in a highly uneven state. The difference in the index of concentration of carbon absorption between the functional zones was smaller than that of concentration of their carbon emissions (Figure 8). The index of concentration in the optimized development zone was the highest, although it decreased from 0.473 to 0.439, and the gap in carbon absorption remained large. The index of concentration of carbon absorption in the main agricultural production zone and the prioritized development zone was between 0.4 and 0.5, but the upward trend was clear and the gap in carbon absorption was large. The index of concentration of carbon absorption in the key ecological functional zone was close to the 0.4 “warning line,” and the relative gap in carbon absorption was gradually increasing.

4 Carbon compensation zoning and optimization scheme for Beijing- Tianjin-Hebei urban agglomeration

4.1 NRCA index of each attribute in carbon compensation zoning

Based on the four attributes of total scale, social economy, ecological environment, and spatial structure, the index of the comparative advantage of each attribute in the BTHUA was calculated by using the NRCA index and the spatial distribution of each was drawn (Figure 9).
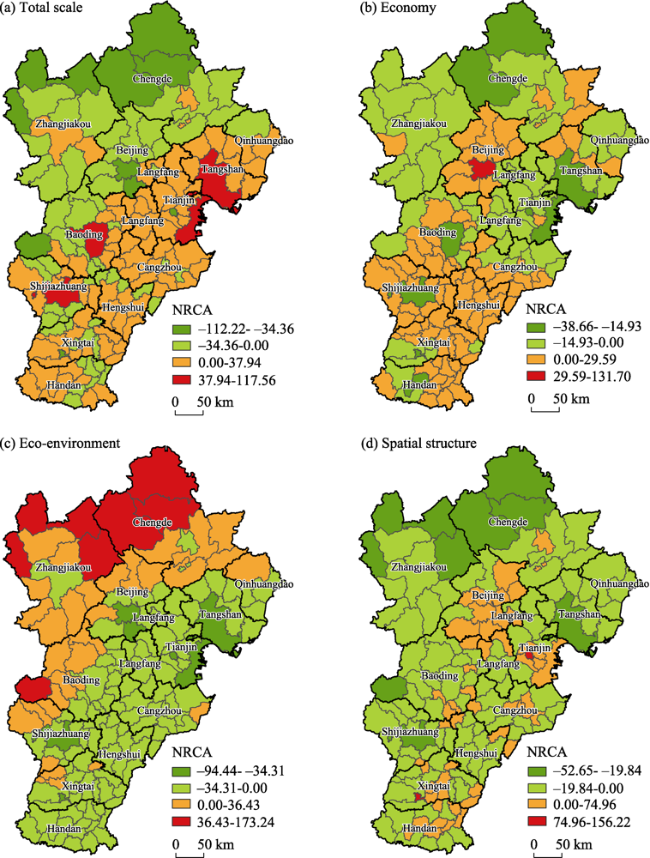
Figure 9 Spatial distributions of NRCA index of factors influencing carbon compensation in the Beijing-Tianjin-Hebei urban agglomeration
(1) Most of the advantageous areas in terms of total scale were located in the optimized development zone and prioritized development zone, indicating that these two MFZs had a large scale of carbon emission. It is thus important to adequately conserve energy and reduce emissions through industrial transformation and upgrade while avoiding a blind expansion in construction and improving the efficiency of energy utilization. (2) The advantageous areas in terms of the economic attributes of carbon compensation were mainly distributed in the northeastern, central, and southern areas of the BTHUA, mostly in the main agricultural production zone and key ecological function zone. The economic contribution of these areas to carbon emissions was relatively high, while some optimized development zones and prioritized development zones, such as the Tianjin urban area, Tangshan urban area, Binhai New Area, Shijiazhuang urban area, and Qinhuangdao urban area, were inferior areas of economic carbon compensation. This indicates that these areas had poor efficiency of economic output in terms of energy, weak capacity for economic contribution due to carbon emissions, and there may be the problem of extensive economic development mode. (3) Most of the advantageous areas of carbon compensation in terms of the eco-environmental attribute were distributed in the Bashang Plateau Mountainous area in the north of the BTHUA, Yanshan Mountain area in the north of Hebei Province, and Taihang Mountain area in the west of Hebei Province. These areas were rich in forest resources, which are important ecological security barriers of the BTHUA and play an important ecological role in water conservation, wind prevention, sand fixation, and climate regulation. Carbon compensation has prominent advantages in terms of the eco-environmental attribute. (4) The superior areas of carbon compensation spatial structure were mainly distributed in Beijing, Tianjin, and a few counties to the east and south, whereas the inferior areas dominated the spatial structure of the BTHUA. Among them, the results for Tangshan and Shijiazhuang urban areas need to be explained because the scale of total carbon compensation in these two areas had prominent advantages. The advantages of the other attributes were relatively weak.

4.2 Carbon compensation zoning and spatial optimization scheme

The SOM-K-means clustering model was used to cluster the indices of comparative advantage of the four attributes. The BTHUA was divided into 53 payment areas, 64 balanced areas, and 40 obtaining areas. Carbon compensation zoning and the MFZs were then superimposed, and finally the zones of carbon compensation from the perspective of the MFZ were reconstructed into nine types (Figure 10 and Table 1).
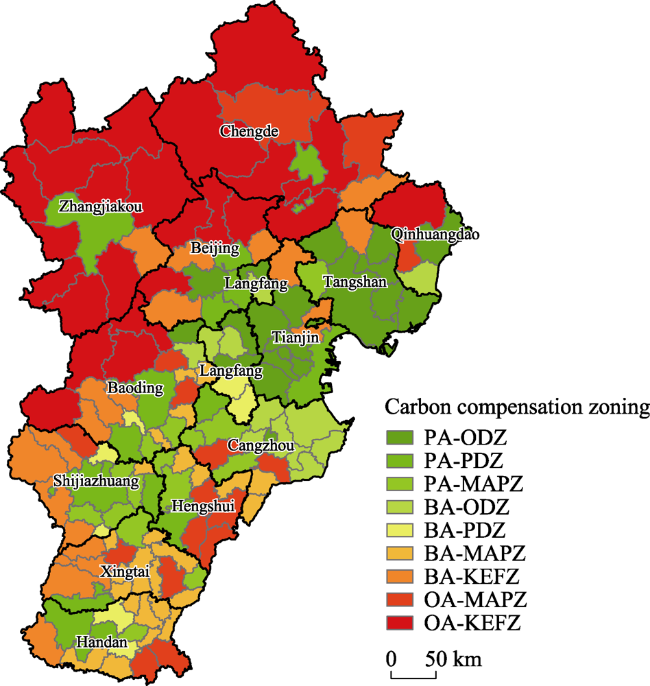
Figure 10 Spatial zoning for carbon compensation according to the major functional zones

Note: PA-ODZ is the Payment Area-Optimized Development Zone; PA-PDZ is the Payment Area-Prioritized Development Zone; PA-MAPZ is the Payment Area-Main Agricultural Production Zone; BA-ODZ is the Balanced Area-Optimized Development Zone; BA-PDZ is the Balanced Area-Prioritized Development Zone; BA-MAPZ is the Balanced Area-Main Agricultural Production Zone; BA-KEFZ is the Balanced Area-Key Ecological Functional Zone; OA-MAPZ is the Obtaining Area-Main Agricultural Production Zone; OA-KEFZ is the Obtaining Area-Key Ecological Functional Zone

Table 1 Main indicators of carbon compensation zoning in Beijing-Tianjin-Hebei urban agglomeration
Carbon compensation spatial zoning Proportion of land area (%) Proportion of GDP (%) Proportion of carbon emission (%) ECC ESC Land development degree (%)
PA-ODZ (21) 11.030 54.631 29.755 1.836 0.386 9.358
PA-PDZ (17) 11.698 20.843 26.140 0.797 0.357 9.122
PA-MAPZ (15) 5.291 4.168 6.839 0.609 0.539 2.189
BA-ODZ (12) 4.992 3.060 7.735 0.396 0.593 3.617
BA-PDZ (7) 2.026 1.559 3.017 0.517 0.487 2.095
BA-MAPZ (26) 6.038 2.925 7.199 0.406 0.628 2.508
BA-KEFZ (19) 12.474 6.439 8.392 0.767 1.392 3.432
OA-MAPZ (16) 10.040 2.847 6.019 0.473 1.700 1.068
OA-KEFZ (24) 36.411 3.528 4.903 0.720 8.771 0.774

4.2.1 Payment area

The payment areas were mainly located in the eastern, central and, southern areas of the BTHUA, and included optimized development zone, prioritized development zone, and major agricultural production areas. The area accounted for 28.02% of the BTHUA, and had a high level of economic development accounting for nearly 80% of the GDP and 62.73% of total carbon emissions. There was a serious mismatch between their capacity for economic contribution through carbon emissions and their ecological carrying capacity (the ECC for carbon emissions was 1.270 while the ESC was only 0.391).
(1) The Payment Area-Optimized Development Zone was composed of 21 county-level units, including urban areas of Beijing and Tianjin, and municipal districts of Tangshan, Qinhuangdao, Langfang, and Cangzhou. It was an area of high-intensity urbanization and industrialization, with rapid economic development and high economic benefits of carbon emissions (the intensity of development of land space was 9.358%, the ratio of the GDP was 54.631%, and the ECC of carbon emission was 1.836). However, there was significant pressure on resources and the environment in the area. The total carbon emissions accounted for 29.755% of the total and the ESC of carbon emissions was only 0.386. In future development, the urban areas of Beijing and Tianjin should implement stricter carbon emission standards and environmental standards for industrial access, control the total amount of carbon emissions, improve the carbon emission trading system, build a clean, low-carbon, safe, and efficient energy system, and address the contradiction involving resources. They should promote the transformation of the industrial structure to become more efficient, with a higher added value, and enhance its capacity to contribute to the economy through carbon emissions. It is important to protect zones forbidden for development, such as the Summer Palace and Xishan National Forest Park, strengthen the construction of urban forests, green spaces, and landscape rivers, and improve the carbon absorption capacity. Langfang, around the capital, should develop a green and low-carbon economy, build an ecological and modern industrial system, focus on the greening of towns and trunk lines for transportation, improve the construction of urban forest parks, green channels, and farmland protection systems, expand green ecological space, build a green economic circle around the capital, and enhance its capacities to contribute to the economy through emissions as well as its ecological carrying capacity. The coastal areas of Tangshan and Qinhuangdao should explore ways to develop the marine economy and promote the development of the marine industry to improve their capacity to contribute to the economy through carbon emissions. At the same time, important ecological resources, such as islands, coastal wetlands, estuaries, coastal trunk forest belts, and coastal tidal flats, should be protected.
(2) The Payment Area-Prioritized Development Zone included 17 county-level units, namely, Tongzhou, Binhai New Area, municipal districts of Shijiazhuang, Baoding, Xingtai, Handan, Chengde, and Hengshui. The intensity of development of its land space was 9.122% and its economic development was adequate, as was its contribution due to carbon emissions (accounting for 20.843% of the total GDP; the ECC of carbon emission was 0.797). However, its resources and environment were under great pressure (the total carbon emissions accounted for 26.140% of the total, and the ESC of carbon emission was only 0.357). Tongzhou and Binhai New Area, as important poles for the economic growth of Beijing-Tianjin-Hebei, should optimize their spatial structure of land, moderately control the expansion of the urban spatial scale, fully tap the potential of various types of land use, improve the efficiency of spatial utilization of land, energy, and output of economic benefits, reduce energy consumption, and promote the transformation and upgrade of the mode of economic development. The municipal districts of Shijiazhuang, Baoding, Xingtai, and Handan, located in piedmont plains of Taihang Mountains, are important traditional clusters of the heavy industry in China. These areas should change their mode of economic development, cultivate new drivers of economic development, promote low-carbon development through industrial transformation and upgrade, adjust the energy structure, attempt for total control of coal consumption, improve the efficiency of energy utilization, promote the prevention and control of industrial and urban pollution, and expand green ecological space. The municipal districts of Hengshui should make plans for surrounding areas to build lakeside tourist cities, develop eco-tourism, expand the area occupied by gardens and green spaces, and strengthen control of space pollution to improve the ecological carrying capacity of the area for carbon emissions.
(3) The Payment Area-Main Agricultural Production Zone included 15 county-level units: Wuji, Yuanshi, Zhaoxian, Jinzhou, Yutian, Feixiang, Ningjin, Qinghe, Lixian, Anguo, Suning, Botou, Hejian, Anping, and Shenzhou. These areas are an important base for high-quality agricultural products, with good conditions and the foundations for agricultural development, but have been highly disturbed by human activities. Compared with other major areas of agricultural production, this area had a higher economic contribution through carbon emissions and a lower ecological carrying capacity (the ECC of carbon emission was 0.609 and the ESC was 0.539). In the future, this area should control the scale of cities and towns, avoid ecological degradation caused by over-exploitation through industrialization and urbanization, limit agricultural development that is detrimental to natural ecosystems, and pay attention to ecological protection and food security. Strict management of construction land and environmental quality control are needed to strengthen the protection of cultivated land and ensure that the area of basic farmland is not reduced while its quality is improved. At the same time, it is necessary to establish a modern agricultural and industrial system, implement policies to strengthen agriculture to benefit farmers, and improve the comprehensive capacity for agricultural production. This will help expand the space for rural employment and increase income, improve the enthusiasm of farmers for production, and enhance the efficiency, energy conservation, and potential for emissions reduction of agricultural production.

4.2.2 Balanced area

The balanced area accounted for 25.53% of all land, and included the optimized development zone, prioritized development zone, main agricultural product production zone, and key ecological function zone. The ratio of GDP of this area was relatively low, accounting for 13.98%, and that of carbon emission was 26.34%. Its economic contribution through carbon emissions and the ecological function of the carbon sink matched (the ECC of carbon emissions was 0.531 and the ESC was 0.845).
(1) The Balanced Area-Optimized Development Zone was composed of 12 county-level units: Changli, Gaobeidian, Cangxian, Qingxian, Haixing, Yanshan, Mengcun, Huanghua, Gu’an, Yongqing, Xianghe, and Dachang. They were mainly located in the Bohai Rim region and Yanshan piedmont plain. Compared with the Payment Area-Optimized Development Zone, the carbon emissions and economic contribution through carbon emissions of this region were low (the total carbon emission accounted for 7.736% and the ECC of carbon emission was 0.396). Its economic development was average (accounting for 3.060% of the total GDP), and its ecological function was strong (the ESC of carbon was 0.593). As the bearing places of Beijing-Tianjin-Hebei urban function expansion and industrial transfer, these areas should optimize urban functional zoning, strengthen urban comprehensive service functions and actively build new industrial clusters. At the same time, it is necessary to promote the construction of eco-cities, increase ecological spaces such as urban gardens, public green spaces, constructed wetlands, and shelterbelts, build an ecological network mainly consisting of water-conserving forests and grass belts in the Yanshan Mountain area and coastal shelterbelts, and maintain and enhance the carbon sink function of the ecosystem.
(2) The Balanced Area-Prioritized Development Zone contained seven county-level units: Gaoyi, Xinle, Cheng’an, Yongnian, Wangdu, Dacheng, and Wen’an. They were mainly located in central and southern Hebei, and the Zhangcheng basin valley. This type of zone had lower carbon emissions than the Payment Area-Prioritized development zone, with total carbon emissions accounting for only 3.017% and the ESC of carbon emissions being 0.487. Its ecological function as carbon sink was relatively strong, its GDP accounted for only 1.559% of the total, the ECC of carbon emissions was 0.517, and economic development and the economic benefits of carbon emissions were poor. In the future, Gaoyi and Wangdu should moderately promote urbanization, take advantage of Shijiazhuang and Baoding to build a modern industrial system, develop green and low-carbon industries, strengthen the protection of existing resources for carbon sink, and build a green ecological city suitable for industry and living. Other county-level units should avoid damaging the ecological environment, pay attention to protecting the regional green space, and maintaining the ecological function of carbon sink resources during urbanization and industrialization.
(3) The Balanced Area-Main Agricultural Production Zone consisted of 26 county-level units, including Shenze, Linzhang, Cixian, Qiu, Jize, and Guangping. The total carbon emissions in this zone accounted for 7.199%, the economic development was poor, the economic contribution capacity through carbon emission was weak (accounting for 2.925% of the total GDP; the ECC of carbon emission was 0.406), and the ecological function of the carbon sink was strong (the ESC of carbon emission was 0.628). As it is the main agricultural production zone, it is necessary to control its intensity of development, optimize the mode of development, control the excessive occupation of agricultural space, such as basic farmland, and improve cultivated land. The relevant authorities should promote the regional distribution and large-scale production of agricultural products, develop circular agriculture and ecological agriculture, and improve the output of land. To maintain low carbon emissions, they need to improve the ecological environment for agriculture, increase the areas of sandy wasteland, saline alkali land, wasteland, and other unused land that are treated, increase the canopy density of vegetation, and improve the ecological carrying capacity for carbon emissions.
(4) The Balanced Area-Key Ecological Functional Zone contained 19 county-level units: Fangshan, Changping, Pinggu, Ninghe, Jizhou, Jingxing, Lingshou, Zanhuang, Pingshan, Qianxi, Shexian, Xingtai, Lincheng, Neiqiu, Tang, Quyang, Shunping, Huailai, and Kuancheng. This zone had a high ratio of carbon emissions (8.392%), ranking third among all types of zones. Its economic development, economic contribution, and ecological carrying capacity for carbon emission were stronger than other balanced areas (accounting for 6.439% of the total GDP; the ECC of carbon emission was 0.767 and the ESC of carbon emissions was 1.392). The region is located in the transitional zone between mountainous and plain areas, and its ecological environment is relatively fragile. It is important to control large-scale and high-intensity industrialization and urbanization in the area, strengthen the restoration and protection of carbon sink resources, and enhance the ecological carrying capacity for regional carbon. The extensive exploitation of coal, iron, limestone, and other resources should be avoided to maintain the ecological environment.

4.2.3 Obtaining area

The obtaining area was mainly located in the Bashang Plateau Mountain area in the north of the urban agglomeration, the Yanshan Mountain area in the north of Hebei Province, and the Taihang Mountain area in the west of Hebei Province. It included the main agricultural production zone and areas with key ecological functions. The land area accounted for 46.45% of the area of urban agglomeration, with a low degree of spatial development of land (0.838%) and poor economic development (6.375% of GDP). The ratios of carbon emissions and economic contribution to carbon emissions were small (the ratio of carbon emissions was 10.922%, and the ECC of carbon emissions was 0.584), while the ecological carrying capacity for carbon emissions was strong (the ESC of carbon emissions was 4.874).
(1) The Obtaining Area-Main Agricultural Production Zone was composed of 16 county-level units: Xingtang, Lulong, Daming, Wei County, Longyao, Wei County, Dingxing, Anxin, Pingquan, Longhua, Nanpi, Xian County, Zaoqiang, Wuyi, Gucheng, and Jing County. It was located in hilly areas at the eastern foot of Taihang Mountain and the northern mountainous area of Hebei Province, with abundant water resources and good conditions for agricultural production. It is an important part of the main agricultural production area in the Huang-Huai-Hai Plain. The degree of development of space for land and the ECC of carbon emission in this area were both low (1.068% and 0.473, respectively), while the ecological function of the carbon sink was strong (the ESC of carbon emission was 1.700). In the future, this zone should reasonably plan the layout of land for agricultural production, control large-scale urbanization and industrialization, and stabilize the total amount of basic farmland. On the premise of not sacrificing the ecological carrying capacity for carbon, it should optimize the industrial structure of agricultural products, enhance the capacity for agricultural production and economic benefits, strengthen the construction of the farmland forest network, steadily improve the rate of forest coverage, and enhance the ecological carrying capacity for carbon emissions.
(2) The Obtaining Area-Key Ecological Functional Zone contained 24 county-level units, including Mentougou, Qinglong, Laishui, Fuping, Guyuan, Kangbao, and Shangyi. They were mainly located in the core area of the mountainous area of the Bashang Plateau, Yanshan Mountain area in northern Hebei, and Taihang Mountain area in western Hebei. This area had the poorest development of space for land (0.774%), with a small ratio of carbon emissions (4.903%). It was rich in carbon sink resources, its ecological service and carrying function were extremely strong (the ESC of carbon emissions was 8.771), and it served as an important support and barrier for the ecological environment of the BTHUA. The mountainous area of the Bashang Plateau is an important area for sandstorm control and a base of production for organic agricultural products. In the future, authorities in this region should strengthen the protection of natural grassland and the construction of artificial grassland, and intensify the construction of ecological projects, such as forest protection zones along the edges of dams, wind sand source control, and degraded grassland control. At the same time, the mountainous area of the Bashang Plateau should also control the area of high water-consuming agriculture, vigorously develop ecological agriculture and water-saving planting, strictly control the impact of economic construction on the ecological environment, and realize the equal emphasis on regional economic development and environmental protection. The Yanshan Mountain area and Taihang Mountain area are important areas for water conservation and ecotourism. It is important to protect their nature reserves, scenic spots, and forest parks, focus on water and soil conservation, afforestation, and farmland water conservancy, and to develop new service industries, such as eco-tourism, rehabilitation and healthcare, and leisure and vacation. At the same time, authorities should develop wind energy, solar energy, geothermal energy, and biomass energy to make full use of clean and low-carbon energies.

5 Conclusions and discussion

5.1 Conclusions

This study constructed a theoretical framework for the carbon budget and carbon compensation from the perspective of the MFZ. We used 157 county-level units in the BTHUA as research area, and examined the spatio-temporal differences in the carbon budget in the entire region and each functional zone, and formulated a four-dimensional framework of zoning for carbon compensation by considering the total scale of the regional carbon budget, socio-economic conditions, ecological environment, and attributes of the spatial structure. Moreover, we used the NRCA index and SOM-K-means clustering to divide the zones of carbon compensation, and devised a spatially optimized scheme for carbon compensation based on MFZ planning. The conclusions are as follows:
(1) Since 2000, the carbon budget in the BTHUA has been fluctuating and rising, and temporal and spatial difference in the carbon budget have been prominent. Carbon emissions exhibited a “core-periphery” structure, with Beijing, Tianjin, and Tangshan as the high-value center, and gradually decreased outward. The number of high-value areas and higher-value areas of carbon emission increased from 16 to 63 in the period studied, and the proportion of carbon emissions increased from 39.99% to 74.53%. The pattern of spatial distribution of carbon absorption was relatively stable, with an inverted “U-shaped” pattern that was high in the east, north and west, and low in the middle and south. The number of high-value areas and higher-value areas of carbon absorption increased from 37 to 50, and the proportion of carbon absorption increased from 61.08% to 71.72%. The index of concentration of the carbon budget of the BTHUA from 2000 to 2017 was higher than the “warning line” of 0.4. However, the uneven state of carbon absorption was significantly stronger than that of carbon emission, which was in a highly uneven state.
(2) The carbon budget in various MFZs showed an upward trend, which was in line with the strategic positioning of the MFZ. That is, the optimized development zone and prioritized development zone were the main pressure areas for carbon emission in the BTHUA, while the key ecological function zone was the dominant area of carbon absorption. The index of concentration of carbon emissions of each functional zone was different. The carbon emission of the prioritized development zone was always highly uneven, and those of the key ecological functional zone and optimized development zone were relatively large, but evolve to a balanced state. The carbon emission of the main agricultural areas was always in a relatively uniform state. The difference of carbon absorption concentration index in each functional zone was smaller than that of carbon emission concentration index, the carbon absorption gap in optimized development zones was weakening gradually, the carbon absorption gap in major agricultural production area and key development zone was obvious, and the carbon absorption concentration of key ecological functional zones was close to 0.4, the relative gap of carbon absorption was gradually increasing.
(3) The SOM-K-means clustering partition model was established according to the NRCA index of each attribute to divide the BTHUA into 53 payment areas, 64 balanced areas, and 40 obtaining areas. We combined the MFZ with carbon compensation zoning to reconstruct zoning for the BTHUA into nine types. The scheme was further refined to develop a scheme for the differentiated spatial optimization of carbon compensation in the functional zones.

5.2 Discussion

This study explored the characteristics of temporal and spatial differences in the carbon budget in the BTHUA from the perspective of the MFZ, and proposed a scheme for the spatial optimization of differential carbon compensation in these areas. This research is in line with China’s aim for the construction of an ecological civilization, which focuses on carbon reduction in the 14th Five-Year Plan period. This is important for promoting the coordinated governance of the ecological environment of the Beijing-Tianjin-Hebei region. The following issues need to be further studied:
(1) The differences in the regional carbon budget and carbon compensation are highly sensitive to changes in the spatial scale, and the trends of evolution and mechanisms of the carbon budget and carbon compensation are different at different spatial scales. In general, the larger the spatial scales of the carbon budget and carbon compensation are, the more complex are the natural and socio-economic conditions within the region, and the more distorted are the results of research on the carbon budget and carbon compensation. This is not conducive to the construction of targeted carbon compensation schemes (Zhao et al., 2016b). Therefore, research on the carbon budget and horizontal carbon compensation at a more refined scale is needed, such as at the level of the township or the village.
(2) Carbon compensation is essentially an ecological compensation linked by “carbon”, with the aim of achieving equitable development and coordinated carbon emissions reduction among various regions. However, the fairness and synergy of carbon emission reduction among regions are affected by many factors, such as the per capita carbon emission, economic development, industrial structure, and poverty. Given the available data, this paper considered only such factors as scale, benefit, and space to build the theoretical framework for carbon compensation. In the future, it is necessary to comprehensively consider the natural and socio-economic conditions in the region, and improve the theoretical framework for regional carbon compensation because it has important theoretical value for constructing an objective scheme for regional carbon compensation.
(3) As an exploratory study, this paper divided the study area into zones based only on the types of carbon compensation, and did not calculate the standards of value for carbon compensation in each type of area. The reference value of carbon compensation should be determined in future work in combination with regional resource endowment, intensity of carbon emission, economic development, industrial status, and the price of carbon, and the value of compensation for carbon should be calculated to promote the coordinated development of regional low-carbon use. Carbon emissions trading is an important means of guiding the optimal allocation of rights for carbon emissions through the market, and to reduce emissions while ensuring high-quality economic development. Moreover, it is important to integrate regional carbon compensation into the enterprise carbon trading market, establish and improve a cross-regional carbon compensation system and a system of quotas for carbon emissions, explore diversified paths to achieve the goal of carbon neutrality, and realize fair inter-regional development and coordinated carbon emissions reduction. Current research on the carbon budget and carbon compensation has focused on carbon emissions in terminal consumption in the region, and not enough attention has been paid to the embodied inter-regional carbon budget and compensation zoning. Future work should seek to fill this gap in research.
[1]
Allen M R, Frame D J, Huntingford C et al., 2009. Warming caused by cumulative carbon emissions towards the trillionth tonne. Nature, 458(7242): 1163-1166.

DOI

[2]
Balassa B L, 1965. Trade liberalisation and “revealed” comparative advantage. Manchester School, 33(2): 99-123.

DOI

[3]
Chai L H, Zhu H Y, 2016. Evolution trend of regional centralization of grain production in China. Journal of Natural Resources, 31(6): 908-919. (in Chinese)

[4]
Chen J D, Gao M, Cheng S L et al., 2020. County-level CO2 emissions and sequestration in China during 1997-2017. Scientific Data, 7(1). doi: 10.1038/s41597-020-00736-3.

DOI

[5]
China Environmental Culture Promotion Association (CECPA), 2008. The First Report of “Research on China Carbon Balance Trading Framework” issued in Beijing [2008-11-06]. http://www.zhb.gov.cn/zhxx/hjyw/200811/t20081106_130915.htm. (in Chinese)

[6]
Ding Y L, 2015. Net carbon emissions estimates and carbon offsets in rural tourism destinations from a carbon neutral perspective[D]. Nanjing: Nanjing Normal University. (in Chinese)

[7]
Fan J, 2007. The scientific foundation of major function oriented zoning in China. Acta Geographica Sinica, 62(4): 339-350. (in Chinese)

[8]
Fan J, 2013. The strategy of major function oriented zoning and the optimization of territorial development patterns. Bulletin of Chinese Academy of Sciences, 28(2): 193-206. (in Chinese)

[9]
Fan J, 2015. Draft of major function oriented zoning of China. Acta Geographica Sinica, 70(2): 186-201. (in Chinese)

DOI

[10]
Fan J S, Yu X F, Zhou L, 2018. Carbon emission efficiency growth of land use structure and its spatial correlation: A case study of Nanjing city. Geographical Research, 37(11): 2177-2192. (in Chinese)

DOI

[11]
Fang J Y, Huang Y, Zhu J L et al., 2015. Carbon budget of forest ecosystems and its driving forces. China Basic Science, 20(3): 20-25. (in Chinese)

[12]
Galik C S, Jackson R B, 2009. Risks to forest carbon offset projects in a changing climate. Forest Ecology & Management, 257(11): 2209-2216.

[13]
Hu A G, Zhou S J, 2014. Green development: Functional definition, mechanism analysis and development strategy. China Population, Resources and Environment, 24(1): 14-20. (in Chinese)

[14]
Kohonen T, 1982. Self-organized formation of topologically correct feature maps. Biological Cybernetics, 43(1): 59-69.

DOI

[15]
Lai L, 2010. Carbon emission effect of land use in China[D]. Nanjing: Nanjing University. (in Chinese)

[16]
Li B J, Zhang Q Q, 2017. Decomposition of carbon emission influence factors in Beijing-Tianjin-Hebei region and its trend in the new normal situation. Ecological Economics, 33(4): 19-24. (in Chinese)

[17]
Li L, Dong J, Xu L et al., 2019. Spatial variation of land use carbon budget and carbon compensation zoning in functional areas: A case study of Wuhan Urban Agglomeration. Journal of Natural Resources, 34(5): 1003-1015. (in Chinese)

DOI

[18]
Li Q Q, Gong M Y, Gu Q P, 2013. Study on carbon offsetting in cap-and-trade mechanism. Environmental Science & Management, 38(8): 51-55. (in Chinese)

[19]
Li Y, 2014. Study on agricultural carbon sink function and compensation mechanism[D]. Tai’an: Shandong Agricultural University. (in Chinese)

[20]
Liu Q Q, Wang S J, Zhang W Z et al., 2019. Examining the effects of income inequality on CO2 emissions: Evidence from non-spatial and spatial perspectives. Applied Energy, 236: 163-171.

DOI

[21]
Lu J Y, Huang X J, Dai L et al., 2012. Spatio-temporal scale analysis on the equality of energy consumption carbon emission distribution in China. Journal of Natural Resources, 27(12): 2006-2017. (in Chinese)

[22]
Mao H Y, 1991. Study on coordinating development of economic, social growth with population, resources and environment at county level. Acta Geographica Sinica, 46(4): 385-395. (in Chinese)

[23]
Melillo J M, Steudler P A, Aber J D et al., 2002. Soil warming and carbon-cycle feedbacks to the climate system. Science, 298(5601): 2173-2176.

PMID

[24]
Shen T H, 2013. Study on ecological forest compensation mechanism of the Chongqing reservoir area in Three Gorges[D]. Chongqing: Southwest University. (in Chinese)

[25]
Su Y X, Chen X Z, Ye Y Y et al., 2013. The characteristics and mechanisms of carbon emissions from energy consumption in China using DMSP/OLS night light imageries. Acta Geographica Sinica, 68(11): 1513-1526. (in Chinese)

DOI

[26]
Wang G, Zhang H B, Xue F et al., 2017. Relations between land use carbon budget and economic development at county level in Chengdu city. Journal of Natural Resources, 32(7): 1170-1182. (in Chinese)

[27]
Wang H, Chen C C, Pan T et al., 2014. County scale characteristics of CO2 emission’s spatial-temporal evolution in the Beijing-Tianjin-Hebei metropolitan region. Environmental Science, 35(1): 385-393. (in Chinese)

DOI

[28]
Wang L G, Ding C X, Peng J F et al., 2020. Comparison of factors affecting tourism operators’ carbon offset willingness of forest parks. Economic Geography, 40(5): 230-238. (in Chinese)

[29]
Wen L J, Zhang J J, 2015. Progress and trends of land spatial regulation, unbalanced development and spatial externalities. China Land Science, 29(7): 4-12. (in Chinese)

[30]
Xu C L, Ren J L, Gong C J, 2014. The influence of adjustment in industrial structures on carbon emissions in Shandong Province. Journal of Natural Resources, 29(2): 201-210. (in Chinese)

[31]
Yu R, Cai J N, Leung P S, 2009. The normalized revealed comparative advantage index. Annals of Regional Science, 43(1): 267-282.

DOI

[32]
Zang H K, Yang W S, Zhang J et al., 2020. Research on carbon dioxide emissions peaking in Beijing-Tianjin-Hebei city agglomeration. Environmental Engineering, 38(11): 19-24, 77. (in Chinese)

[33]
Zhang M, Lai L, Huang X J et al., 2013. The carbon emission intensity of land use conversion in different regions of China. Resources Science, 35(4): 792-799. (in Chinese)

[34]
Zhang P T, Liu S J, Zhou Z et al., 2021. Supply and demand measurement and spatio-temporal evolution of ecosystem services in Beijing-Tianjin-Hebei Region. Acta Ecologica Sinica, 41(9): 3354-3367. (in Chinese)

[35]
Zhang S F, Song Y, Li C F et al., 2015. Land cover change and spatial difference measurement of carbon budget in Hangzhou city. Urban Problems, (6): 46-53. (in Chinese)

[36]
Zhang Y J, Wang A D, Da Y B, 2014. Regional allocation of carbon emission quotas in China: Evidence from the Shapley value method. Energy Policy, 74: 454-464.

DOI

[37]
Zhao R Q, Huang X J, Chuai X W, 2016. Misunderstandings and future trends of researches on land use carbon emissions in China. China Land Science, 30(12): 83-92. (in Chinese)

[38]
Zhao R Q, Liu Y, Li Y X et al., 2015. Overview of regional carbon compensation: Mechanism, pattern and policy suggestions. Areal Research and Development, 34(5): 116-120. (in Chinese)

[39]
Zhao R Q, Liu Y, Ma L et al., 2016. County-level carbon compensation of Henan province based on carbon budget estimation. Journal of Natural Resources, 31(10): 1675-1687. (in Chinese)

[40]
Zhao R Q, Zhang S, Huang X J et al., 2014. Spatial variation of carbon budget and carbon balance zoning of Central Plains Economic Region at county-level. Acta Geographica Sinica, 69(10): 1425-1437. (in Chinese)

DOI

[41]
Zhao Y H, Li H, Liu Y et al., 2018. Identifying driving forces of CO2 emissions in Beijing-Tianjin-Hebei region from temporal and spatial angles. Resources Science, 40(1): 207-215. (in Chinese)

[42]
Zhou H, Li G M, Zhang G Y, 2010. SOM+K-means two-phase clustering algorithm and its application. Modern Electronics Technique, 33(16): 113-116. (in Chinese)

[43]
Zhou K, 2016a. Spatial-temporal differences and cluster features of environmental pollution in China. Scientia Geographica Sinica, 36(7): 989-997. (in Chinese)

[44]
Zhou K, Fan J, Liu H C, 2017. Spatiotemporal patterns and driving forces of water pollutant discharge in the Bohai Rim Region. Progress in Geography, 36(2): 171-181. (in Chinese)

DOI

[45]
Zhou K, Li H, Shen Y M, 2020. Spatiotemporal patterns and driving factors of environmental stress in Beijing-Tianjin-Hebei region: A county-level analysis. Acta Geographica Sinica, 75(9): 1934-1947. (in Chinese)

DOI

[46]
Zhou W W, 2016b. Research on factor decomposition and scenario prediction of Beijing-Tianjin- Hebei regional energy consumption carbon emission[D]. Baoding: North China Electric Power University. (in Chinese)

Outlines

/