Research Articles

An influencing mechanism for ecological asset gains and losses and its optimization and promotion pathways in China

  • LI Jiahui , 1, 2 ,
  • HUANG Lin , 1, * ,
  • CAO Wei 1
Expand
  • 1.Key Laboratory of Land Surface Pattern and Simulation, Institute of Geographic Sciences and Natural Resources Research, CAS, Beijing 100101, China
  • 2.University of Chinese Academy of Sciences, Beijing 100049, China
* Huang Lin (1981-), PhD and Associate Professor, specialized in land use change and its ecological effects. E-mail:

Li Jiahui (1997-), Master Candidate, specialized in remote sensing of ecology and GIS. E-mail:

Received date: 2022-05-16

  Accepted date: 2022-06-27

  Online published: 2022-12-25

Supported by

The Strategic Priority Research Program of the Chinese Academy of Sciences(XDA23020202)

Abstract

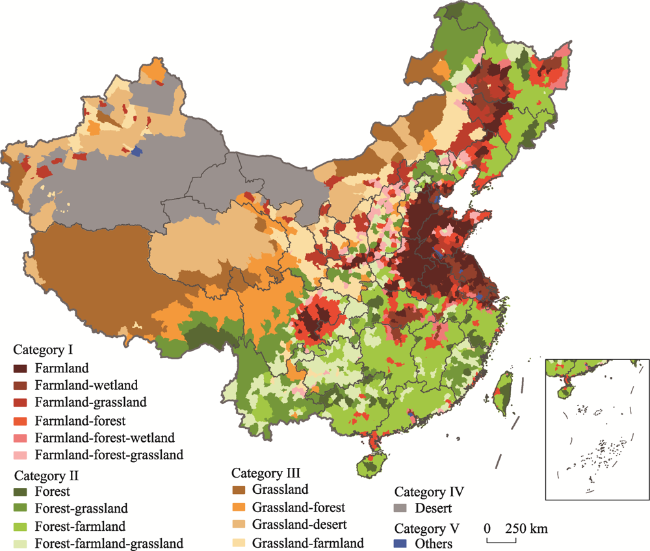
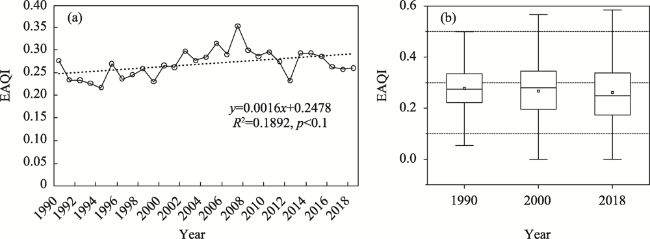
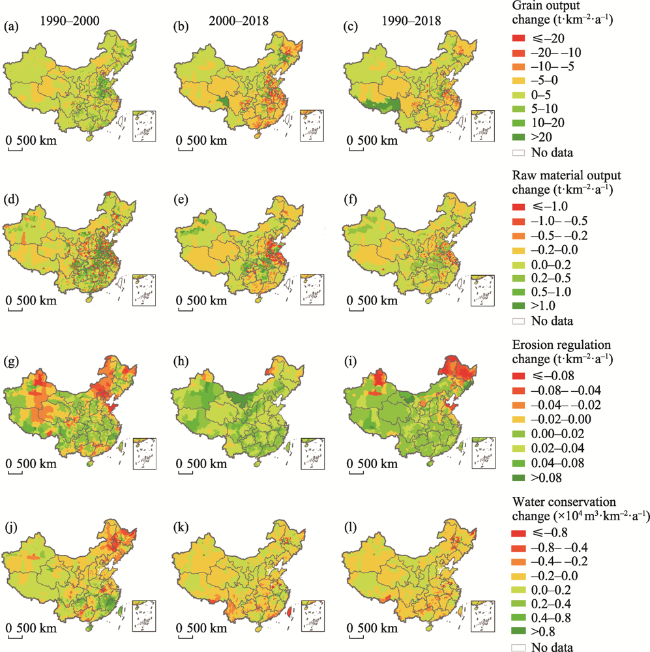
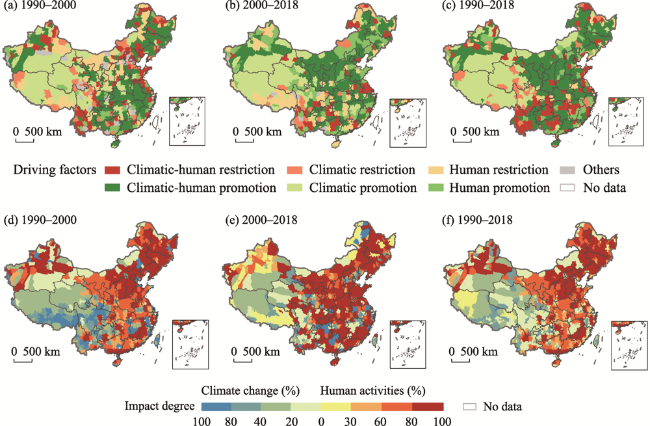
Accounting for the gains and losses of ecological assets holds scientific significance in sustaining human well-being. Based on related research on ecological assets, we established a county-scale ecological asset accounting technology system by analyzing the temporal and spatial variations of county-level ecological assets in China from 1990 to 2018 and clarified the factors which caused the gains and losses of ecological assets. On these bases, optimization and promotion pathways were proposed. The results show that the number of counties dominated by farmland and forest ecological resources accounted for about 45% and 37% of the total counties, respectively. From 1990 to 2018, the quality of county-level ecological stock assets showed an increasing trend, while the water conservation volume decreased in nearly 70% of the counties. The number of counties with the gains (47%) and losses (37%) of ecological flow assets demonstrated spatial patterns which showed the same segmentation characteristics as the “Hu Huanyong Line”, that is, the counties in the vastness of northwest China experienced significant gains, while decreases were widespread in eastern and southern China. The change of ecological assets in more than 70% of the counties was driven by climate change and human activities. The average degree of impact of human activities driving the ecological asset gains in counties was about 80%, while that of climate change causing the ecological asset losses was about 60%. According to various ecological resource types, gain and loss status, and its driving factors, counties in China can be classified into five types: climate change mitigation, climate change adaptation, ecological resources restoration, ecological resources protection, and ecological resources management. Our results indicate that differentiated optimization and promotion pathways can be adopted to achieve desired ecological asset gains.

Cite this article

LI Jiahui , HUANG Lin , CAO Wei . An influencing mechanism for ecological asset gains and losses and its optimization and promotion pathways in China[J]. Journal of Geographical Sciences, 2022 , 32(10) : 1867 -1885 . DOI: 10.1007/s11442-022-2027-0

1 Introduction

Under the Sustainable Development Goals of the United Nations, the reshaping of people’s values to establish a more productive, equitable, and sustainable mode of economic development is an urgent issue to be considered (Robert et al., 2014; Robert, 2018). To make economic development and ecological protection harmonize, the capitalization of ecological resources and ecological assets that realize the worth of ecological resources is considered one of the most effective methods (Gao, 2013). The terms “natural capital value” (Gretchen et al., 2000; Ehrlich, 2012) and “ecosystem service value” (Robert et al., 1997, 2017) are most commonly used internationally, while the domestic use of “ecological assets” has not formed a consistent concept (Liu et al., 2018), and there are great differences in its scope, methods, and results (Bai et al., 2017; Bo et al., 2017; Song et al., 2019). In a narrow sense, an ecological asset is considered as the sum of the direct-use value of a biological resource and the value of its ecosystem services (Pan et al., 2004). In a broad sense, an ecological asset consists of all forms of ecological resource value that can be measured in monetary terms and can bring direct, indirect, or potential economic benefits (Wang, 2001). At present, the mainstream view is that an ecological asset consists of natural capital as stock and ecosystem service value as flow (Zhu et al., 2007; Gao, 2013; Liu et al., 2018). Ecological flow is formed when the ecological processes and functions such as material circulation and energy generated by the ecological stocks flow to and are utilized by specific beneficiaries (Fu et al., 2017). Ecological assets are scarce and have clear property rights (Gao, 2013). An ecological asset achieves value gains through capital operation, that is, the process of transforming an ecological asset into ecological capital (Gao, 2013; Xie, 2017).
In recent years, the assessment of ecological assets has gradually become a quantitative approach in terms of paid use of resources, ecological compensation, evaluation of ecological protection benefits, natural resource management, etc. (Song, 2020; Zhang et al., 2020). Various international organizations, decision-making departments, experts, and scholars have carried out accounting for ecological assets and their value at different scales such as countries (Pan et al., 2004; Gong et al., 2017; Huang et al., 2019) and regions (Bai et al., 2017; Song et al., 2019; Pema et al., 2020). They have developed measures that include gross ecosystem product (GEP) (Ouyang et al., 2013; Pema et al., 2020), ecological asset indexes (Song et al., 2019; Huang et al., 2020), ecosystem service value based on per unit area (Xie et al., 2008; Liu et al., 2020), and other accounting and evaluation methods. Despite many studies focusing on the accounting and application of regional or county-level ecological assets, few have addressed the spatiotemporal characteristics of national ecological assets. Since a recognized, unified, and standard accounting system and method has not yet been established (Bai et al., 2017), many technical, conceptual, and institutional obstacles remain left to resolve before doing so (Hou et al., 2020). Specifically, issues such as which ecological resources and services should be included in the category of ecological asset accounting and how to determine the quantified value of an invisible ecological asset (such as cultural services, biodiversity maintenance, etc.) (Liu et al., 2018), as well as the supply and demand analysis for the stakeholders of ecological services (Jiang et al., 2019) have increased the uncertainty of accounting.
The gains and losses of ecological assets indicate the changes in the physical quantity and value quantity of ecosystem services and can potentially reveal the internal reasons for these changes. Previous studies mostly conducted qualitative analyses on the factors influencing the gains and losses of ecological assets based on land-use changes (Pema et al., 2020) and social and economic policies (You et al., 2020). It is generally believed that climate change (especially extreme climatic events such as drought and floods, cold outbreaks, and heatwaves) greatly impacts ecosystem stability and productivity (Wu et al., 2018; Yang et al., 2018). Moreover, human activities affect forest and grassland vegetation coverage and area, thus affecting ecosystem processes and functions (Xie, 2017; Pema et al., 2020). In terms of quantifying influencing factors, previous studies have used methods such as change tables of ecological asset physical quantities (Song et al., 2019) and correlation analysis (Gong et al., 2017; Huang et al., 2019), which found that increased heat caused by climate change promotes the quality and improvement of the forest and grassland ecological assets and that agricultural development and urbanization contribute significantly to the decline of the ecological asset index (Huang et al., 2019). Additionally, water conservation services are significantly positively correlated with climatic factors such as temperature, precipitation, and evapotranspiration, while negatively correlated with the gross domestic product as well as the population density (Gong et al., 2017). Therefore, dismantling and quantifying the influencing mechanisms of climate change and human activities has remained a major challenge and a point of particular interest.
The county is the basic unit of administrative management in China. Thus, accounting, monitoring, and evaluating the condition and changes of ecological assets and exploring different pathways to realize the value increment of ecological assets at the county scale are conducive to the simultaneous development of economic growth and ecological protection in counties. Such an development plays an important role in implementing the transformation of “Lucid Waters and Lush Mountains are Invaluable Assets” and supporting the value gains of ecological products and eco-compensation that promote the sustainable development of the entire national economy.
This paper constructs a county-level ecological asset evaluation index system and a corresponding accounting method. First, the ecological asset types and quality indexes in counties were analyzed from the perspective of stock. Then the physical and value quantities of ecological flow assets and their changes were calculated, from which the impact mechanisms of climate change and human activities were deduced. Finally, according to different types of ecological resources, gain and loss status, and driving factors, counties were classified into five types: climate change mitigation, climate change adaptation, ecological resources restoration, ecological resources protection, and ecological resources management. Through this classification scheme, differentiated optimization and promotion pathways can be adopted to achieve gains in ecological assets.

2 Methods

2.1 Data

In this paper, all the industry statistics, remote sensing images, and model simulation data were processed and analyzed at the county scale.
(1) The statistical data include the data of grain, cotton, and oil production and market price, collected from the China County Statistical Yearbook and the China Rural Statistical Yearbook. The sewage treatment cost data were obtained from the 2018 Special Report on Water Prices in 65 cities (regions) across China.
(2) The extreme climate data, such as the number of freezing days, warm days, and extremely heavy precipitation from 1990 to 2018, were extracted from HadEX3 (https://www.metoffice.gov.uk/hadobs/hadex3), with a spatial resolution of 1.875°×1.25°.
(3) The Net Primary Productivity (NPP) data from 1990 to 2000 were obtained from the monthly NPP dataset covering China’s terrestrial ecosystems at north of 18°N (1985-2015) with a 1-km resolution, simulated by the CASA model (Chen, 2019). The NPP data from 2000 to 2018 were MOD17A3 products (https://Ipdaac.usgs.gov/) with a spatial resolution of 500 m and were resampled to a 1-km resolution. The NPP data were converted to a normalized relative value in the calculation, avoiding the difference in absolute value between the two datasets.
(4) The ecosystem types in this study included farmland, forests, grasslands, wetlands, and deserts, derived from the secondary type of 30-m resolution land use and land cover data in 2018, downloaded from Resource and Environment Science and Data Center (http://www.resdc.cn/).
(5) Meteorological data consisting of the daily average wind speed, precipitation, temperature, and sunshine duration from 1990 to 2018 were collected from the National Meteorological Science Data Center (http://data.cma.cn). The temperature and precipitation were processed by ANUSPLIN interpolation, and the wind speeds were processed by Kriging interpolation.
(6) AVHRR NDVI data from 1990 to 2002 and MODIS NDVI data from 2000 to 2018 were collected, and linear regression was used to correct the overlapping years of the two datasets. The vegetation coverage at the half-month scale with a spatial resolution of 1 km was then calculated by NDVI.
(7) Other data including soil and snow cover were collected from a 1:1,000,000 soil type map with an attached soil property sheet and a long-term series of daily snow depth data, respectively. These were downloaded from National Tibetan Plateau Data Center (http://data.tpdc.ac.cn/). A Chinese Digital Elevation Model (DEM) with a 90-m resolution was then processed based on SRTM3 V4.1 data.

2.2 County-level ecological assets and their gains and losses accounting methods

2.2.1 Ecological asset accounting and evaluation indicators

In this paper, the ecological assets in counties consist of all the ecological resource assets that can provide ecological products and welfare for human beings, including ecosystem area and quality as stock, and ecosystem services as flow. The evaluation indexes of an ecological asset at the county level (Table 1) refer to the area and quality as the ecological stock asset indexes. Ecological flow asset assessment includes two first-level and seven second-level indicators, such as services that foster human survival and health, provide production factors, and ensure ecological security.
Table 1 Indexes and methods of ecological asset accounting at the county level
Asset category Primary indicator Secondary indicator Accounting method Indicator and parameter description
Stock assets Area of ecological resource assets Asset types Ranking of the proportional area of forest, farmland, grassland, wetland, and desert ecological resource Category I: Farmland, farmland-forest-wetland, farmland-forest-grassland, farmland-forest,
farmland-grassland, farmland-wetland;
Category II: Forest, forest-farmland-grassland, forest-farmland, forest-grassland;
Category III: Grassland, grassland-farmland, grassland-forest, grassland-desert;
Category IV: Desert; Category V: Others
Quality of ecological resources Quality index $E{{Q}_{ij}}=\frac{NP{{P}_{ij}}}{MNP{{P}_{i}}}$
$EAQ{{I}_{k}}=\underset{i=1}{\overset{m}{\mathop \sum }}\,\frac{E{{Q}_{ij}}}{{{S}_{ki}}}\times \frac{{{S}_{ki}}}{{{S}_{k}}}$
EQij is the ecological asset quality of the j-th pixel in the i-th ecosystem asset type, and NPPij is the NPP (kgC·ha-1) of it. MNPPi is the highest NPP nationwide of the i-th type ecological asset (kgC·ha-1). EAQIk is the ecological asset quality index of the k-th county. Ski is the area of the i-th type of ecological asset in the k-th county (ha). Sk is the total area of the ecological assets in the k-th county (ha).
Flow
assets
Supply services Food supply ${{V}_{FS}}=FS\times {{P}_{f}}$ FS is the grain outputs (t·a-1). Pf is the unit price, and the average selling price of rice, wheat, and corn is 2194 yuan·t-1.
Raw material supply ${{V}_{PS}}=\underset{j=1}{\overset{m}{\mathop \sum }}\,P{{S}_{j}}\times {{P}_{pj}}$ PSj is the outputs of the j-th product (t·a-1), and Ppj is its unit price. The average selling prices of cotton and oil crops are 14,564 yuan·t-1 and 6452 yuan·t-1, respectively.
Regulation services Sedimentation reduction $SC=({{M}_{sc}}-{{M}_{sce}})\times A$
${{V}_{SC}}=SC/{{\rho }_{s}}\times {{P}_{SC}}$
SC is the soil conservation amount (t·a-1). Msc is the soil water erosion amount under the actual surface cover condition (t·ha-1·a-1), while Msce is the soil water erosion amount under the extremely
degraded state (t·ha-1·a-1). A is the area of the
ecosystem (ha); ρs is the soil bulk density (t·m-3) (Han et al., 2016). PSC is the excavation cost per unit area, which is 12.6 yuan·m-3
(DB11/T 659-2018).
Dust pollution reduction $SF=({{M}_{sf}}-{{M}_{sfe}})\times A$
${{V}_{SF}}=SF\times {{P}_{SF}}$
SF is the amount of sand fixation (t·a-1). Msf is the amount of soil wind erosion under the actual surface cover condition (t·ha-1·a-1), and Msfe is the amount of soil wind erosion under the extremely degraded state (t·ha-1·a-1). A is the area of the ecosystem (ha). PSF is the cost of dust pollution reduction, which is 150 yuan·t-1 (DB11/T 659-2018).
Soil fertility maintenance $\begin{align}
& {{V}_{NR}}=\underset{i=1}{\overset{m}{\mathop \sum }}\,(SC+SF) \\
& \times {{C}_{i}}\times {{T}_{i}}\times {{P}_{ci}}
\end{align}$
Ci is the content (%) of soil nitrogen, phosphorus, potassium, and organic matter. Ti is the conversion factors for nitrogen, phosphorus, and potassium to urea, superphosphate, and potassium chloride, which are 2.164, 4.065, and 1.923, respectively (Han et al., 2012). Pci is the market price of urea, superphosphate, potassium chloride, and organic fertilizer, which are 1990, 800, 2200, and 320
yuan·t-1, respectively (DB11/T 659-2018).
Water
regulation
$WC=A\times ({{J}_{0}}\times K)\times ({{R}_{0}}-{{R}_{r}})$
${{V}_{WR}}=WC\times {{P}_{WR}}$
WC is the precipitation stored by ecosystems (t·a-1). A is the area of the ecosystem (ha). J0 is the annual precipitation (mm). K is the ratio of runoff to the total precipitation. R0 is the runoff yield ratio of the bare land, and Rr is the runoff yield ratio of the ecosystem. PWR is the unit storage cost of the reservoir, which is 6.1107 yuan·m-3 (DB11/T 659-2018).
Water
purification
${{V}_{WP}}=WC\times {{P}_{WP}}$ PWP is the price of sewage purification, which is 0.95 yuan·t-1.

2.2.2 Evaluation methods of ecological stock assets

Determining the main and combined types of ecological assets in counties is beneficial to highlighting the key points of accounting and formulating corresponding coordination strategies. The principle of particular importance should be followed in the process of clarifying the types of ecological stock assets; that is, the ecological assets that dominate in quantity reflect the condition of regional natural resources (Xie, 2017). Based on the ecosystem type data in 2018, the area and its proportion of each ecosystem type in each county were counted and ranked, and the ecological stock asset type of the county was determined according to the ranking. The ecosystems with a proportional area greater than 10% were included in the ranking, and the counties with an ecosystem whose area greater than 80% were classified as a single type such as farmland, grassland, etc. Furthermore, the counties with numbers less than 30 (about 1% of the total number of counties) were reclassified into other categories. In total, 16 types of county asset types were classified (Table 1), including four single types and 12 combination types, which consisted of six types dominated by farmland ecological resources (category I), four types dominated by forest ecological resources (category II), four types dominated by grassland ecological resources (category III), one type specific to desert ecological resources (category IV), and one type representative of other categories (category V).
The quality of the ecological stock assets affects the ecosystem functions and services they provide. The NPP data can be used as an important indicator to measure ecosystem quality (Li et al., 2021), and according to the ecological asset index method, the highest NPP value of different ecological resource types served as an ecological reference system for this kind of ecological resource using the percentile method (Table 1). Then the ecological stock asset quality (EQ) of each pixel was calculated by the ratio of NPP to that of the ecological reference system. Finally, the ecological stock asset quality indexes (EAQI) of each county were obtained by summing the product of the EQ and the proportional area of corresponding ecological asset types in the county.

2.2.3 Accounting methods of ecological flow assets

Since ecosystem support services (such as soil formation services) are intermediate services that are not directly linked to human well-being, this paper focused on accounting for the physical quantities of major ecosystem supply and regulation services (Liu et al., 2018) and calculated their value based on constant prices in 2018 (Pema et al., 2020) (Table 1). Supply services include food, wood, and fiber products, whose value was quantified using market value methods. Regulation services include erosion regulation, water volume regulation, and water quality purification. The ecosystem regulates the process of wind erosion and water erosion through the vegetation canopy, litter, and roots, promoting the reduction of soil loss, fixing quicksand, and maintaining soil fertility (Ouyang et al., 2013). The modified general soil loss equation (RUSLE) (Ausseil et al., 2013) and the modified soil wind erosion equation (RWEQ) (Fryrear, 1998) were used to quantify soil water erosion and wind erosion, respectively. The quantities of soil water conservation and sand fixation were then calculated through the difference between actual soil erosion and erosion of the ecosystem under extremely degraded conditions (Huang et al., 2015). And the value of reducing sediment and dust pollution was calculated based on substitution cost methods and shadow price methods which quantified the value of maintaining soil fertility. Through interception, absorption, and precipitation storage, the ecosystem plays a stabilizing role in improving and purifying water quality; thus, providing available water resources for human beings (Ouyang et al., 2013). The precipitation storage quantity method (Zhao et al., 2004) was used to calculate the physical quantities of water regulation and water purification (i.e., water conservation quantities), and their value was quantified by substitution cost methods.

2.2.4 Assessment methods of gains and losses of ecological assets

By analyzing the changes of physical quantity and value quantity of ecological assets from 1990 to 2000, from 2000 to 2018 and from 1990 to 2018, the gains and losses of ecological assets were evaluated. The unitary linear regression method was used to calculate the slope of the inter-annual change trend of ecological flow asset value per unit area in three periods, and the variance analysis method was used to test its significance. Theoretically, when the slope is zero, the ecological assets in the county remain unchanged. Considering fluctuations and uncertainty factors, ±10% was taken as the tolerance in this paper. If the slope is higher than 10% or lower than -10%, it indicates gains and losses, respectively. According to the results of an F test, that is, when p ≤ 0.01, the trend was very significant; and no significant change was observed when p > 0.05 (Pan et al., 2020). The changes of gains and losses of ecological assets in counties were further subdivided into seven categories, which were significant losses (< -80%), moderate losses (-80% to -30%), mild losses (-30% to -10%), basic balance (-10% to 10%), mild gains (10% to 30%), moderate gains (30% to 80%) and significant gains (> 80%).

2.3 Identification and determination of driving factors

Climate change and human activities jointly affect the processes and functions of ecosystems, driving the gains and losses of ecological assets. In this paper, the multiple regression residual analysis method (Wessels et al., 2007; Jin et al., 2020) was used to determine the degree of impact of climate change and human activities on the gains and losses of the ecological assets, based on which the dominant driving factors of different counties were identified. Studies showed that extreme climate events, such as drought and heavy precipitation, greatly affected ecosystem change (Yang et al., 2018; Hu, 2021). First, through correlation analysis, extreme climate indices (TX90p, R99p) that have a great impact on the gains and losses of ecological assets were screened out, where TX90p is the percentage of days within a year when daily maximum temperature was greater than 90th percentile, and R99p is the annual sum of the daily precipitation greater than the 99th percentile (Robert et al., 2020). By taking these two indices as independent variables and the value of ecological flow assets per unit area (ESVobs) as the dependent variable, a binary linear regression equation was established. Based on the regression equation and extreme climate data, the predicted value of ecological flow assets per unit area driven by extreme climate (ESVcc) was calculated. The difference between ESVobs and ESVcc, namely the residual, which represented the impact of human activities on the gains and losses of ecological assets was calculated as follows:
$ESV_{cc}= a × TX90p + b × R99p+c$
$ES{{V}_{ha}}=ES{{V}_{obs}}-ES{{V}_{cc}}$
where TX90p and R99p are warm days (%) and extremely wet days (mm), respectively; a, b, and c are regression model parameters.
The trend of ESVcc and ESVha was calculated by a unary linear regression method, that is, the change trends of the value of ecological flow assets driven by extreme climate (slopecc) and human activities (slopeha), respectively. If the trend > 0, it indicates that the driving factors promoted the gains of ecological assets. Conversely, if the trend < 0, the gains of ecological assets were inhibited. The ratio between slopecc, slopeha, and the slopeobs, represents the relative effect rate of extreme climate events and human activities, respectively (Table 2). Then the dominant driving factors of gains and losses of ecological assets in different counties can be further identified by comparing the impact degree of climate change and human activities.
Table 2 Identification criteria and calculation methods of the drivers and their impact degree of ecological asset gains and losses
slopeobs slopecc slopeha Impact degree of climate change (%) Impact degree of human activities (%) Explanation
> 0 > 0 > 0 $\frac{slop{{e}_{cc}}}{slop{{e}_{obs}}}$ $\frac{slop{{e}_{ha}}}{slop{{e}_{obs}}}$ The combined effect of climate change and human activities have led to the gains of an ecological asset
> 0 < 0 100 0 Climate change has led to the gains of an ecological asset
< 0 > 0 0 100 Human activities have led to the gains of an ecological asset
< 0 < 0 < 0 $\frac{slop{{e}_{cc}}}{slop{{e}_{obs}}}$ $\frac{slop{{e}_{ha}}}{slop{{e}_{obs}}}$ The combined effect of climate change and human activities have led to the losses of an ecological asset
< 0 > 0 100 0 Climate change has led to the losses of an ecological asset
> 0 < 0 0 100 Human activities have led to the losses of an ecological asset

2.4 Classification of types of optimization and promotion pathways for counties

According to the differences in ecological stock asset types, the gains and losses of ecological flow assets from 1990 to 2018, and the dominant driving factors, counties were classified into 5 types consisting of 22 combination types (Table 3). Among them, I-V represent different types of ecological stock assets (Table 1). A, B and C indicate that the ecological assets in counties showed a trend of gains, losses and balance from 1990 to 2018 respectively. a and b respectively indicate that ecological assets in counties were mainly driven by human activities or extreme climate events. Differentiated approaches to improve the quality and value of ecological assets were proposed for different types of counties, including adaptation and mitigation measures to cope with climate change, ecological resource asset management, ecological protection and restoration, ecological industrialization and other measures.
Table 3 Classification methods of optimization and promotion pathways of ecological assets at the county level in China
Optimization and promotion type Composition Criteria
Climate change adaptation IAb, IIAb, IIIAb, IVAb,
ICb, IICb, IIICb
Counties dominated by farmland, forest and grassland ecological assets with balance or gain trend from 1990 to 2018, which were mainly driven by climate change
Climate change mitigation IBb, IIBb, IIIBb, IVBb Counties dominated by farmland and forest ecological assets with loss trend from 1990 to 2018, which were mainly driven by climate change
Ecological resource restoration IBa, IIBa, IIIBa, IVBa Counties dominated by farmland and forest ecological assets with loss trend from 1990 to 2018, which were mainly driven by human activities
Ecological resource conservation IAa, IIAa, IIIAa, IVAa Counties dominated by farmland, forest and grassland ecological assets as the main asset types with gain trend, which were mainly driven by human activities
Ecological resource management ICa, IICa, IIICa Counties dominated by farmland and forest ecological assets with balance trend from 1990 to 2018, which were mainly driven by human activities

3 Results

3.1 Spatial and temporal variation characteristics of ecological assets and their gains and losses at the county level in China over the past 30 years

Among the 2853 counties in China, about 45% of them had a large proportion of farmland as an ecological asset (category I) which accounted for 37.4% of the total area of China. Such areas tended to be concentrated in the Northeast China Plain, North China Plain, middle and lower Yangtze Plain, Sichuan Basin, and other regions (Figure 1). A relatively large proportional area of forest ecological assets (category II) was present in 37% of the counties, accounting for 29.2% of the total area. These tended to be distributed in Northeast China, the middle and lower reaches of the Yangtze River, and Southwest China. About 15% of the counties were dominated by grassland ecological assets (category III), mainly distributed in Tibet, Qinghai, northwest Xinjiang, and central and eastern Inner Mongolia, accounting for 17.8% of the total area. Less than 5% of the counties (category IV) were dominated by desert ecological assets, which were distributed in central and eastern Xinjiang, Gansu, and western Inner Mongolia, accounting for about 15.6% of the total area. From 1990 to 2018, the EAQI in counties across China showed an overall increasing trend in their fluctuation, and the range of EAQI values in each county increased, indicating that the changes of ecological asset quality in different counties varied within their overall increasing or decreasing trends (Figure 2).
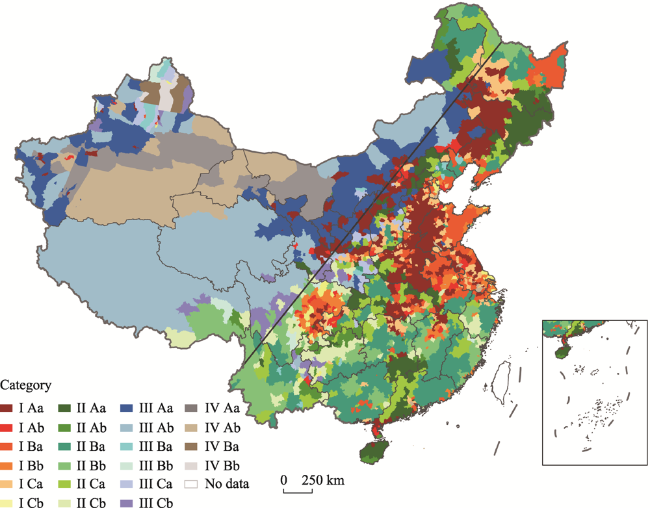
Figure 1 Spatial distribution of ecological asset types at the county level in China
Figure 2 Interannual variation and range of the ecological asset quality index at the county level in China, 1990-2018
From 1990 to 2018, the grain outputs in about 59.5% of the total counties increased (Figure 3). From 1990 to 2000, grain yields in about 82.8% of the counties increased, especially those in the Huang-Huai-Hai Plain (> 20 t·km-2·a-1). From 2000 to 2018, grain yields in about 46.7% of the counties increased, while those in eastern China counties significantly decreased. From 1990 to 2018, the outputs of raw materials increased in 61.2% of the counties. From 1990 to 2000, raw material outputs in about 65.2% of the counties increased rapidly, distributed in the Huang-Huai-Hai Plain, Yangtze River Delta, Sichuan-Chongqing, Hunan-Jiangxi, and Pearl River Delta (> 1 t·km-2·a-1). However, from 2000 to 2018, raw material outputs decreased to varying degrees in about 34.8% of counties distributed in the Huang-Huai-Hai Plain and other regions. From 1990 to 2018, the erosion regulation at the county level showed an overall increasing trend, while the erosion regulation decreased in 31.8% of the counties. These areas of decline were concentrated in the Da Hinggan Mountains, the northern Northeast China Plain, the Shandong Peninsula, and northern Xinjiang. From 1990 to 2000, the erosion regulation showed a rapid decrease in counties located in central and eastern Inner Mongolia, the Shandong Peninsula, and northern Xinjiang. However, from 2000 to 2018, the erosion regulation in about 96.4% of the counties showed an increasing trend, especially in western Inner Mongolia. From 1990 to 2018, the water conservation in only 33.2% of the counties increased, while from 1990 to 2000, the water conservation in 53.5% of the counties decreased to varying degrees. This was especially noticeable in the Da Hinggan and Xiao Xinggan mountains (≤ -8000 m3·km-2·a-1). From 2000 to 2018, the scope of the counties experiencing water conservation reductions has expanded.
Figure 3 Temporal and spatial distribution of ecological flow asset quantities at the county level in China, 1990-2018
The ecological flow asset value per unit area in about 34.4% and 30.3% of the counties was between 0.5 to 1.5 million yuan·km-2 and 1.5 to 2.5 million yuan·km-2, respectively (Figure 4a). About 11.3% of the counties with a high value per unit area (> 3.5 million yuan·km-2) were concentrated in Inner Mongolia, Northeast China, western Sichuan, Zhejiang, Fujian, Hainan, and Xizang. In contrast, the counties with higher urbanization levels had lower unit area value (≤ 500,000 yuan·km-2), distributed in the middle and lower reaches of the Yangtze River, Chengdu-Chongqing, the Pearl River Delta, and other areas. From 1990 to 2018, ecological flow asset value in about 43.7% and 37% of counties showed a trend of loss and gain, respectively, showing the same segmentation characteristics as the “Hu Huanyong Line” (Figures 4b-4d). Specifically, ecological flow asset value in counties distributed in western Inner Mongolia, southern Xinjiang, northwest Tibet, and other vast areas of northwest China mainly gained. In contrast, those eastern and southern counties experienced some losses. From 1990 to 2000, ecological flow asset value in 37% of the counties showed a trend of gains. Those located in the Changbai Mountains, Longxi, Central Tibet, and southern Xinjiang increased significantly. In more than 35% of the counties, the ecological flow asset value decreased, and most of the areas along the “Hu Huanyong Line” showed a moderate or significant declining trend. From 2000 to 2018, the counties with losses and gains of ecological flow asset value accounted for 43.3% and 30%, respectively. The ecological flow asset value in counties along the “Hu Huanyong Line” changed from losses to gains, especially those in the Loess Plateau and western Inner Mongolia, which showed significant gains, while those in Sichuan, Chongqing and Hubei, the Yangtze River Delta, and the Pearl River Delta decreased significantly.
Figure 4 Temporal and spatial distribution of ecological flow asset value at the county level in China, 1990-2018

3.2 Driving factors and their degree of impact on ecological asset gains and losses at the county level

From 1990 to 2018, the gains and losses of ecological assets in more than 50% of the counties were simultaneously promoted by climate change and human activities (climatic-human promotion type) (Figures 5a-5c). These were mainly distributed in the northeast and Midwest of Inner Mongolia, the Loess Plateau, western Xinjiang, and other regions. The climatic-human restriction counties, accounting for about 20% of the total, were scattered in the Shandong Peninsula, Sichuan and Chongqing, Hunan and Jiangxi, and the Yunnan and Guizhou regions. From 1990 to 2000, climate change and human activities promoted ecological flow asset value in about 40% of the counties, mainly distributed in the Northeast China Plain and the Yangtze River Delta. About 18% of the total counties were classified as the climatic-human restriction type, distributed in Beijing-Tianjin-Hebei region, the Shandong Peninsula, Yunnan, Guangxi, and northern Xinjiang. Ecological flow asset value in about 8% of counties was negatively affected by human activities, distributed in Inner Mongolia, the Loess Plateau, and the Da Hinggan Mountains. In recent 20 years, the number of counties decreased where ecological flow asset value restricted by climate change and human activities in comparison to the previous 10 years, while those in the Yunnan-Guizhou Plateau that were affected by climate change increased, which was the main reason for the ecological asset losses in the region. The driving factor behind the changes of ecological assets in the Loess Plateau, western Inner Mongolia, and northern Xinjiang changed from restriction types to the climatic-human promotion type, which supported the obvious improvement of ecological assets in these regions.
Figure 5 Spatial and temporal distribution of climate change and human activity driving factors (a-c) and their degree of impact (d-f), which affected the ecological asset gains and losses at the county level in China, 1990-2018
From 1990 to 2018, the ecological assets in about 66.8% of the counties were mainly driven by human activities and were distributed on the east and south sides of the “Hu Huanyong Line.” In particular, in northeast China, the Beijing-Tianjin-Hebei region, and the central and western Inner Mongolia, the ecological assets in about 34% of the counties were promoted by human activities at an impact degree of more than 80%. In comparison, the ecological assets in counties located in southeast Tibet and Yunnan-Guizhou Plateau were greatly affected by climate change, with an average degree of impact of about 60%. From 1990 to 2000, climate change-driven counties accounted for about 31.1% of the total, among which, the impact degree of climate change on ecological assets exceeded 80% in counties that were distributed in southeastern Tibet, Sichuan, Yunnan, Guizhou, and Jiangsu and Zhejiang, where the extreme weather events played an important role. From 2000 to 2018, the contribution of human activities to ecological assets increased gradually, especially those in the Loess Plateau and western Inner Mongolia, where it exceeded 80%. However, in the counties distributed in the middle and lower reaches of the Yangtze River, Sichuan and Chongqing, southeast coastal areas, and other regions with high levels of urbanization, the inhibition rate of human activities on ecological assets increased. In general, human activities had a greater impact on ecological assets than climate change.

3.3 Optimization and promotion pathways of county-level ecological assets

For counties of five categories and 22 subcategories (Figure 6), different measures and pathways are needed to optimize and improve their ecological assets.
Figure 6 Spatial distribution of optimization and promotion pathways of ecological assets at the county level in China
Among those counties of the climate change adaptation type, generally dominated by the farmland ecological assets and concentrated in the Northeast China Plain, North China Plain, and middle and lower Yangtze Plain, should make full use of the favorable influence of climate, adjust crop planting structure in a strategic and timely manner, adopt interplanting, mixed planting and other tillage systems. In counties with forests as the main ecological asset, distributed in the Changbai Mountains, the middle reaches of the Yangtze River, and the Pearl River Delta, the ecological resource composition can be optimized through mixing, thinning, replanting, and other measures. The counties dominated by grasslands as their ecological assets in the Inner Mongolia Plateau and Northwest China can take measures such as natural grassland protection and improvement to develop their ability to adapt to climate change.
Among counties of the climate change mitigation type, those with farmland as the main ecological assets, distributed in the Sanjiang Plain, the Yangtze River Delta, and the Sichuan Basin, should strengthen the construction of their agricultural water conservancy infrastructure to reduce the impact of extreme weather events such as heavy rainfall, drought, and flooding events. Attention should be paid to forest fire and pest control to reduce the risk of sudden disturbances in forest-dominated counties in the Da Hinggan Mountains, Xiao Hinggan Mountains, and Hengduan Mountains. In grassland-dominated counties, measures should be taken such as returning grazing lands to grasslands, rest grazing, rotation grazing, and prohibiting grazing to promote the natural restoration of grasslands. Desertification control measures should be strengthened in desert-dominated counties.
As for counties of the ecological resource restoration type, which tend to be farmland dominated, including those in the Sanjiang Plain, Shandong Peninsula, Jiangsu and Zhejiang provinces, and the Sichuan Basin, need to protect basic farmland and renovate abandoned farmland and abandoned land. Forest-dominated counties in Yunnan, Guizhou, and Southeast China need further afforestation. The counties dominated by the grassland ecological assets should strengthen the restoration of degraded grasslands and return grazing land to grasslands. Desertification prevention and control measures should be carried out in desert-dominated counties according to local conditions to curb land degradation and desertification.
Among those counties of the ecological resource protection type with farmland as the main ecological assets, such as those distributed in the Northeast China Plain, North China Plain, and the Loess Plateau, should protect high-quality farmland resources and develop ecological agriculture, leisure, and sightseeing agriculture to improve the value of ecological products. The grassland-dominated counties distributed in central and eastern Inner Mongolia, the Loess Plateau, the Qilian Mountains, and western Xinjiang should strengthen their protection of natural grasslands and consolidate their efforts of ecological protection. In the forest-dominated counties in the Taihang Mountains and the north of Beijing-Tianjin-Hebei, natural forests should be protected. Furthermore, ecological industries such as health care, leisure, and tourism should be developed to realize the sustainable appreciation of ecological assets.
The counties of the ecological resource management type should strive to improve the quality and benefit of ecological resources and realize the value gains of ecological assets. The farmland-dominated counties in the Northeast China Plain, North China Plain, and Pearl River Delta can adopt measures such as circular agriculture and combining planting and grazing to improve agricultural production efficiency. Forest-dominated counties should strengthen management to improve forest quality. For grassland-dominated counties distributed in western Sichuan and southern Shaanxi, measures including natural grassland protection and the balance between grassland forage supply and livestock-carrying pressure should be strengthened.

4 Conclusions and discussion

4.1 Conclusions

This paper analyzed the spatiotemporal variation of ecological asset gains and losses at the county level in China from 1990 to 2018. The factors and their impact degree which drove the gains and losses of ecological assets were also analyzed. Then differentiated optimization and promotion pathways for different county types were proposed. The main results are as follows:
Most of the counties in China were dominated by forest and farmland ecological assets, which accounted for 45% and 37% of the total, respectively. Ecological stock assets in 22.8% of the counties were classified as single types, namely farmland, forest, grassland, and desert, which accounted for 16.5%, 2.7%, 2.3%, and 1.3%, respectively. The ecological asset quality index in 25.5% of the counties was high. The ecological flow asset value in 5.3% of the counties was high, while low values were evident in about 12% of the counties, which were distributed in the middle and lower reaches of the Yangtze River, Chengdu-Chongqing, the Pearl River Delta, and other regions.
From 1990 to 2018, the ecological flow assets showed gains in 43.7% of the total counties in western Inner Mongolia, Southern Xinjiang, and Northwest Tibet, while those in about 37% of counties in the southeast showed a decreasing trend. From 1990 to 2000, counties with either gains or losses of ecological flow assets exceeded 35%. This was especially noted for counties in the Sanjiang Plain, Shandong Peninsula, eastern Beijing-Tianjin-Hebei, and the Loess Plateau, where significant losses occurred. From 2000 to 2018, the counties with losses and gains in ecological assets accounted for 43.3% and 30%, respectively. The ecological assets in counties distributed in Beijing-Tianjin-Hebei, the Loess Plateau, and the Shandong Peninsula changed from loss to gain status.
From 1990 to 2018, the gains and losses of ecological assets in more than 70% of the counties were affected by climate and human activities, and the impact of human activities was greater than that of climate change. The ecological assets changed from losses to gains in counties located in the Loess Plateau and Inner Mongolian Plateau, where the positive effects of human activities increased by about 10%. The degree of the negative impact of human activities exceeded 80% in counties distributed in the middle and lower reaches of the Yangtze River, Sichuan-Chongqing, the southeast coastal areas, and other regions with high urbanization levels which drove the losses of the ecological assets. The counties in the Yunnan-Guizhou Plateau and southeastern Tibet, where ecological assets were greatly affected by extreme climate events, were affected at an average rate of about 60%.
The climate change-dominated counties that experienced a balance or gains of ecological assets should further optimize the structure of ecological resources to improve their quality and ability to adapt to climate change. Counties where climate change drove the losses of ecological assets should take proactive measures to mitigate the adverse effects of climate change. A focus on ecological restoration is needed for those counties where human activities damaged ecological assets. For those counties with ecological asset gains promoted by human activities, the benefits of the ecological assets should be protected and enhanced.

4.2 Discussion

Under the background of global climate change, ecological stock and flow assets at the county level in China have increased in the past 30 years, and human activities were the driving force of ecological asset gains in most counties. First, the implementation of a series of major ecological projects in China since 2000 has played an important role in improving the quality of ecological stock assets and the value of ecological flow assets at the county level (Huang et al., 2019). In particular, there were many ecological projects along the “Hu Huanyong Line” with remarkable benefits, and the spatial segmentation feature of ecological asset gains and losses was very obvious. For instance, The returning of farmland to forest (grassland) project has significantly promoted ecological restoration and ecosystem service value improvement on the Loess Plateau (Zhu et al., 2021), which was the main driving force behind ecological asset gains. Second, urbanization increasingly occupied ecological resources, reducing their area, directly leading to asset impairment with an impact degree of more than 80%, especially in urban agglomeration areas (Kong et al., 2018). In general, this effect exceeded that of climate change, which was consistent with the existing research results (Huang et al., 2020). Third, extreme climate events such as floods and heatwaves have increased and intensified, causing great damage to the ecosystem (Wu et al., 2018). In the future, more attention should be paid to the mitigation and adaptation of climate change to reduce its adverse impact.
The uncertainties in this paper include: (1) Accounting and evaluating indicators, forest products, vegetable and fruit supplies, ecosystem cultural services, biodiversity, and other indicators were not considered due to the limitations of data sources and methods. Moreover, the quality evaluation was only based on NPP, and multiple indexes such as biomass and coverage should be integrated. It is necessary to improve ecological asset accounting indicators and propose accounting methods of indicators that are difficult to quantify. (2) The integrated use of multi-source heterogeneous data with differing temporal and spatial resolution was restricted to the county scale. Therefore, further exploring the differences within the county at the grid scale is of great significance. (3) The multiple regression residual analysis has some shortcomings in determining the role of driving factors. It is based on the assumption that the gains and losses of ecological assets are mainly driven by climate and human activities without considering other driving factors. There is still no conclusion concerning the reasonable selection of driving factors (Huang et al., 2015). Technology, policy, and socioeconomic factors should be further introduced to refine the analysis of the driving forces of human activities. (4) Due to the lack of unified standards for calculating ecological asset quality and value, the accounting results, especially the value, are uncertain. Using the relative change of value to evaluate the gains and losses of ecological assets can weaken the absolute value error to a certain extent and be applied to policy research (Xie, 2017).
Evaluation of ecological assets and their gains and losses at the county level provides a basis for evaluating the effectiveness of ecological civilization construction and the formulation of a pathway towards sustainable development (Li, 2020). On the one hand, the assessment of ecological stock assets reflects the condition of ecosystems in counties, conducive to the deployment of ecological projects according to local conditions and the improvement of the efficiency of using ecological protection funds (Huang, 2017). For instance, identifying important ecological services and key ecological space in counties by ecological flow asset value assessment facilitates the identification of key areas and major projects for ecological protection and transfer payments. On the other hand, by analyzing the gains and losses of ecological assets and their driving force, it is possible to determine the main restrictive factors for improving ecological assets in different regions and formulating corresponding optimal management strategies. In addition, ecological asset assessment can comprehensively indicate the ecological protection effectiveness at the county level, which is conducive to evaluating the ecological and environmental impacts of different planning decisions, thereby promoting the integration of multiple plans; thus, optimizing the ecological spatial patterns (Li, 2020) and protecting and realizing the gains of the ecological assets.
[1]
Ausseil A G E, Dymond J R, Kirschbaum M U F et al., 2013. Assessment of multiple ecosystem services in New Zealand at the catchment scale. Environmental Modelling & Software, 43: 37-48.

[2]
Bai Yang, Li Hui, Wang Xiaoyuan et al., 2017. Evaluating natural resource assets and gross ecosystem products using ecological accounting system: A case study in Yunnan Province. Journal of Natural Resources, 32(7): 1100-1112. (in Chinese)

[3]
Beijing Municipal Bureau of Quality and Technical Supervision, 2018. Technical Specifications for Valuation of Forest Resource Assets (DB11/T 659-2018), 2018-04-04. (in Chinese)

[4]
Bo Wenjing, Wang Liyan, Cao Jianhua et al., 2017. Valuation of China’s ecological assets in forests. Acta Ecologica Sinica, 37(12): 4182-4190. (in Chinese)

[5]
Chen Pengfei, 2019. Monthly NPP dataset covering China’s terrestrial ecosystems at north of 18°N (1985-2015). Journal of Global Change Data & Discovery, 3(1): 34-41. (in Chinese)

[6]
Costanza R, 2018. How to retool our concept of value. Nature, 556(7701): 300-301.

DOI

[7]
Costanza R, d’Arge R, de Groot R et al., 1997. The value of the world’s ecosystem services and natural capital. Nature, 387(15): 253-260.

DOI

[8]
Costanza R, de Groot R, Braat L et al., 2017. Twenty years of ecosystem services: How far have we come and how far do we still need to go? Ecosystem Services, 28: 1-16.

DOI

[9]
Costanza R, Kubiszewski I, Giovannini E et al., 2014. Development: Time to leave GDP behind. Nature, 505(7483): 283-285.

DOI

[10]
Daily G C, Sderqvist T, Aniyar S et al., 2000. The value of nature and the nature of value. Science, 2000, 289(5478): 395-396.

[11]
Dunn R J H, Alexander L V, Donat M G et al., 2020. Development of an updated global land in-situ-based dataset of temperature and precipitation extremes: HadEX3. Journal of Geophysical Research: Atmospheres, 125(16): doi: 10.1029/2019JD032263.

DOI

[12]
Ehrlich P R, Kareiva P M, Daily G C, 2012. Securing natural capital and expanding equity to rescale civilization. Nature, 486(7401): 68-73.

[13]
Fryrear D W, Saleh A, Bilbro J D, 1998. A single event wind erosion model. Transactions of the ASAE, 41(5): 1369-1374.

DOI

[14]
Fu Bojie, Yu Dandan, Lu Nan et al., 2017. An indicator system for biodiversity and ecosystem services evaluation in China. Acta Ecologica Sinica, 37(2): 341-348. (in Chinese)

[15]
Gao Jixi, 2013. Regional Ecological Assets Evaluation:Theory, Method and Application. Beijing: Science Press, 137-143. (in Chinese)

[16]
Gong Shihan, Xiao Yang, Zheng Hua et al., 2017. Spatial patterns of ecosystem water conservation in China and its impact factors analysis. Acta Ecologica Sinica, 37(7): 2455-2462. (in Chinese)

[17]
Han Guangzhong, Wang Decai, Xie Xianjian et al., 2016. Pedotransfer functions for prediction of soil bulk density for major types of soils in China. Acta Pedologica Sinica, 53(1): 93-102. (in Chinese)

[18]
Han Yongwei, Gao Jixi, Wang Baoliang et al., 2012. Evaluation of soil conservation function and its values in major eco-function areas of Loess Plateau in eastern Gansu Province. Transactions of the Chinese Society of Agricultural Engineering, 28(17): 78-85. (in Chinese)

[19]
Hou Peng, Fu Zhuo, Zhu Hanshou et al., 2020. Progress and perspectives of ecosystem assets management. Acta Ecologica Sinica, 40(24): 8851-8860. (in Chinese)

[20]
Hu Pan, Chen Bo, Shi Peijun, 2021. Spatiotemporal patterns and influencing factors of rainstorm-induced flood disasters in China. Acta Geographica Sinica, 76(5): 1148-1162. (in Chinese)

DOI

[21]
Huang B B, Li R, Ding Z et al., 2020. A new remote-sensing-based indicator for integrating quantity and quality attributes to assess the dynamics of ecosystem assets. Global Ecology and Conservation, 22: doi: 10.1016/j.gecco.2020.e00999.

DOI

[22]
Huang Binbin, Zheng Hua, Xiao Yi et al., 2019. Effectiveness and driving forces of ecological asset protection in national key ecological function regions. Chinese Journal of Environmental Management, 11(3): 14-23. (in Chinese)

[23]
Huang Lin, Cao Wei, Wu Dan et al., 2015. Assessment on the changing conditions of ecosystems in key ecological function zones in China. Chinese Journal of Applied Ecology, 26(9): 2758-2766. (in Chinese)

PMID

[24]
Huang Lin, Zheng Yuhan, Xiao Tong, 2017. Spatial variation pattern of ecological conservation and its zonal suitability at the county level in China. Acta Geographica Sinica, 72(7): 1305-1315. (in Chinese)

DOI

[25]
Jiang Bo, Wang Xiaoyuan, Yang Mengfei et al., 2019. Application of ecosystem services research on a protection effectiveness evaluation of the ecological redline policy. Acta Ecologica Sinica, 39(9): 3365-3371. (in Chinese)

[26]
Jin Kai, Wang Fei, Han Jianqiao et al., 2020. Contribution of climatic change and human activities to vegetation NDVI change over China during 1982-2015. Acta Geographica Sinica, 75(5): 961-974. (in Chinese)

DOI

[27]
Kong Lingqiao, Zhang Lu, Zheng Hua et al., 2018. Driving forces behind ecosystem spatial changes in the Yangtze River Basin. Acta Ecologica Sinica, 38(3): 741-749. (in Chinese)

[28]
Li Chuanhua, Zhu Tongbin, Zhou Min et al., 2021. Temporal and spatial change of net primary productivity of vegetation and its determinants in Hexi Corridor. Acta Ecologica Sinica, 41(5): 1931-1943. (in Chinese)

[29]
Li Ruiqian, Li Yongfu, Hu Heng, 2020. Support of ecosystem services for spatial planning theories and practices. Acta Geographica Sinica, 75(11): 2417-2430. (in Chinese)

DOI

[30]
Liu Huiming, Gao Jixi, Liu Xiao et al., 2020. Monitoring and assessment of the ecosystem services value in the national key ecological function zones. Acta Ecologica Sinica, 40(6): 1865-1876. (in Chinese)

[31]
Liu Yanxu, Fu Bojie, Zhao Wenwu et al., 2018. Ecological asset accounting and ecosystem services evaluation: Concept intersection and key research priorities. Acta Ecologica Sinica, 38(23): 8267-8276. (in Chinese)

[32]
Ouyang Zhiyun, Zhu Chunquan, Yang Guangbin et al., 2013. Gross ecosystem product: Concept, accounting framework and case study. Acta Ecologica Sinica, 33(21): 6747-6761. (in Chinese)

DOI

[33]
Pan Mei, Chen Tianwei, Huang Lin et al., 2020. Spatial and temporal variations in ecosystem services and its driving factors analysis in Jing-Jin-Ji region. Acta Ecologica Sinica, 40(15): 5151-5167. (in Chinese)

[34]
Pan Yaozhong, Shi Peijun, Zhu Wenquan et al., 2004. Quantitative remote sensing on ecological assessment of Chinese terrestrial ecosystem. Science in China Series D: Earth Sciences, 34(4): 375-384. (in Chinese)

[35]
Pema Dolkar, Xiao Yi, Ouyang Zhiyun et al., 2020. Assessment of ecological conservation effect in Xishui county based on gross ecosystem product. Acta Ecologica Sinica, 40(2): 499-509. (in Chinese)

[36]
Song Changsu, Ouyang Zhiyun, 2020. Ecosystem product accounting for ecological benefits assessment: A case study of Qinghai Province. Acta Ecologica Sinica, 40(10): 3207-3217. (in Chinese)

[37]
Song Changsu, Xiao Yi, Bo Wenjing et al., 2019. The ecological asset accounting method study: A case study of Qinghai Province. Acta Ecologica Sinica, 39(1): 9-23. (in Chinese)

DOI

[38]
Wang Jianmin, Wang Rusong, 2001. Introduction to China’s Ecological Assets. Nanjing: Phoenix Science Press. (in Chinese)

[39]
Wessels K J, Prince S D, Malherbe J et al., 2007. Can human-induced land degradation be distinguished from the effects of rainfall variability? A case study in South Africa. Journal of Arid Environments, 68(2): 271-297.

DOI

[40]
Wu Shaohong, Liu Lulu, Liu Yanhua et al., 2018. Geographical patterns and environmental change risks in terrestrial areas of the Belt and Road. Acta Geographica Sinica, 73(7): 1214-1225. (in Chinese)

DOI

[41]
Xie Gaodi, 2017. Ecological asset evaluation: Stock, quality and value. Environmental Protection, 45(11): 18-22. (in Chinese)

[42]
Xie Gaodi, Zhen Lin, Lu Chunxia et al., 2008. Expert knowledge based valuation method of ecosystem services in China. Journal of Natural Resources, (5): 911-919. (in Chinese)

[43]
Yang Xiaojing, Xu Zongxue, Zuo Depeng et al., 2018. Assessment on the risk of agricultural drought disaster in the three provinces of Northeast China. Acta Geographica Sinica, 73(7): 1324-1337. (in Chinese)

DOI

[44]
You Xu, He Dongjin, Xiao Yi et al., 2020. Assessment of eco-assets in a county area: A case of Pingbian County. Acta Ecologica Sinica, 40(15): 5220-5229. (in Chinese)

[45]
Zhang Jie, Liu Yujie, Pan Tao et al., 2020. Ecological profit and loss accounting in the preparation of natural resources balance sheet. Journal of Natural Resources, 35(4): 755-766. (in Chinese)

DOI

[46]
Zhao Tongqian, Ouyang Zhiyun, Zheng Hua et al., 2004. Forest ecosystem services and their valuation in China. Journal of Natural Resources, 19(4): 480-491. (in Chinese)

[47]
Zhu Qing, Zhou Zixiang, Liu Ting et al., 2021. Vegetation restoration and ecosystem soil conservation service value increment in Yanhe Watershed, Loess Plateau. Acta Ecologica Sinica, 41(7): 2557-2570. (in Chinese)

[48]
Zhu Wenquan, Zhang Jinshui, Pan Yaozhong et al., 2007. Measurement and dynamic analysis of ecological capital of terrestrial ecosystem in China. Chinese Journal of Applied Ecology, 18(3): 586-594. (in Chinese)

PMID

Outlines

/