Regular Articles

Spatial characteristics of the stability of mangrove ecosystems in freshwater and seawater floods in Southeast Asia

  • LI Xia , 1, 2 ,
  • LIU Zhenhai , 3, * ,
  • WANG Shaoqiang 3, 4, 5, 6 ,
  • LI Fengting 1 ,
  • LI Hui 3 ,
  • ZHU Tongtong 3 ,
  • QIAN Zhaohui 2 ,
  • TU Yongkai 3 ,
  • LIU Yuanyuan 5, 6 ,
  • WANG Xiaobo 5, 6 ,
  • WANG Qinyi 3 ,
  • SHI Weibo 3 ,
  • LI Donghui 3
Expand
  • 1.College of Environmental Science and Engineering, Tongji University, Shanghai 200092, China
  • 2.Foreign Environmental Cooperation Center, Ministry of Ecology and Environment, Beijing 100035, China
  • 3.Key Laboratory of Regional Ecology and Environmental Change, School of Geography and Information Engineering, China University of Geosciences, Wuhan 430074, China
  • 4.State Key Laboratory of Biogeology and Environmental Geology, China University of Geosciences, Wuhan 430074, China
  • 5.Key Laboratory of Ecosystem Network Observation and Modeling, Institute of Geographic Sciences and Natural Resources Research, CAS, Beijing 100101, China
  • 6.College of Resources and Environment, University of Chinese Academy of Sciences, Beijing 100049, China
*Liu Zhenhai (1996-), PhD Candidate, specialized in ecological remote sensing. E-mail:

Li Xia (1976-), Senior Engineer, specialized in adaptive research on climate change. E-mail:

Received date: 2021-08-02

  Accepted date: 2022-04-02

  Online published: 2022-11-25

Supported by

Scientific Research Foundation of China University of Geosciences(162301192642)

China-ASEAN Marine Life Corridor Construction Cooperation Project(144022000000180031)

Carbon Cycle of Forest Ecosystem in Mufu Mountain(GKZ21Y653)

Abstract

In tropical regions, mangrove forests are located in the inter-tidal areas between land and sea, and are at risk from both freshwater and seawater floods. Using satellite-derived Normalized Difference Vegetation Index (NDVI) products, this study compared the differences in resistance and resilience of mangrove ecosystems to freshwater and seawater floods in Southeast Asia, and analyzed the spatial characteristics of the stability of mangrove ecosystems under floods in representative areas. Results show that mangroves tended to have lower mean resistance (28.24 vs. 37.32) and higher mean resilience (3.74 vs. 3.56) under freshwater floods, compared to seawater floods. Their resistance increased with the distance from rivers, such that the resistance of coastal areas to freshwater and seawater floods was lower than that of inland areas. These areas with lower resistance showed higher resilience compared to those with higher resistance. Damaged mangroves hardly fully recovered to their normal NDVI levels one year after seawater floods, especially in coastal areas. Although the occurrence of seawater floods was relatively rare in the past, it is likely to increase under more-intense climate extremes in the future, and the threat to the survival of mangroves may also increase. Thus, it is essential to evaluate the stability of mangrove ecosystems under floods.

Cite this article

LI Xia , LIU Zhenhai , WANG Shaoqiang , LI Fengting , LI Hui , ZHU Tongtong , QIAN Zhaohui , TU Yongkai , LIU Yuanyuan , WANG Xiaobo , WANG Qinyi , SHI Weibo , LI Donghui . Spatial characteristics of the stability of mangrove ecosystems in freshwater and seawater floods in Southeast Asia[J]. Journal of Geographical Sciences, 2022 , 32(9) : 1831 -1846 . DOI: 10.1007/s11442-022-2025-2

1 Introduction

Flooding is one of the most common, destructive, and costly natural disasters (Liu et al., 2021), and may significantly affect the temporal stability of terrestrial ecosystem functions, such as vegetation respiration (Mommer and Visser, 2005), ecosystem productivity (Fonseca et al., 2019), and land carbon budget (Batson et al., 2015). Coastal wetlands face risks not only from freshwater floods caused by extreme precipitation, but also from seawater floods caused by storm surges (Lambs et al., 2015). A further understanding of the effect of different types of floods on coastal ecosystem functions will facilitate the projections of terrestrial feedback on future climate change with the Earth System Model (Shafroth et al., 2010; Milner et al., 2018).
In tropical and subtropical regions, mangrove forests are located in the inter-tidal areas between land and sea, including river deltas, lagoons, and estuarine complexes (Alongi, 2008; Giri et al., 2011; Valderrama-Landeros et al., 2019). Their total area accounts for 0.7% of the world’s total area of tropical forest. The largest proportion of mangrove areas in the world is located in Asia (42%) (Giri et al., 2011). As a blue carbon ecosystem, mangrove forests have excellent potential in sequestrating atmospheric carbon dioxide (Liu and Lai, 2019; Macreadie et al., 2021). However, due to global warming and increasing climate extremes, the stability and the carbon budget balance of mangroves may be hampered (Alongi, 2008).
Mangrove forests are the first line of defense against floods, reducing waves and storm surges (Lambs et al., 2015; Menéndez et al., 2020). The majority of previous studies focused on the value of mangroves as a natural coastal defense at both global and local scale (Brander et al., 2012; Deb and Ferreira, 2017; Worthington et al., 2020). Some of these studies highlighted the impact of floods on the stability of mangrove ecosystems (Ball, 1998; Barr et al., 2012). Increased precipitation and intense flooding impact mangroves through habitat erosion, salinity change, or smothering by catchment-derived sediment (Adams and Rajkaran, 2021), whereby the inundation of lenticels in the aerial roots will lead to a decrease in oxygen concentrations, thus resulting in mangroves death (Ellison, 2010). Floods may also reduce the water diversion and photosynthesis capabilities of mangrove leaves (Mangora et al., 2014). Sediment suffocation of aerial roots will inhibit oxygen exchange, enhance root hypoxia, and ultimately kill the trees (Adams and Rajkaran, 2021). However, existing studies rarely quantified the temporal stability of mangrove ecosystems under floods at regional scales. Satellite-derived Normalized Difference Vegetation Index (NDVI), as a proxy of vegetation greenness, offers the opportunity to characterize vagetation functioning dynamics at regional scales (Li et al., 2006a; 2006b). The effects of floods on the temporal stability of mangrove ecosystems may be generally described by resistance (i.e., their ability to maintain the original levels of NDVI during floods) and resilience (i.e. the rate of NDVI recovering to pre-flood levels) (Huang and Xia, 2019).
The magnitude and frequency of coastal floods are anticipated to vary both temporally and spatially with the increased intensity of extreme precipitation events, abnormal storm surges, and enhanced meteorological tides due to the global warming-induced intensification of the hydrologic cycle (Visser et al., 2014; Winsemius et al., 2016; Bevacqua et al., 2020; Tabari, 2020; Liu et al., 2021). As a frequent tropical cyclone landfall region, Southeast Asia has often been hit by floods (Giri et al., 2015; Ahamed and Bolten, 2017; Chen et al., 2020). For example, the Indian Ocean tsunami in 2004 destroyed the marine and terrestrial environment in coastal areas, entailing extensive coastal erosion and long-term impacts on coastal ecosystems (Zhang et al., 2009; Syamsidik et al., 2021). Furthermore, projections under future emission scenarios based on climate models demonstrate that the scale and frequency of floods in Southeast Asia will increase greatly (Hirabayashi et al., 2013; Record et al., 2013; Arnell and Gosling, 2016).
When extreme flooding events occur, the availability of satellite-derived vegetation indices data enables the measurement of vegetation spatial-temporal dynamics. This study aimed to compare the differences in mangrove ecosystem stability under freshwater and seawater floods in Southeast Asia. Using NDVI data for the period 2000-2019, the temporal stability (including resistance and resilience) of mangroves under freshwater and seawater floods was investigated. Moreover, this study also analyzed the spatial-temporal characteristics of the cause, severity, and duration of floods in Southeast Asia over the period 1985-2019, based on the flood events database of the Dartmouth Flood Observatory.

2 Materials and methods

The spatial characteristics of the stability of mangroves in Southeast Asia under severe freshwater and seawater floods were investigated using the 250-m Moderate Resolution Imaging Spectroradiometer (MODIS) NDVI and the Dartmouth Flood Observatory Global Active Archive of Large Flood Events (DFO,http://floodobservatory.colorado.edu) database. The overall approach followed was articulated along three stages: (1) generation of high-quality daily NDVI composites based on pixel-level quality assurance (QA) layers; (2) extraction of the spatial range, cause, date, and duration of coastal flood events from the DFO database; and (3) calculation and analysis of the resistance and resilience of mangrove ecosystems to floods. An overview of the methods employed to investigate the spatial characteristics of the stability of mangroves to floods is shown in Figure 1.
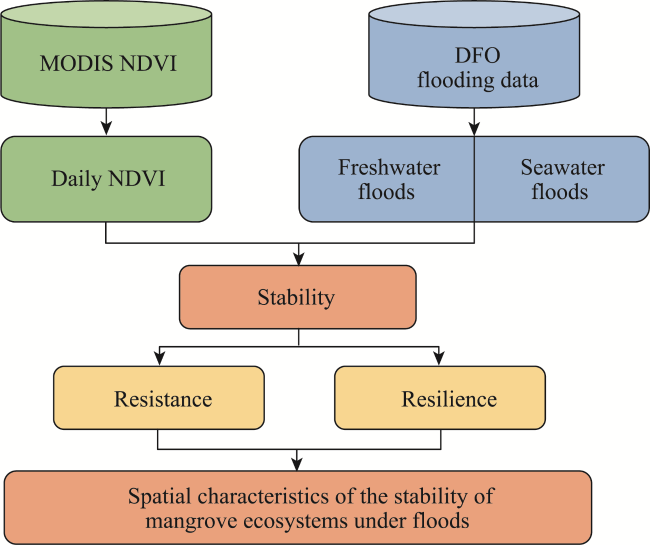
Figure 1 Overview of the methodology employed to calculate the stability of mangrove forests to floods

2.1 Study area

Southeast Asia hosts the largest extension of mangroves on Earth, corresponding to 35% of the total global mangrove area (Giesen et al., 2006). The largest coverage is located along the coasts of Indonesia (59.8% of all Southeast Asian mangroves), Malaysia (11.7%) and Myanmar (8.8%) (Giesen et al., 2006). However, from 1980 to 2020, Southeast Asia lost about 33% of their mangroves, corresponding to more than 63,000 km2, and only around 43,000 km2 of mangrove forests currently remain (Savi, 2020).

2.2 Mangrove map

The mangrove map of Southeast Asia was extracted from the 10-m global baseline of mangrove extent for 2010, which is the first data output of the Global Mangrove Watch (GMW) initiative (Bunting et al., 2018). The methodology used to map the mangroves was primarily based on the classification of the Advanced Land Observing Satellite-1 (ALOS) Phased Array type L-band Synthetic Aperture Radar (PALSAR) and Landsat sensor data. Its overall accuracy to determine mangrove extent was 94.0% (Bunting et al., 2018). According to the extracted mangrove map, mangrove forests in Southeast Asia were calculated to cover 43,937.45 km2.

2.3 NDVI data

NDVI has been widely used for the analysis of mangrove changes (Goldberg et al., 2020) and responses to ecosystem disturbance, such as floods (Powell et al., 2014; Rahman et al., 2021), droughts (Khoury and Coomes, 2020), and hurricanes (Zhang et al., 2016). The NDVI values represent a normalized ratio of reflected visible and near-infrared energy, as expressed by the following equation (Li et al., 2006):
$\begin{matrix} NDVI=\left( {{\rho }_{Nir}}-{{\rho }_{Red}} \right)/\left( {{\rho }_{Nir}}+{{\rho }_{Red}} \right) \\ \end{matrix}$
where ${{\rho }_{Nir}}$ and ${{\rho }_{Red}}$ indicate the reflectance of the near-infrared (841–876 nm) and red (620–670 nm) bands, respectively.
The Landsat remote sensing dataset with a 16-days acquisition frequency is not suited for studying the response of mangroves to floods, because the flooding events are temporary and last for a shorter time or even a few days. For this study, MOD09GQ (daily surface reflectance at 250-m resolution of MODIS TERRA) was used to generate the NDVI data. This product is provided in two channels, one in the visible range, between 620 and 670 nm (Band 1), and one in the near-infrared, between 841 and 876 nm (Band 2). Since the tiles of MOD09GQ covering coastal lands include the adjacent coastal waters, this product is appropriate to investigate mangrove change under the influence of coastal floods (Moreno-Madriñán et al., 2015).
The MOD09GQ vegetation product contains per-pixel QA data that contain information on the overall usefulness, and the pixel reliability is on a per-pixel basis. Furthermore, QA contains per-pixel quality flags relating to cloud state, cloud shadow, aerosol quantity, and basic land cover characteristics, such as land/water, snow, and fire flags. In our study, high-quality and cloud-free pixels were extracted (the QA number was 4096 in integer) based on the QA layers. Gaps remaining after QA filtering were filled by interpolation between the two adjacent points in the temporal dimension. The time series with more than two consecutive gaps were filled based on the MODIS NDVI products (MOD13A2).

2.4 The flooding data

The DFO database was used to represent the spatiotemporal distribution of floods in Southeast Asia in the period 2000-2019. News reports and orbital remote sensing were the basis for measuring and mapping flood events (Kundzewicz et al., 2013). Basic information on each “large” flood event is documented in the DFO, including location, time, duration, affected area, flood magnitude, and main causes (Chen et al., 2020). Depending on their main cause, floods are classified as either freshwater floods or seawater floods. If a flood is caused by a typhoon, tsunami, tidal surge, or high tides, it is classified as a seawater flood. Floods caused by monsoonal rain, heavy rain, torrential rain, brief torrential rain, tropical cyclone, or tropical storm are considered as a freshwater floods. If a pixel in the mangrove distribution area is covered by a flood layer in the DFO, it means that that pixel has been inundated by the corresponding flood.

2.5 Definition of ecosystem stability

The impact of freshwater and seawater floods on the temporal stability of mangrove ecosystems may generally be described by the degree of resistance and resilience of NDVI (Vogt et al., 2012; Osland et al., 2015); in fact, these stability components consider concurrent and delayed impacts of floods on mangrove ecosystems (Isbell et al., 2015). Resistance quantifies the direct (concurrent) impact of floods on NDVI, and expresses the capacity to maintain its original levels during floods. Resilience is defined as the rate of NDVI recovering to its normal state after floods (Huang and Xia, 2019). Experimental and modeling studies analyzed those two stability components from species to biome level (Osland et al., 2015). Similar to the calculation method used by Isbell et al. (2015), the resistance (Ω) was calculated as follows:
$\begin{matrix} \Omega \equiv \frac{{{{\bar{Y}}}_{n}}}{\left| {{Y}_{e}}-{{{\bar{Y}}}_{n}} \right|} \\ \end{matrix}$
While the resilience (Δ) was calculated as follows:
$\begin{matrix} \Delta \equiv \left| \frac{{{Y}_{e}}-{{{\bar{Y}}}_{n}}}{{{Y}_{e+1}}-{{{\bar{Y}}}_{n}}} \right| \\ \end{matrix}$
where Ye, Ye+1, and ${{\bar{Y}}_{n}}$ represent the expected average NDVI during an 8-day window after the occurrence of a flood, during the same window in the following year, and during a normal period of the same window (mean value of all non-flooding years), respectively. If the NDVI is reduced to half its normal level during a flood, then Ω=2. In the year following a climate event, if the NDVI recovers either from 50% to 75% or from 50% to 125% of normal NDVI levels, then it was considered as having recovered halfway from perturbed to normal levels, and Δ=2.

3 Results

3.1 Flood events pattern

The DFO database holds flooding records for about 43.30% of mangrove areas in Southeast Asia during the period 1985-2019 (Figure 2a). The frequency of floods shows great spatial heterogeneity. Floods mainly occurred on the eastern coast of the Philippine Islands and on the western part of the Malay Peninsula. In contrast, the eastern coastal area of the Indo-China Peninsula, the western Pulau Sumatra, and the New Guinea Island have fewer flooding records (Figure 2a).
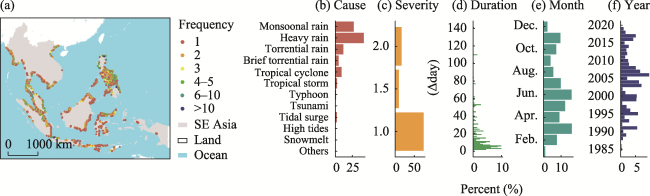
Figure 2 Statistical data on flooding events in Southeast Asia mangrove areas from 1985 to 2019 based on DFO data. (a) Spatial frequency distribution. The value of the dots represents the frequency of the flooding events at one pixel scale. Distribution of (b) main cause, (c) severity, (d) duration, (e) occurring month, and (f) year of the flooding events. The x-axis of (b-f) represents the percentage of flood events affecting mangrove areas.
The most critical factors causing extreme floods were monsoonal rains and heavy rains, causing 69.09% of all floods impacting on mangrove areas (Figure 2b). Mangroves affected by seawater floods accounted for 3.12% of all floods. DFO data showed that only seven seawater flooding events occurred in the study area during the period 1985-2019, namely three typhoons, two tsunamis, one tide surge, and one high tide. The majority of the floods occurred had low severity (Figure 2c) and short duration (Figure 2d). The floods with level-1 severity and those lasting less than 10 days accounted for 74.24% and 55.36% of the total number of floods, respectively. Floods with level-2 severity accounted for 16.63% of all floods (Figure 2c). The longest flood duration recorded in Southeast Asia was 141 days (Figure 2d). The annual distribution of flood events presented clear seasonality, with the majority of floods (62.99%) occurring from March to July (Figure 2e). The period 2003-2008 was a flood-rich period with a greater number of flood events, while the period 2009-2015 was a flood-poor period (Figure 2f). Between 1985 and 2019, 35.94% of floods occurred in the period 2003-2008, and 14.57% of floods occurred in the period 2009-2015.

3.2 Regional characteristics of NDVI and stability

During the period investigated, the NDVI values ranged from 0.30 to 0.75 (Figure 3). The northern part of the island of Borneo, the western part of New Guinea Island, and the Peninsular (Semenanjung) Malaysia recorded the higher NDVI values. The lowest NDVI values were calculated for the estuary regions of the Mekong River, the Red River, and the Irrawaddy River.
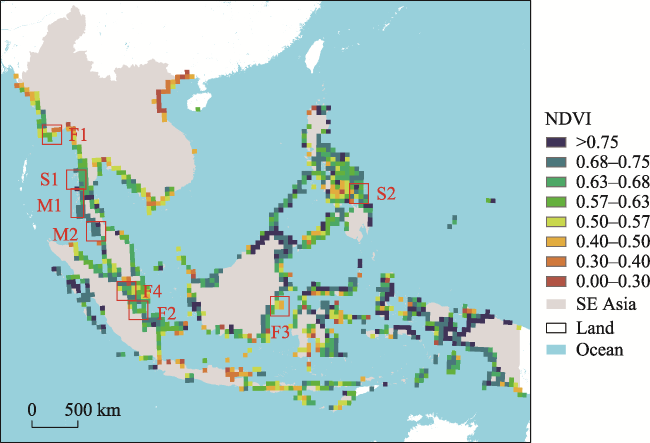
Figure 3 Spatial distribution of mean NDVI values from 2000 to 2019 in mangrove regions of Southeast Asia

Note: To show the spatial distribution of NDVI across Southeast Asia, the pixel resolution was interpolated to 50 km. The pixel values represent the average NDVI of mangroves within that pixel. The red boxes and mark numbers represent the location and range of selected representative regions, respectively.

The numerical stability pattern of NDVI for freshwater and seawater floods in Southeast Asia is shown in Figure 4. Overall, the resistance and resilience of mangroves to freshwater and seawater floods showed similar numerical distribution patterns. The resistance of NDVI to freshwater floods ranged from 0.0013 to 981.66 (Figure 4a), while that to seawater floods ranged from 0.0013 to 988.97 (Figure 4b). The resilience of NDVI to freshwater floods ranged from 0.0021 to 920.76, while that to seawater floods ranged from 0.0014 to 643.45. The mean value of the resistance of NDVI to freshwater floods was 28.24, and that to seawater floods was 37.32. The mean value of the resilience of NDVI to freshwater floods was 3.74, and that to seawater floods was 3.56. Compared to seawater floods, freshwater floods often caused greater general damage to mangroves in Southeast Asia.
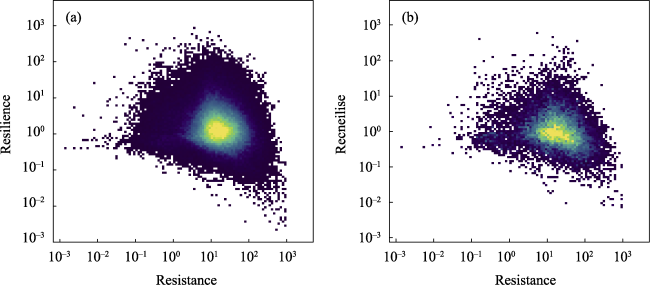
Figure 4 Resistance and resilience of NDVI to (a) freshwater floods and (b) seawater floods during 2000-2016

Note: The colors represent the intensity of scattering points. The brighter the color, the higher the number of the points in the same coordinate range.

There is a tripolarization between resistance and resilience (Figure 4). First, when mangroves were damaged extremely and hardly restored, their resistance tended to 0 and their resilience tended to 1. Second, when mangroves were damaged slightly and were unrecoverable, their resistance tended to 1000 and their resilience tended to 0. Third, when mangroves suffered general damage and achieved a good recovery, their resistance tended to 10 and their resilience tended to 1000.

3.3 Spatial characteristics of stability in representative areas

The stability maps of four representative areas affected by freshwater floods are shown in Figure 5 and Figure 6. Mangroves in estuaries were easily affected by freshwater floods. Moreover, mangroves closest to the estuaries usually had the lowest resistance, which increased with the distance from rivers, making inland areas more resistant to freshwater floods than rivers and coastal areas (Figures 5a and 5b). Estuary alluvial fans are flat and can easily be inundated during severe floods. A higher proportion of mangroves had a lower resistance to freshwater floods, especially in marginal areas (Figure 5c, where the level of severity of the selected flooding event was 2, and the level of its duration was 4). Short and intense rainfalls often resulted in rising water levels of narrow rivers, thus flooding mangroves along rivers and causing great damage to mangroves in inland areas (Figure 5d, where the level of severity of the selected flooding event was 2, and the level its duration was 4).
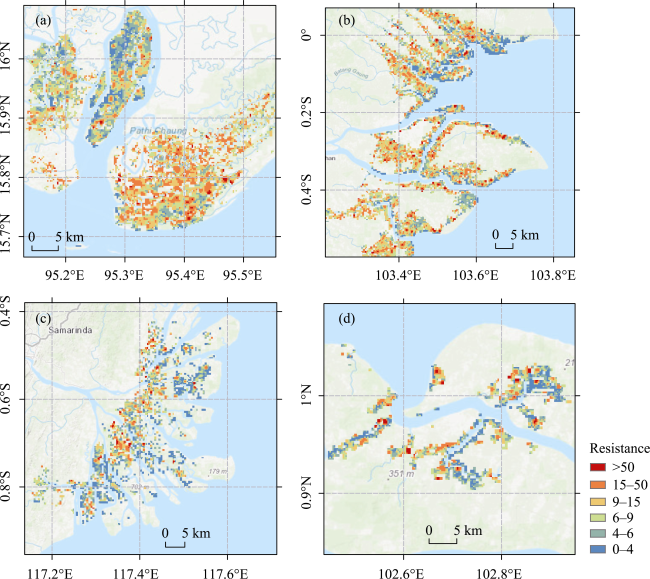
Figure 5 Spatial distribution of resistance of NDVI to freshwater floods in four representative areas

Note: The location of the selected representative areas is shown in Figure 3 (a: F1; b: F2; c: F3; d: F4).

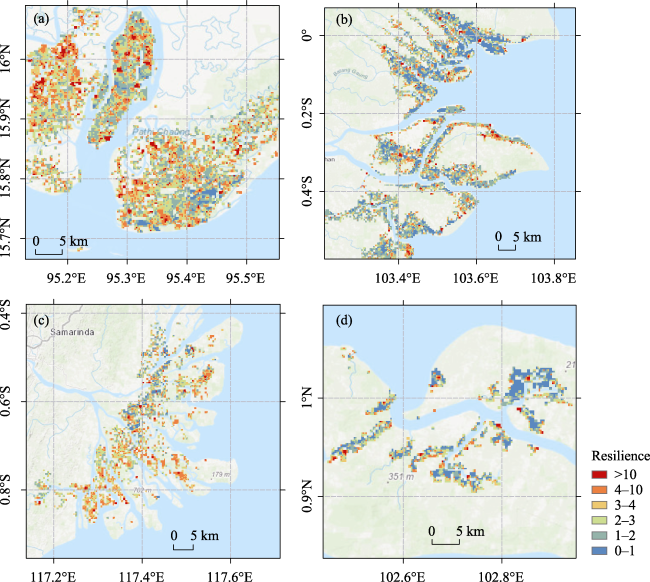
Figure 6 Spatial distribution of the resilience of NDVI to freshwater floods in four representative areas

Note: The location of the selected representative areas is shown in Figure 3 (a: F1; b: F2; c: F3; d: F4).

In the selected areas, NDVI showed no clear spatial distribution pattern in relation to resilience to freshwater floods (Figure 6). However, at the regional scale, the resilience of mangroves showed a zoning pattern (Figures 6a and 6b), whereby mangroves in adjacent areas had similar resilience. The possible reasons for this aggregated distribution are the varying flood intensity and duration, and the varying height and tolerance of mangroves to local freshwater floods. The rise in seawater level caused by floods permanently inundated mangroves in alluvial fans, where extensive mangroves had low resilience (Figure 6c). Damaged mangroves farther away from rivers could recover better after flooding, as these areas suffered inundation for a shorter period (Figure 6d).
The spatial distribution patterns of stability in the two representative areas affected by seawater floods are shown in Figures 7 and 8. Compared to the impact reach of freshwater floods, only the mangroves around the seashore or the wide estuaries were affected by seawater floods, according to the DFO database (Figure 7). Coastal mangroves have been most directly and strongly affected by the tsunami. At the same time, seawater floods affected mangroves in inland areas along rivers in some areas (Figure 7a). Inland mangroves would be invaded when high-intensity tsunamis will occur (Figure 7a, where the selected flooding event was caused by the Indian Ocean tsunami in 2004). Although inland mangroves suffered from floods, they had a higher resistance than coastal mangroves. Topographic factors can also affect the stability of mangroves, such as bays that reduce the direct impact of seawater floods on mangroves (Figure 7b). Especially in the case of weak floods, the damage was minimal (the level of severity of the selected flooding event in Figure 7b was 1).
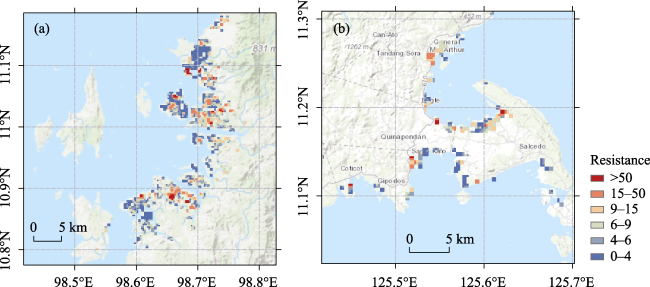
Figure 7 Spatial distribution of resistance of NDVI to seawater floods in two representative areas

Note: The location of the selected representative areas is shown in Figure 3 (a: S1; b: S2).

Damaged mangroves did not fully recover to their normal levels even one year after the seawater flooding events in selected areas, especially in the coastal areas (Figure 8). Inland areas had higher resilience than coastal areas, as they were less affected by seawater floods (Figure 8a). Similar to the spatial characteristics of the resilience of mangroves after freshwater floods, the resilience of mangroves after seawater floods also showed strong zoning characteristics (Figure 8).
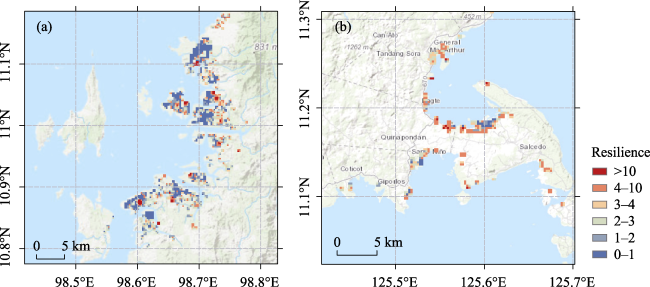
Figure 8 Spatial distribution of the resilience of NDVI to seawater floods in two representative areas

Note: The location of the selected representative areas is shown in Figure 3 (a: S1; b: S2).

3.4 Different responses of the same mangroves to floods

Detailed maps of the stability of mangroves in freshwater and seawater floods in two selected mangrove areas in Southeast Asia were drawn, one for the southwestern coast of Ranong, Thailand, and the other for the western coast of Satun, Thailand (Table 1). Both areas have experienced freshwater and seawater floods in different years. The selected seawater flooding event was caused by the well-known 2004 Indian Ocean tsunami. This unprecedented natural disaster has resulted in massive damage to the marine and terrestrial environments along the coastal zones (Zhang et al., 2009).
Table 1 Information on the selected representative flooding events
Region Flood type Time Main cause Severity Duration Mean resistance Mean resilience
M1 Freshwater 2017/11/25 Heavy rain 1 22 8.83 4.51
Seawater 2004/12/26 Tidal surge 2 3 17.22 3.14
M2 Freshwater 2009/11/25 Monsoonal rain 1 1 23.01 3.53
Seawater 2004/12/26 Tidal surge 2 3 29.68 2.15

Note: The location of the selected representative areas is shown in Figure 3.

Mangroves in southwestern Ranong, Thailand suffered a freshwater flood in 2017 and a seawater flood in 2004 (Figure 9 and Table 1). The freshwater flood, caused by heavy rain, lasted for 22 days and had a severity level of 1, while the seawater flood, caused by tidal surge, lasted for 3 days and had a severity level of 2 (Table 1). The mean resistance of mangroves to freshwater floods (8.83) was lower than that of seawater floods (17.22) in this region. Losses caused by freshwater floods in this region were more serious than those caused by seawater floods, especially in coastal areas (Figures 9a, 9b, and 9e). Inland mangroves were more resistant to freshwater and seawater floods than coastal mangroves. The mean resilience (4.51) of mangroves to freshwater floods in this region was greater than that of seawater floods (3.14; Table 1). After experiencing a more severe freshwater flood, a large proportion of mangroves had higher resilience (Figure 9f). The resistance to freshwater and seawater floods showed no clear spatial distribution characteristics (Figures 9c and 9d).
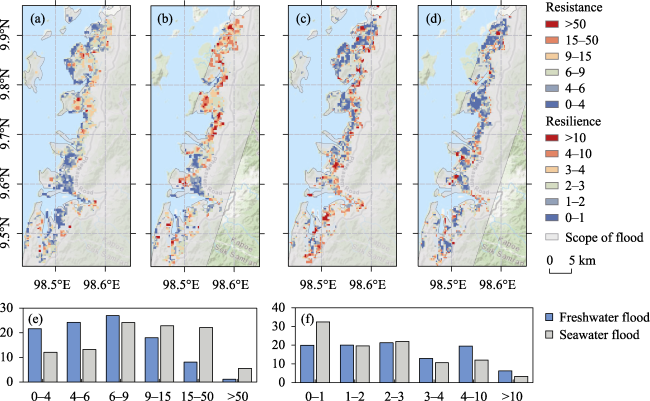
Figure 9 Stability of mangroves affected by floods in southwestern Ranong, Thailand

ote: (a) and (b) represent the resistance of NDVI to freshwater and seawater floods, respectively. (c) and (d) represent the resilience of NDVI to freshwater and seawater floods, respectively. (e) and (f) represent the percentage distribution of each interval of resistance and resilience, respectively. General information on these floods can be found in Table 1, Region M1.

Mangroves in west Satun, Thailand suffered a freshwater flood in 2007 and a seawater flood in 2004 (Figure 10 and Table 1). The freshwater flood, caused by monsoonal rain, lasted for 1 day and had a severity level of 1, while the seawater flood, caused by tidal surge, lasted for 3 days and had a severity level of 2 (Table 1). In this region, the mean resistance and resilience of mangroves to freshwater and seawater floods were roughly equal (Table 1). The mean resistance to freshwater flood was 23.01 and that to seawater flood was 29.68. The mean resilience to freshwater flood was 3.53 and that to seawater flood was 2.15. However, these two stability indices showed different spatial distribution patterns (Figure 10). The resistance of coastal areas to freshwater floods was lower than that of inland areas (Figure 10a). Moreover, these areas with a lower resistance showed higher resilience compared to those with higher resistance (Figure 10c). Seawater floods affected inland mangroves along rivers, resulting in low resistance of inland mangroves (Figure 10b). A large part of areas exposed to seawater floods showed low resilience, without clear spatial distribution characteristics (Figures 10d and 10f).
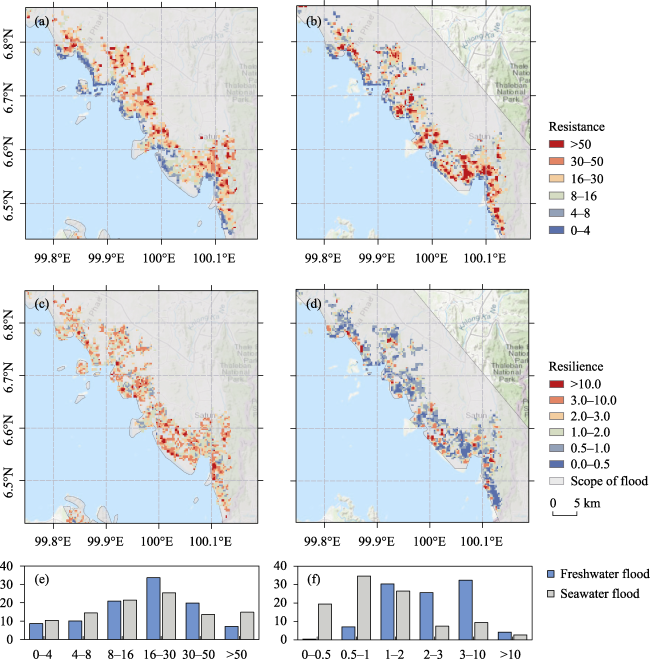
Figure 10 Stability of mangroves exposed to floods in southwestern Satun, Thailand

Note: (a) and (b) represent the resistance of NDVI to freshwater and seawater floods, respectively. (c) and (d) represent the resilience of NDVI to freshwater and seawater floods, respectively. (e) and (f) represent the percentage distribution of each interval of resistance and resilience, respectively. General information on these floods can be found in Table 1, Region M2.

4 Discussion

Freshwater floods move to the sea with the increase of runoff due to extreme precipitation, therefore the salinity is low. The extent of flood damage depends on the runoff, the duration of the flood, and the adaptability of mangrove species to freshwater floods. For inland mangroves, the damage degree mainly depends on rainfall. An increase in freshwater flood intensity may erode the riverbanks, and even completely remove mangroves (Figure 6) (Adams and Rajkaran, 2021). For mangroves around the coast, the damage degree is controlled by the water level. Rising water levels caused by freshwater floods will prevent water from sinking, and make mangroves in coastal areas suffer from prolonged water-logging conditions, resulting in widespread mangrove suffocation (Figures 9 and 10). After heavy rainfall, large amounts of fresh water will dilute mangrove groundwater, resulting in a decrease in groundwater salinity (Lambs et al., 2015). Salinity reduction will promote the growth and productivity of some mangrove species (Burchett et al., 1984; Drexler and Ewel, 2001). Mangrove ecosystems tend to have higher mean resilience after the invasion of freshwater floods (Table 1). Because of the different adaptability of species to freshwater floods, inland mangroves may be more adaptable to freshwater hydrology conditions than coastal areas.
Seawater floods move to land under the pushing action of tsunamis or tides, therefore the salinity is higher than for freshwater floods, and the damage to mangroves will gradually decrease from the coast to inland, together with the decrease in intensity of the pushing effects. Seawater floods with low severity only affect coastal mangroves (Figure 7b). Seawater floods with high severity can affect inland mangroves, although the affected areas are mainly distributed along rivers. (Figure 7a). Mangroves suffering from seawater floods often have low resilience and can not recover to the normal NDVI level within one year (Figures 7 and 8). Photosynthesis and survival rates decline with increasing salinity and submergence time (Ellison, 2000; 2010). In addition, the tsunami may wash away the sediments and slow down the recovery of damaged mangroves (Valderrama-Landeros et al., 2019). Although mangroves are thought to be resistant to seawater floods and protect inland areas, they can also be damaged by flooding.
Climatic variability (e.g., changes in rainfall and in the frequency and intensity of cyclone storms) can aggravate the factors affecting the response of mangrove forests to seawater level, because they can affect the inflow of freshwater, the input of sediment and nutrient, and the salinity of mangrove forests. Storm surges can inundate or even destroy mangroves, when combined with sea-level rise. Prolonged water-logging conditions normally result in an accumulation of soil phytotoxins such as sulfide, reduced iron and manganese, organic acids, and gases (Ingold and Havill, 1984; Mendelssohn and McKee, 1988). Climate change predictions show that the intensity and frequency of seasonal ocean storms will increase, accompanied by the increase of heat and moisture (Watinee and Netnapid, 2013; Ward et al., 2016; Adams and Rajkaran, 2021). Floods caused by increased precipitation, storms or relative sea-level rise may lead to decreased productivity, photosynthesis, and survival (Ellison, 2000). Evaluation of the stability of mangrove ecosystems in floods will help assess the value of future ecosystem services and carbon sequestration of mangroves (Barr et al., 2013; Record et al., 2013; Wang et al., 2019).

5 Conclusions

Based on the consolidated DFO flood events database and on the sensing vegetation index NDVI, this study analyzed the integral and spatial characteristics of the stability of mangrove ecosystems in freshwater and seawater floods in Southeast Asia. The major conclusions are drawn as follows:
(1) The flood frequency in Southeast Asia mangrove areas showed heterogeneity in spatial and temporal distribution, and the occurrence of freshwater floods was more frequent than that of seawater floods.
(2) Mangroves showed a lower resistance of NDVI, and a higher resilience of NDVI after experiencing freshwater floods, compared to seawater floods.
(3) The resistance of mangrove NDVI to floods increased with distance from rivers, making coastal mangroves less resistant than inland mangroves to both freshwater and seawater floods. These mangroves with lower resistance of NDVI showed higher resilience of NDVI, compared to those with higher resistance of NDVI.
[1]
Adams J B, Rajkaran A, 2021. Changes in mangroves at their southernmost African distribution limit. Estuarine, Coastal and Shelf Science, 248: 107158.

[2]
Ahamed A, Bolten J D, 2017. A MODIS-based automated flood monitoring system for Southeast Asia. International Journal of Applied Earth Observation and Geoinformation, 61: 104-117.

DOI

[3]
Alongi D M, 2008. Mangrove forests: Resilience, protection from tsunamis, and responses to global climate change. Estuarine, Coastal and Shelf Science, 76(1): 1-13.

[4]
Arnell N W, Gosling S N, 2016. The impacts of climate change on river flood risk at the global scale. Climatic Change, 134(3): 387-401.

DOI

[5]
Ball M C, 1998. Mangrove species richness in relation to salinity and waterlogging: A case study along the Adelaide River flood plain, northern Australia. Global Ecology and Biogeography, 7: 73-82.

[6]
Barr J G, Engel V, Fuentes J D et al., 2013. Modeling light use efficiency in a subtropical mangrove forest equipped with CO2 eddy covariance. Biogeosciences, 10(3): 2145-2158.

DOI

[7]
Barr J G, Engel V, Smith T J et al., 2012. Hurricane disturbance and recovery of energy balance, CO2 fluxes and canopy structure in a mangrove forest of the Florida Everglades. Agricultural and Forest Meteorology, 153: 54-66.

DOI

[8]
Batson J, Noe G B, Hupp C R et al., 2015. Soil greenhouse gas emissions and carbon budgeting in a short-hydroperiod floodplain wetland. Journal of Geophysical Research: Biogeosciences, 120(1): 77-95.

[9]
Bevacqua E, Vousdoukas M I, Zappa G et al., 2020. More meteorological events that drive compound coastal flooding are projected under climate change. Communications Earth & Environment, 1: 47.

[10]
Brander L, Wagtendonk A, Hussain S et al., 2012. Ecosystem service values for mangroves in Southeast Asia: A meta-analysis and value transfer application. Ecosystem Services, 1(1): 62-69.

DOI

[11]
Bunting P, Rosenqvist A, Lucas R et al., 2018. The global mangrove watch: A new 2010 global baseline of mangrove extent. Remote Sensing, 10(10): 1669.

DOI

[12]
Burchett M D, Meredith S, Pulkownick A et al., 1984. Short term influences affecting growth and distribution of mangrove communities in the Sydney region. Wetlands, 4: 63-72.

[13]
Chen A F, Giese M, Chen D L, 2020. Flood impact on Mainland Southeast Asia between 1985 and 2018: The role of tropical cyclones. Journal of Flood Risk Management, 13(2): e12598.

[14]
Deb M, Ferreira C M, 2017. Potential impacts of the Sunderban mangrove degradation on future coastal flooding in Bangladesh. Journal of Hydro-Environment Research, 17: 30-46.

DOI

[15]
Drexler J Z, Ewel K C, 2001. Effect of the 1997-1998 ENSO-related drought on hydrology and salinity in a micronesian wetland complex. Estuaries, 24(3): 347-356.

DOI

[16]
Ellison J C, 2000. How South Pacific mangroves may respond to predicted climate change and sea level rise. In: Climate Change in the South Pacific:Impacts and Responses in Australia, New Zealand, and Small Island States (Vol. 2). Dordrecht: Springer.

[17]
Ellison J C, 2010. Vulnerability of Fiji’s mangroves and associated coral reefs to climate change. A review. Suva, Fiji: WWF South Pacific Office.

[18]
Fonseca L D M, Dalagnol R, Malhi Y et al., 2019. Phenology and seasonal ecosystem productivity in an Amazonian floodplain forest. Remote Sensing, 11(13): 1530.

DOI

[19]
Giesen W, Wulffraat S, Zieren M et al., 2006. Mangrove Guidebook for Southeast Asia. Bangkok: Food and Agriculture Organization and Wetlands International.

[20]
Giri C, Long J, Abbas S et al., 2015. Distribution and dynamics of mangrove forests of South Asia. Journal of Environmental Management, 148: 101-111.

DOI PMID

[21]
Giri C, Ochieng E, Tieszen L L et al., 2011. Status and distribution of mangrove forests of the world using earth observation satellite data. Global Ecology and Biogeography, 20(1): 154-159.

DOI

[22]
Goldberg L, Lagomasino D, Thomas N et al., 2020. Global declines in human-driven mangrove loss. Global Change Biology, 26(10): 5844-5855.

DOI

[23]
Hirabayashi Y, Mahendran R, Koirala S et al., 2013. Global flood risk under climate change. Nature Climate Change, 3(9): 816-821.

DOI

[24]
Huang K, Xia J Y, 2019. High ecosystem stability of evergreen broadleaf forests under severe droughts. Global Change Biology, 25(10): 3494-3503.

DOI PMID

[25]
Ingold A, Havill D C, 1984. The influence of sulphide on the distribution of higher plants in salt marshes. The Journal of Ecology, 72(3): 1043.

DOI

[26]
Isbell F, Craven D, Connolly J et al., 2015. Biodiversity increases the resistance of ecosystem productivity to climate extremes. Nature, 526(7574): 574-577.

DOI

[27]
Khoury S, Coomes D A, 2020. Resilience of Spanish forests to recent droughts and climate change. Global Change Biology, 26: 7079-7098.

DOI

[28]
Kundzewicz Z W, Pińskwar I, Brakenridge G R, 2013. Large floods in Europe, 1985-2009. Hydrological Sciences Journal, 58(1): 1-7.

DOI

[29]
Lambs L, Bompy F, Imbert D et al., 2015. Seawater and freshwater circulations through coastal forested wetlands on a Caribbean Island. Water, 7(8): 4108-4128.

DOI

[30]
Li X, Guan K Y, Wang S G, 2006a. Mangrove wetland changes in the Pearl River Estuary using remote sensing. Acta Geographica Sinica, 61(1): 26-34. (in Chinese)

[31]
Li X, Yeh A, Liu K et al., 2006b. Inventory of mangrove wetlands in the Pearl River Estuary of China using remote sensing. Journal of Geographical Sciences, 16(2): 155-164.

DOI

[32]
Liu J G, Lai D Y F, 2019. Subtropical mangrove wetland is a stronger carbon dioxide sink in the dry than wet seasons. Agricultural and Forest Meteorology, 278: 107644.

DOI

[33]
Liu W B, Yang T, Sun F B et al., 2021. Observation-constrained projection of global flood magnitudes with anthropogenic warming. Water Resources Research, 57(3): e2020WR028830.

[34]
Macreadie P I, Costa M D P, Atwood T B et al., 2021. Blue carbon as a natural climate solution. Nature Reviews Earth & Environment, 2(12): 826-839.

[35]
Mangora M M, Mtolera M S P, Björk M, 2014. Photosynthetic responses to submergence in mangrove seedlings. Marine and Freshwater Research, 65(6): 497-504.

DOI

[36]
Mendelssohn I A, McKee K L, 1988. Spartina alterniflora die-back in Louisiana: Time-course investigation of soil waterlogging effects. Journal of Ecology, 76(2): 509-521.

DOI

[37]
Menéndez P, Losada I J, Torres-Ortega S et al., 2020. The global flood protection benefits of mangroves. Scientific Reports, 10(1): 4404.

DOI PMID

[38]
Milner A M, Picken J L, Klaar M J et al., 2018. River ecosystem resilience to extreme flood events. Ecology and Evolution, 8(16): 8354-8363.

DOI PMID

[39]
Mommer L, Visser E J W, 2005. Underwater photosynthesis in flooded terrestrial plants: A matter of leaf plasticity. Annals of Botany, 96(4): 581-589.

DOI PMID

[40]
Moreno-Madriñán M J, Rickman D L, Ogashawara I et al., 2015. Using remote sensing to monitor the influence of river discharge on watershed outlets and adjacent coral reefs: Magdalena River and Rosario Islands, Colombia. International Journal of Applied Earth Observation and Geoinformation, 38: 204-215.

DOI

[41]
Osland M J, Day R H, From A S et al., 2015. Life stage influences the resistance and resilience of black mangrove forests to winter climate extremes. Ecosphere, 6(9): 160.

[42]
Powell S J, Jakeman A, Croke B, 2014. Can NDVI response indicate the effective flood extent in macrophyte dominated floodplain wetlands? Ecological Indicators, 45: 486-493.

DOI

[43]
Rahman M S, Di L, Yu E et al., 2021. Remote sensing based rapid assessment of flood crop damage using novel Disaster Vegetation Damage Index (DVDI). International Journal of Disaster Risk Science, 12: 90-110.

DOI

[44]
Record S, Charney N D, Zakaria R M et al., 2013. Projecting global mangrove species and community distributions under climate change. Ecosphere, 4(3): 1-23.

[45]
Savi K, 2020. ASEAN loses a third of mangroves in last 40 years. Open Development Mekong. July 30, 2020.

[46]
Shafroth P B, Wilcox A C, Lytle D A et al., 2010. Ecosystem effects of environmental flows: modelling and experimental floods in a dryland river. Freshwater Biology, 55(1): 68-85.

DOI

[47]
Syamsidik, Oktari R S, Nugroho A et al., 2021. Fifteen years of the 2004 Indian Ocean tsunami in Aceh-Indonesia: Mitigation, preparedness and challenges for a long-term disaster recovery process. International Journal of Disaster Risk Reduction, 54: 102052.

DOI

[48]
Tabari H, 2020. Climate change impact on flood and extreme precipitation increases with water availability. Scientific Reports, 10(1): 13768.

DOI PMID

[49]
Valderrama-Landeros L H, Martell-Dubois R, Ressl R et al., 2019. Dynamics of coastline changes in Mexico. Journal of Geographical Sciences, 29(10): 1637-1654.

DOI

[50]
Visser H, Petersen A C, Ligtvoet W, 2014. On the relation between weather-related disaster impacts, vulnerability and climate change. Climatic Change, 125(3/4): 461-477.

DOI

[51]
Vogt J, Skóra A, Feller I C et al., 2012. Investigating the role of impoundment and forest structure on the resistance and resilience of mangrove forests to hurricanes. Aquatic Botany, 97(1): 24-29.

DOI

[52]
Wang L, Jia M M, Yin D M et al., 2019. A review of remote sensing for mangrove forests: 1956-2018. Remote Sensing of Environment, 231: 111223.

DOI

[53]
Ward R D, Friess D A, Day R H et al., 2016. Impacts of climate change on mangrove ecosystems: A region by region overview. Ecosystem Health and Sustainability, 2(4): e01211.

DOI

[54]
Watinee T, Netnapid T, 2013. Vegetation greenness modeling in response to climate change for Northeast Thailand. Journal of Geographical Sciences, 23(6): 1052-1068.

DOI

[55]
Winsemius H C, Aerts J C J H, van Beek L P H et al., 2016. Global drivers of future river flood risk. Nature Climate Change, 6(4): 381-385.

DOI

[56]
Worthington T A, zu Ermgassen P S E, Friess D A et al., 2020. A global biophysical typology of mangroves and its relevance for ecosystem structure and deforestation. Scientific Reports, 10(1): 1-11.

DOI

[57]
Zhang K Q, Thapa B, Ross M et al., 2016. Remote sensing of seasonal changes and disturbances in mangrove forest: A case study from South Florida. Ecosphere, 7(6): e01366.

[58]
Zhang X F, Tang D L, Li Z Z et al., 2009. The effects of wind and rainfall on suspended sediment concentration related to the 2004 Indian Ocean tsunami. Marine Pollution Bulletin, 58(9): 1367-1373.

DOI PMID

Outlines

/