
Journal of Geographical Sciences >
Spatiotemporal variations of eco-environment in the Guangxi Beibu Gulf Economic Zone based on remote sensing ecological index and granular computing
|
Liao Weihua (1975-), Associate Professor, specialized in remote sensing for eco-environment analysis. |
Received date: 2021-09-22
Accepted date: 2022-02-16
Online published: 2022-11-25
Supported by
Guangxi Natural Science Foundation(2020GXNSFAA297176)
National Natural Science Foundation of China(U21A2022)
National Natural Science Foundation of China(42101369)
Youth Teacher Scientific Research Ability Improvement Project of Guangxi(2021KY0393)
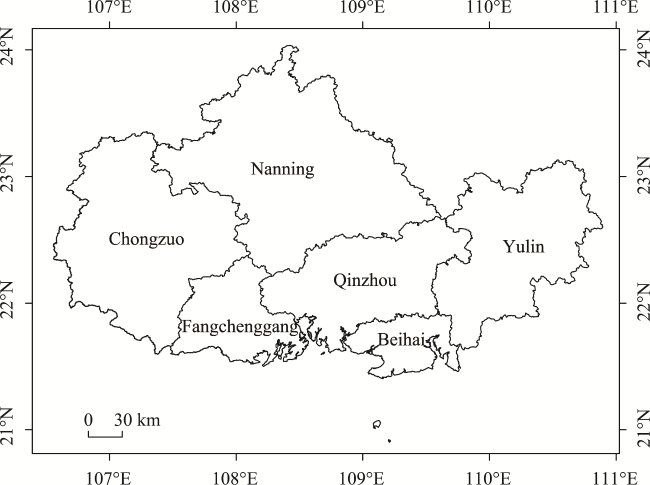
Accurate and rapid evaluation of the regional eco-environment is critical to policy formulation. The remote sensing ecological index (RSEI) model of the Guangxi Beibu Gulf Economic Zone (GBGEZ) during 2001-2020 was established and evaluated using four indices: dryness, wetness, greenness, and heat. This paper proposes an information granulation method for remote sensing based on the RSEI index value that uses granular computing. We found that: (1) From 2001 to 2020, the eco-environmental quality (EEQ) of GBGEZ tended to improve, and the spatial difference tended to expand. The regional spatial distribution of the eco-environment is primarily in the second-level and third-level areas, and the EEQ in the east and west is better than that in the middle. The contribution of greenness, wetness, and dryness to the improvement of EEQ in the study region increased year by year. (2) From 2001 to 2020, the order of the contribution of the EEQ index in the GBGEZ was dryness, wetness, greenness, and heat. (3) The social and economic activities in the study region had a certain inhibitory effect on the improvement of the EEQ.
LIAO Weihua , JIANG Weiguo , HUANG Ziqian . Spatiotemporal variations of eco-environment in the Guangxi Beibu Gulf Economic Zone based on remote sensing ecological index and granular computing[J]. Journal of Geographical Sciences, 2022 , 32(9) : 1813 -1830 . DOI: 10.1007/s11442-022-2024-3
Figure 1 Location and administrative divisions of the Guangxi Beibu Gulf Economic Zone |
Table 1 Brief table of data description |
| Data item | Time | Source | Dataset provider | Resolution |
|---|---|---|---|---|
| Greenness | 2001.01.01-2020.12.31 | Landsat 7 Collection 1 Tier 1 and Real-Time data TOA Reflectance | USGS/Google | 30 m, 60 m |
| Wetness | 2001.01.01-2020.12.31 | Landsat 7 Collection 1 Tier 1 and Real-Time data TOA Reflectance | USGS/Google | 30 m, 60 m |
| Heat | 2001.01.01-2020.12.31 | MOD11A2.006 Terra Land Surface Temperature and Emissivity 8-Day Global 1 km | NASA LP DAAC at the USGS EROS Center | 1200 m |
| Dryness | 2001.01.01-2020.12.31 | Landsat 7 Collection 1 Tier 1 and Real-Time data TOA Reflectance | USGS/Google | 30 m, 60 m |
| GDP | 2001, 2005, 2010, 2015 | http://www.resdc.cn/Default.aspx | Resource and Environmental Science and Data Center of the Institute of Geographic Sciences and Natural Resources Research | 1000 m |
| Population | 2001, 2005, 2010, 2015 | http://www.resdc.cn/Default.aspx | Resource and Environmental Science and Data Center of the Institute of Geographical Sciences and Natural Resources Research | 1000 m |
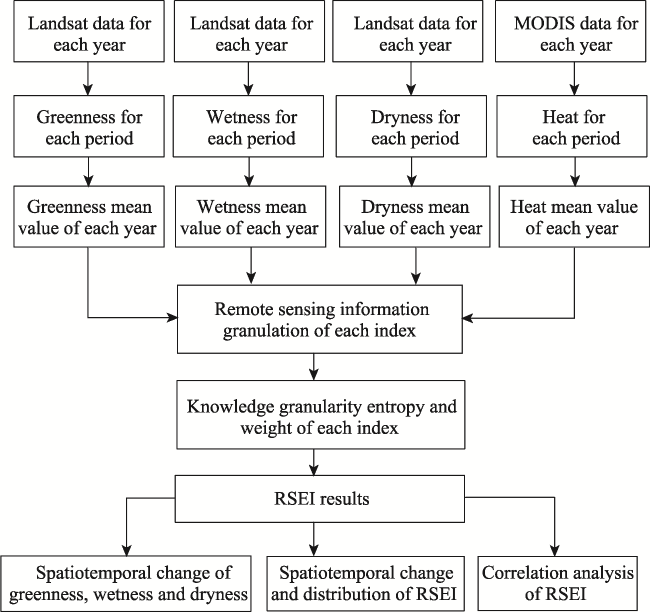
Figure 2 Methodological framework of the remote sensing ecological index (RSEI) analysis in the Guangxi Beibu Gulf Economic Zone during 2001-2020 |
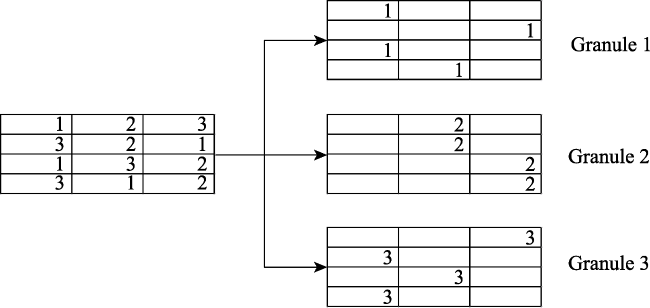
Figure 3 Process of spatial information granulation |
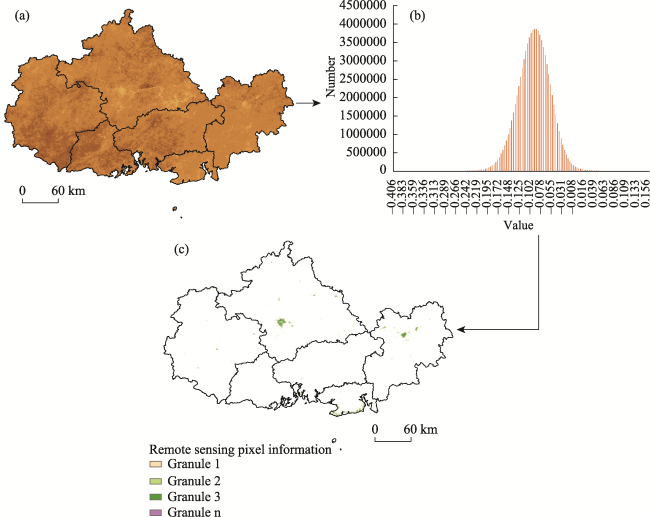
Figure 4 Granulation process of remote sensing spatial information based on the index attribute value histogram |
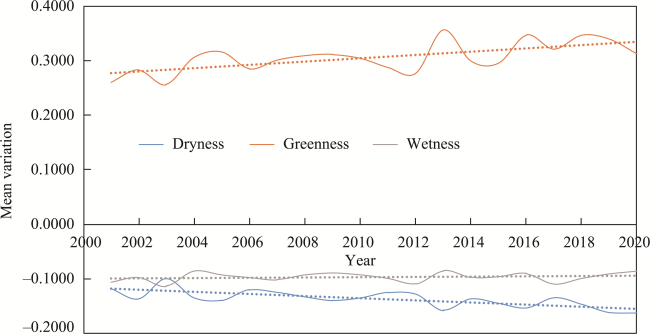
Figure 5 Mean variations in greenness, dryness, and wetness in the Guangxi Beibu Gulf Economic Zone |
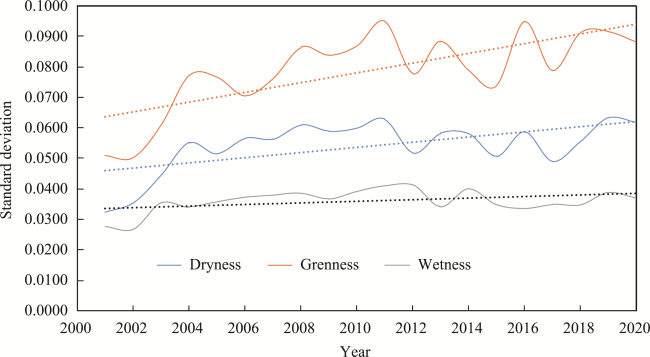
Figure 6 Standard deviation (Std) variations of greenness, dryness, and wetness in the Guangxi Beibu Gulf Economic Zone |
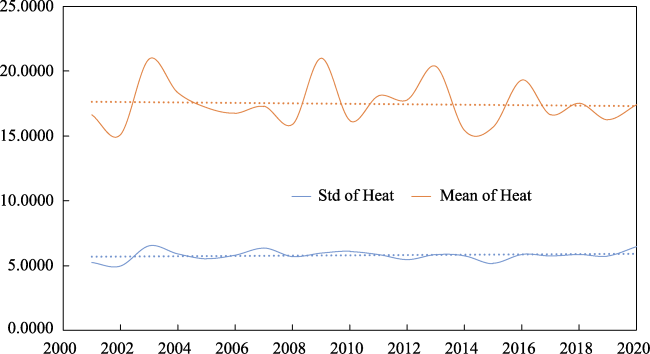
Figure 7 Standard deviation (Std) and mean variations in heat in the Guangxi Beibu Gulf Economic Zone |
Table 2 Granularity entropy and weight of the ecological remote sensing index in different years in the Guangxi Beibu Gulf Economic Zone |
| Year | Greenness | Dryness | Wetness | Heat | |
|---|---|---|---|---|---|
| 2001 | Granularity entropy | 0.7831 | 0.7695 | 0.7776 | 0.8102 |
| weight | 0.2524 | 0.2682 | 0.2587 | 0.2208 | |
| 2005 | Granularity entropy | 0.7997 | 0.7819 | 0.8013 | 0.8282 |
| weight | 0.2539 | 0.2765 | 0.2518 | 0.2178 | |
| 2010 | Granularity entropy | 0.7916 | 0.7742 | 0.7962 | 0.8262 |
| weight | 0.2567 | 0.2782 | 0.2510 | 0.2140 | |
| 2015 | Granularity entropy | 0.8005 | 0.7830 | 0.8029 | 0.8316 |
| weight | 0.2551 | 0.2775 | 0.2520 | 0.2154 | |
| 2020 | Granularity entropy | 0.7928 | 0.8139 | 0.7997 | 0.8275 |
| weight | 0.2705 | 0.2429 | 0.2614 | 0.2252 |
Table 3 Statistical information about ecological remote sensing quality in the Guangxi Beibu Gulf Economic Zone in different years |
| Year | Max | Min | Mean | Standard deviation |
|---|---|---|---|---|
| 2001 | 0.8120 | 0.1151 | 0.3991 | 0.0468 |
| 2005 | 0.7591 | 0.1391 | 0.4110 | 0.0416 |
| 2010 | 0.8062 | 0.1411 | 0.4107 | 0.0523 |
| 2015 | 0.7469 | 0.1475 | 0.4102 | 0.0408 |
| 2020 | 0.7355 | 0.1347 | 0.3937 | 0.0441 |
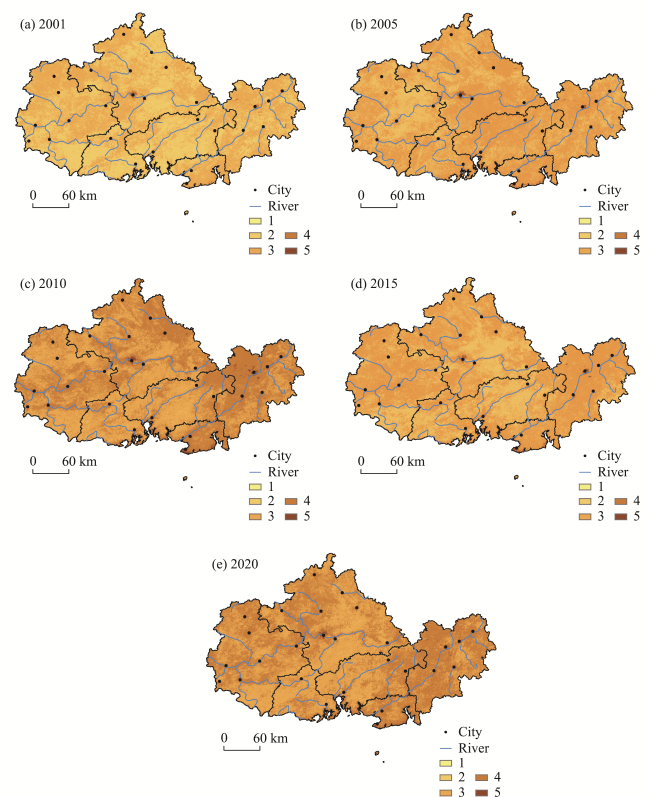
Table 4 Area percentage values of ecological region levels according to the RSEI in the Guangxi Beibu Gulf Economic Zone in different years (%) |
| Year | Level of ecological zones | ||||
|---|---|---|---|---|---|
| 1 | 2 | 3 | 4 | 5 | |
| 2001 | 0.0014 | 0.4521 | 0.5406 | 0.0057 | 0.0002 |
| 2005 | 0.0006 | 0.3305 | 0.6639 | 0.005 | 0 |
| 2010 | 0.0047 | 0.4895 | 0.4986 | 0.0073 | 0 |
| 2015 | 0.0002 | 0.3351 | 0.6596 | 0.0051 | 0 |
| 2020 | 0.0026 | 0.4878 | 0.5065 | 0.0032 | 0 |
Figure 8 RSEI spatial distribution of the Guangxi Beibu Gulf Economic Zone in 2001, 2005, 2010, 2020 (the types in the legend corresponds to Table 4) |
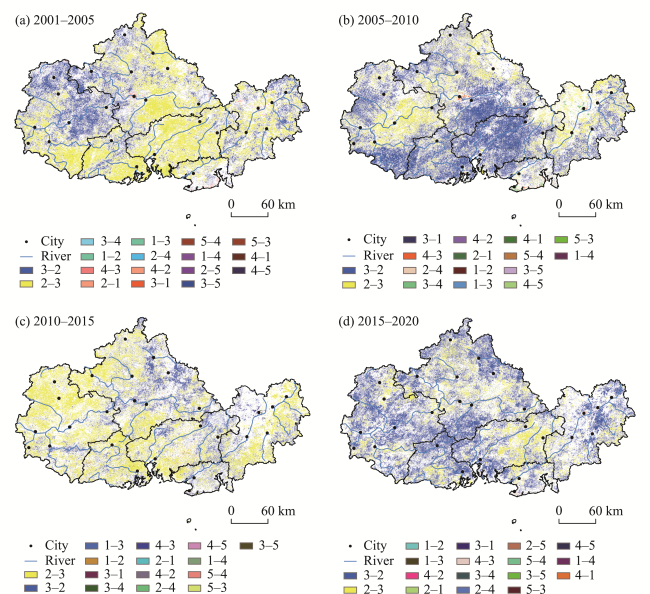
Figure 9 RSEI Spatial transfer distributions in the Guangxi Beibu Gulf Economic Zone (the types in the legend corresponds to Table 4) |
Table 5 Spatial transformation matrix of the RSEI in the Guangxi Beibu Gulf Economic Zone (%) |
| 2001-2005 | 2005-2010 | |||||||||
|---|---|---|---|---|---|---|---|---|---|---|
| 1 | 2 | 3 | 4 | 5 | 1 | 2 | 3 | 4 | 5 | |
| 1 | 0.000 | 0.072 | 0.066 | 0.000 | 0.000 | 0.000 | 0.052 | 0.007 | 0.000 | 0.000 |
| 2 | 0.042 | 17.698 | 27.446 | 0.024 | 0.000 | 0.212 | 20.407 | 12.412 | 0.014 | 0.000 |
| 3 | 0.018 | 15.269 | 38.568 | 0.205 | 0.000 | 0.255 | 28.470 | 37.218 | 0.445 | 0.001 |
| 4 | 0.000 | 0.006 | 0.308 | 0.254 | 0.001 | 0.000 | 0.015 | 0.219 | 0.269 | 0.001 |
| 5 | 0.000 | 0.000 | 0.000 | 0.021 | 0.001 | 0.000 | 0.000 | 0.000 | 0.002 | 0.000 |
| 2010-2015 | 2015-2020 | |||||||||
| 1 | 2 | 3 | 4 | 5 | 1 | 2 | 3 | 4 | 5 | |
| 1 | 0.001 | 0.331 | 0.135 | 0.000 | 0.000 | 0.000 | 0.010 | 0.005 | 0.000 | 0.000 |
| 2 | 0.012 | 23.246 | 25.677 | 0.011 | 0.000 | 0.188 | 22.212 | 11.104 | 0.007 | 0.000 |
| 3 | 0.002 | 9.930 | 39.745 | 0.178 | 0.000 | 0.072 | 26.548 | 39.194 | 0.149 | 0.000 |
| 4 | 0.000 | 0.004 | 0.406 | 0.320 | 0.001 | 0.000 | 0.006 | 0.343 | 0.161 | 0.000 |
| 5 | 0.000 | 0.000 | 0.000 | 0.002 | 0.000 | 0.000 | 0.000 | 0.000 | 0.001 | 0.000 |
Table 6 Correlation between population, GDP, and the RSEI in the Guangxi Beibu Gulf Economic Zone |
| Year | GDP | Population |
|---|---|---|
| 2001 | -0.1943 | -0.2333 |
| 2005 | -0.2249 | -0.3553 |
| 2010 | -0.2283 | -0.3115 |
| 2015 | -0.1013 | -0.1485 |
| [1] |
|
| [2] |
|
| [3] |
|
| [4] |
|
| [5] |
|
| [6] |
|
| [7] |
|
| [8] |
|
| [9] |
|
| [10] |
|
| [11] |
|
| [12] |
|
| [13] |
|
| [14] |
|
| [15] |
|
| [16] |
|
| [17] |
|
| [18] |
|
| [19] |
|
| [20] |
|
| [21] |
|
| [22] |
|
| [23] |
|
| [24] |
|
| [25] |
|
| [26] |
|
| [27] |
|
| [28] |
|
| [29] |
|
| [30] |
|
| [31] |
|
| [32] |
|
| [33] |
|
| [34] |
|
| [35] |
|
| [36] |
|
/
| 〈 |
|
〉 |