Regular Articles

Profoundly entwined ecosystem services, land-use change and human well-being into sustainability management in Yushu, Qinghai-Tibet Plateau

  • LIU Mengxue , 1, 2, 3 ,
  • GAO Ya 1, 2, 3 ,
  • WEI Hejie 4 ,
  • DONG Xiaobin , 1, 2, 3, * ,
  • ZHAO Bingyu 2 ,
  • WANG Xue-Chao 1, 2, 3 ,
  • ZHANG Peng 1, 2, 3 ,
  • LIU Ranran 1, 2, 3 ,
  • ZOU Xinyu 5
Expand
  • 1.State Key Laboratory of Earth Surface Processes and Resource Ecology, Beijing Normal University, Beijing 100875, China
  • 2.Beijing Normal University, Beijing 100875, China
  • 3.College of Resources Science and Technology, Beijing Normal University, Beijing 100875, China
  • 4.College of Resources and Environmental Sciences, Henan Agricultural University, Zhengzhou 450002, China
  • 5.School of Information Engineering, China University of Geosciences, Beijing 100083, China
*Dong Xiaobin, E-mail:

Liu Mengxe, E-mail:

Received date: 2021-09-30

  Accepted date: 2022-03-25

  Online published: 2022-11-25

Supported by

The Second Tibetan Plateau Scientific Expedition and Research (STEP) Program(2019QZKK0608)

National Natural Science Foundation of China(42171275)

China Science & Technology Supporting Program(2017YFE0100400)

Abstract

The nexus exploration among land use/land cover change, ecosystem services and human well-being has been increasingly crucial in the context of Future Earth. However, the spatial heterogeneity and the entwining process among these three aspects have not yet been in-depth and systematically explored. Here we identified the spatiotemporal pattern of ecosystem services during the past 20 years in Yushu, the eco-fragile region and the centre of Qinghai-Tibet Plateau, as well as clarified its relationships with land use change and human well-being. We revealed that: (1) The structure of the ecosystem and land use in this area have been increasingly stable, and the ecological projects have exerted a positive impact. (2) Although the ecological environmental issues still need more attention, the ecosystem services of the area have been positively developing. (3) Derived by the ecosystem services increase, environmental projects and policies, the human well-beings of culture and education performed much better than other aspects. (4) It is crucial to carry out long-term ecological projects and increase educational investment for maintaining the stability of this ecologically fragile area. This study provides significant support for the regional ecological sustainability decision making, especially for the Qinghai-Tibet Plateau, the roof of the world.

Cite this article

LIU Mengxue , GAO Ya , WEI Hejie , DONG Xiaobin , ZHAO Bingyu , WANG Xue-Chao , ZHANG Peng , LIU Ranran , ZOU Xinyu . Profoundly entwined ecosystem services, land-use change and human well-being into sustainability management in Yushu, Qinghai-Tibet Plateau[J]. Journal of Geographical Sciences, 2022 , 32(9) : 1745 -1765 . DOI: 10.1007/s11442-022-2021-6

1 Introduction

Human activities and climate change have continued to intensify in the past 100 years (Cui et al., 2020), having a broad range of impacts such as rapid global warming (Du et al., 2019), large carbon emissions (Tang et al., 2020) and rising sea levels. Although environmental protection has achieved great results in the past 50 years (Ouyang et al., 2016; Chen et al., 2019), the earth system has continued to deteriorate, and many ecological and environmental problems have exceeded the planetary boundaries (Bunsen et al., 2021). The 2015 Planetary Boundaries Assessment concluded that the phosphorus cycle and land-use changes from the 9 key processes of the Earth have entered a high-risk level (Steffen et al., 2015). The 2019 IPBES global assessment report showed that 78% of the benefits that humans obtain from nature (14 out of 18 categories) are rapidly declining, and the processes of human activities such as land use, population, economy, and technology are important driving factors (Bongaarts, 2019). Land use/land cover change (LUCC) is an important driving force of global change, and it is the intersection of the closest interaction between humans and nature. LUCC directly affects the structure and function of the ecosystem (Talukdar et al., 2020) and then affects the ability to provide ecosystem services (Sharma et al., 2019), ultimately affecting human well-being. For example, intensive urban land-use changes will lead to habitat fragmentation and a loss of biodiversity, thereby harming human well-being; on the other hand, LUCC decisions will preserve ecological values and ecosystem services through conservation strategies (Che et al., 2021), which are vital to maintaining human well-being. The Millennium Ecosystem Assessment (MA) defined ecosystem services as the various benefits that humans obtain from the ecosystem (MEA, 2005). Human well-being is an activity and state that people think is valuable. According to Maslow’s hierarchy of needs (Lester, 2013), MA defines the components of human well-being as safety, the basic material needs for maintaining a high-quality life, health, good social relations, and the freedom of choices and actions.
Many previous studies have focused on the relationship between LUCC and ecosystem services (Wang et al., 2018; Gomes et al., 2020; Riao et al., 2020). Most studies have used methods such as models and remote sensing (Cabral et al., 2016; Shi et al., 2020), and they have focused on the impact of changes in land cover type (Chen et al., 2020), structure (Lin et al., 2013; Lavorel et al., 2017), and intensity (Chillo et al., 2018; Wen et al., 2019) on ecosystem services. Others have studied the influence of LUCC on ecosystem services under different scenarios (Bohensky et al., 2010; Schirpke et al., 2013; Farella et al., 2020). After MA creatively proposed the relationship between ecosystem services and human well-being, an increasing number of studies focused on the impact of changes in ecological environmental quality on human well-being (Fedele et al., 2017). As the first theme of Future Earth, “LUCC, Ecosystem Services and Human Well-being” has attracted increasing attention (Bai et al., 2019; Schneider et al., 2020). Studies have explored the impact of land-use intensity on China’s rural ecosystem services and human well-being. The results indicate that an increase in land-use intensity in the study area is positively correlated with the provision services and the standards of living, and negatively correlated with the regulating services (Xu et al., 2016). The literature (Quintas-Soriano et al., 2016) discussed the impact of different land use methods on ecosystem services and used questionnaires to investigate local people’s attitudes towards human well-being in the arid region of southeastern Spain. The results showed that there were significant differences in social perceptions between the positive and negative impacts of land-use types on ecosystem services. Wang et al. (2017) used the equivalent factor method and index system evaluation method to evaluate LUCC, ecosystem services, and human well-being based on 3S technology in the Manas River basin from 2003 to 2013 and characterized the difficult relationships among the three. The results noted the methods of land use that could be used to achieve sustainable development.
However, most previous studies have adopted the equivalent value of ecosystem services or two-period differences of ecosystem services to explore the relationships among LUCC, ecosystem services and human well-being. The equivalent value of ecosystem services can measure the absolute value of ecosystem services, but it ignores the spatial heterogeneity and process of ecosystem services. Material assessment of ecosystem services with two-phase data also cannot reflect the dynamic of ecosystem services and ignore the process of the ecosystem. Therefore, this paper employed material assessment with four-phase data to explore spatiotemporal change in ecosystem services. The relationship among LUCC, ecosystem services and human well-being is further studied and the driving forces of ecological change are also explored to provide suitable policies and recommendations for increasing human well-being under sustainable development in Yushu.
Yushu is located in the hinterland of the Qinghai-Tibet Plateau, which has characteristics of oxygen shortages with harsh climatic conditions. In recent years, ecological environmental problems such as glacier retreat, vegetation degradation, soil desertification and biodiversity reduction have become increasingly prominent, posing serious threats to the ecosystem and economic development of the entire region. Additionally, the state has carried out a series of ecological protection projects in the Source Region of the Three Rivers area, trying to restore good habitats and protect the water sources. Moreover, China has proposed a major strategy for building an ecological civilization highland on the Qinghai-Tibet Plateau. Therefore, comprehensive research on the complex changes and driving forces of land use, ecological environment and human well-being in Yushu, the core area of the Source Region of the Three Rivers, is particularly important to promote the coordinated development of the regional economy and environment. This paper aimed at clarifying complex relationships among LUCC, ecosystem services and human well-being and providing suitable recommendations for local sustainable development. We firstly used different models to evaluate the value of ecosystem services at the pixel level based on the four-period data. Then, we calculated the slope of the four periods to eliminate the impact of a single year on the overall change trend of the ecosystem services. Furthermore, we explored the relationship among LUCC, ecosystem services and human well-being at the county scale. In addition, we proposed suitable suggestions for local sustainable development and regional human well-being improvement.

2 Study area and data

2.1 Study area

Yushu is located in the Source Region of the Three Rivers (the headwater region of the Yellow River, Yangtze River, and Lancang River) in the hinterland of the Qinghai-Tibet Plateau in the southwest Qinghai Province, with an average elevation of more than 4200 m. The geographical location is roughly between 89°27’-97°39’E and 31°45’-36°10’N. Yushu has a typical plateau alpine climate. There are not four seasons throughout the year; rather, the region has cold and warm seasons. The cold season lasts for 7 to 8 months, and the warm season lasts only 4 to 5 months. The annual average temperature is 2.9℃, the average temperature in January is -7.5℃, and the average temperature in July is 12.5℃. The annual precipitation is 487 mm. In 2003, the National Nature Reserve of Three Rivers Source was established. The National Nature Reserve of Three Rivers Source is currently the nature reserve with the highest altitude, the largest wetland area, and the highest concentration of plateau species in China. It has a profound impact on the ecological environment of Yushu.
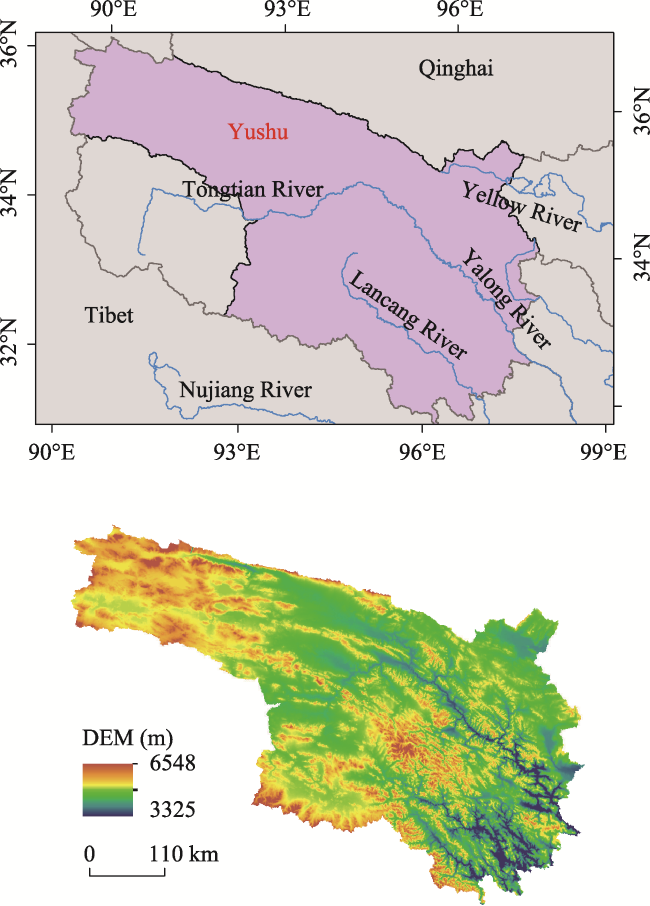
Figure 1 The location of Yushu, Qinghai Province, China

2.2 Data

The data used in this paper and its sources are shown in Table 1, and the spatial resolution of all data is 1 km. Taking data available and consistency into consideration, we selected 2000, 2005, 2010 and 2015 as the study period. The land-use data divide the land-use types in the study area into seven categories: forest land, grassland, water body, urban land, bare land, farmland, and ice/snow. The temperature data, precipitation data, and solar radiation data were obtained through reverse distance weighted interpolation and resampling from station data. Potential evapotranspiration data were processed by the MRT tool from MOD16A3 products.
Table 1 The data type and source
Data Sources Website
Land cover/land change data The Resource and Environmental Science Data Center of the Chinese Academy of Sciences www.resdc.cn
DEM The Resource and Environmental Science Data Center of the Chinese Academy of Sciences www.resdc.cn
Temperature data The National Meteorological Information Center https://www.gloh2o.org
Precipitation data The National Meteorological Information Center https://www.gloh2o.org
Solar radiation data The National Meteorological Information Center https://www.gloh2o.org
Soil texture FAO’s HWSD 1.2 Global Soil Assimilation Database https://www.fao.org
Potential evapotranspiration (PET) MOD16A3 products from the US
Geological Survey (USGS)
https://ladsweb.modaps.eosdis.nasa.gov/
NDVI annual composite data/NDVI monthly composite data The Resource and Environmental Science Data Center of the Chinese Academy of Sciences www.resdc.cn
Statistical yearbook data Qinghai Provincial Bureau of
Statistics/National Bureau of Statistics
http://tjj.qinghai.gov.cn/http://www.stats.gov.cn/
Population density distribution data The Resource and Environmental Science Data Center of the Chinese Academy of Sciences www.resdc.cn
GDP distribution data The Resource and Environmental Science Data Center of the Chinese Academy of Sciences www.resdc.cn
Nighttime lights product DMSP/OLS from NOAA National Centers for Environmental Information and NPP/VIRRS from the US Geological
Survey (USGS)
https://www.ngdc.noaa.gov/eog/dmsp/downloadV4composites.htmlhttps://lpdaac.usgs.gov/dataset_discovery/viirs/

3 Methods

3.1 Land use/land cover change

3.1.1 Land use transfer matrix

The land use transfer matrix reveals information about the starting point and the decreasing direction of a specific land-use type. The land transfer matrix of the study area from 2000 to 2015 was obtained based on the land use maps in 2000 and 2015 and GIS technology. According to the land use transfer matrix, we can determine the direction of land-use change in the study area over the past 15 years.

3.1.2 Landscape development index

The landscape development index (LDI) is defined as the intensity of the impact of human activities on the land ecosystem (Brown and Vivas, 2005). The index is proposed based on the energy and material usage per unit land use area under different land-use types (Mack, 2006). It is an effective index for evaluating the cumulative effect of humans on a continuous gradient (Reiss et al., 2014). The calculation formula is as follows (Brown and Vivas, 2005):
$LD{{I}_{total}}=\mathop{\sum }^{}%L{{U}_{i}}\times LD{{I}_{i}}$
where LDItotal is the value per unit; %LUi is the percentage of land use i; and LDIi is the landscape development intensity coefficient for land use i, which ranges from 1-10. The larger the value is, the stronger the impact of human activities is. We modified the coefficient of the LDI to suit the real situation of Yushu. The modified LDI of different land-use types (Margriter et al., 2014) is shown in Table 2.
Table 2 The modified coefficient of the LUI of different land-use types in Yushu (Margriter et al., 2014)
Land cover types Forest land Grassland Water body Urban land Bare land Farmland Ice/Snow
LDI coefficients 2.02 3.74 1 9 1 4.54 1

3.2 Ecosystem service assessment

Since Yushu is located in the Source Region of the Three Rivers, the water conservation function is very important (Yao et al., 2019), and the average elevation of Yushu is high. Furthermore, human activities have destroyed the alpine meadows and caused serious soil erosion in recent years (Jiang and Zhang, 2015). This research selected the water yield (WY) carbon sequestration (CS) soil conservation (SC) and landscape recreation (LR) to evaluate the ecosystem services of Yushu. The corresponding calculation method is shown below.

3.2.1 Water yield

The water yield module of InVEST was used to evaluate the WY in the study area. InVEST’s water yield module is an estimation method based on the water balance method. The precipitation of each grid unit minus the actual evapotranspiration is the WY value. The water yield evaluation module is based on the Budyko water-energy coupled balance assumption, and the formula is as follows (Zhang et al., 2004):
${{Y}_{xj}}=\left( 1-\frac{AE{{T}_{xj}}}{{{P}_{x}}} \right)\times {{P}_{x}}$
where Yxj (mm) is the annual water yield of land-use type j in grid x; AETxj (mm) is the actual evapotranspiration of land-use type j in grid x; and Px (mm) represents the annual precipitation of grid unit x. The required data include land-use data, DEM data, annual precipitation data, annual average potential evapotranspiration data, soil depth data, plant available water content data, watershed and sub-basin boundaries, and biophysical parameters. Both soil depth data and plant available water content were calculated using data from the World Soil Data Set. Watershed and sub-watershed data were extracted from the DEM in ArcGIS.

3.2.2 Soil conservation

This paper uses the Revised Universal Soil Loss Equation (RUSLE) model to evaluate soil conservation in the study area. The formula of RUSLE is as follows (Gao et al., 2016),
$A=f\times R\times K\times LS\times C\times P$
where A (thm‒2a‒1) is the amount of soil erosion per unit area, and f is a constant from the US system to the international system, which is 224.2. It is used to convert the unit between the erosion modulus and the rainfall erosivity factor. R is the rainfall erosivity factor (MJmmhm‒2h‒1a‒1), K is the soil erodibility factor (thMJ‒1mm‒1), LS is the slope length and slope factor, C is the surface vegetation cover factor, and P is the soil conservation measure factor. The R factor uses the Wischmeier formula (Wischmeier and Mannering, 1969) to calculate the annual R value. The formula is as follows,
$R=\underset{i=1}{\overset{12}{\mathop \sum }}\,1.7535\times {{10}^{\left( 1.5lo{{g}_{10}}\text{ }P_{i}^{2}/P-0.08188 \right)}}$
where Pi is the monthly average precipitation (mm), and p is the annual average precipitation. K is the soil erodibility factor, and the erosion-productivity impact calculator (EPIC) model (Wallis and Griffiths, 1995) was selected to estimate the value of K as follows:
$\begin{align} & K=\left\{ 0.2+0.3\text{exp}\left[ -0.0256{{S}_{a}}\left( 1-\frac{{{S}_{i}}}{100} \right) \right] \right\}\times {{\left( \frac{{{S}_{i}}}{{{C}_{i}}+{{S}_{i}}} \right)}^{0.3}}\left[ 1-\frac{0.25C}{C+\text{exp}\left( 3.72-2.95C \right)} \right]\times \\ & \ \ \ \ \ \ \ \ \left[ 1-\frac{0.7{{S}_{n}}}{{{S}_{n}}+\text{exp}\left( -5.51+22.9{{S}_{a}} \right)} \right] \\ \end{align}$
${{S}_{n}}=1-\frac{{{S}_{a}}}{100}$
where Sa, Si, Ci, and C refer to grain content, sand content, clay content, and organic carbon content, respectively. LS refers to soil loss generated by a slope of a certain slope, which is calculated by the DEM, and its calculation formula is as follows (Zhang et al., 2013):
$L={{\left( {}^{\lambda }/{}_{22.13} \right)}^{m}}\left\{ \begin{array}{*{35}{l}} m=0.2, & \theta <{{1}^{{}^\circ }} \\ m=0.3, & {{1}^{{}^\circ }}<\theta <{{3}^{{}^\circ }} \\ m=0.4, & {{3}^{{}^\circ }}<\theta <{{5}^{{}^\circ }} \\ m=0.5, & \theta >{{5}^{{}^\circ }} \\\end{array}~ \right.$
$S=\left\{ \begin{matrix} 10.8\sin \theta +0.03,\ \theta <{{5}^{{}^\circ }} \\ 16.8\sin \theta -0.5,\ {{5}^{{}^\circ }}\le \theta \le {{10}^{{}^\circ }} \\ 21.9 \sin \theta -0.96,\ \theta >{{10}^{{}^\circ }} \\\end{matrix} \right.$
where λ is the slope, and m is a dimensionless constant, depending on the slope θ.
C is the vegetation coverage and management factor and refers to a certain area of soil loss under certain coverage and management levels. Its calculation formula is as follows according to (Qi et al., 2011):
$C=\left\{\begin{array}{c} 1, f_c=0 \\ 0.6508-0.3436 \lg f_c, 0<f_c<78.3 \% \\ 0, f_c \geqslant 78.3 \% \end{array}\right.$
${{f}_{c}}=\frac{NDVI-NDV{{I}_{\text{min}}}}{NDV{{I}_{\text{max}}}-NDV{{I}_{\text{min}}}}$
where P is the soil and water conservation factor and refers to the ratio of soil loss under water and soil conservation measures to soil loss cultivation without these measures on that slope. It is calculated as follows (Lufafa et al., 2003):
$P=0.2+0.03S$
where S is the slope.

3.2.3 Carbon sequestration

This paper used the net primary productivity (NPP) of vegetation to account for the carbon sequestration of the study area. NPP refers to the total amount of organic substances remaining in the organic material produced by the land vegetation in unit time and unit area. As a key process of the carbon cycle (Matamala et al., 2003), it reflects the comprehensive utilization of climate, environment, and human activities on vegetation. This study uses a Carnegie Ames-Stanford approach (CASA) model based on the light energy utilization principle to estimate NPP. The calculation formula is as follows (Zhu et al., 2007),
$NPP\left( x,t \right)=APAR\left( x,t \right)\times \varepsilon \left( x,t \right)$
where NPP(x,t) represents the net primary productivity of pixel x at time t (gCm‒2a‒1); APAR(x, t) indicates the photosynthetically active radiation absorbed at time t at location x (gCm‒2a‒1); and ε(x,t) indicates the actual light energy utilization of pixel x at time t (gCMJ‒1).

3.2.4 Landscape recreation

Due to the unavailability of religious data in Yushu, we only consider natural landscape recreation services in this study. According to the field research in Yushu, the main outdoor leisure and entertainment methods of residents are mostly the Naadam Conference, horse racing, and rotating mountains, which are usually held in grassland and forest. Therefore, we employed NDVI, which indicates the spatial distribution density of vegetation, to account for the natural landscape recreation value of Yushu.

3.3 Evaluation of human well-being

According to Maslow’s hierarchy of needs and the availability of data in the study area, four factor arrangements of human well-being were evaluated in this paper: economic development, health, social security, and culture & education. Economic development was measured by national economy and resource acquisition ability. The main industry in Yushu is animal husbandry. Therefore, the primary industry added value was employed to assess the level of the local economy. Moreover, the total postal and telecommunications business can evaluate a total number of post and telecommunications services including mobile telephones and expressages, which can reflect the ability to obtain material resources and information resources of residents. Health was characterized by physical health. The number of beds in hospitals and health centers and the number of technicians in the hospitals and health centers can present local medical levels, which can be two suitable indicators to evaluate physical health. Social security was quantified by social security capacity, and pension insurance is important to maintain the security and stability of society. Therefore, the number of people participating in pension insurance was employed to measure social security. Culture & education was assessed by education level. The number of students in ordinary secondary schools, the widely used index in the statistical yearbook, was adopted to assess the local education level. See Figure 2 for details.
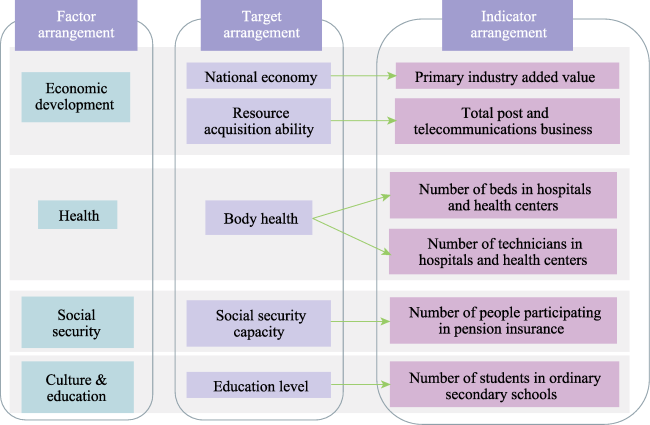
Figure 2 The framework of evaluation of human well-being in Yushu

3.4 Driving force analysis of ecosystem services

The geodetector is a statistical tool that detects the spatial heterogeneity of an element and reveals the driving force behind it (Wang and Xu, 2017). The theoretical core of the detector is to detect the consistency of the dependent variable and the independent variable through spatial heterogeneity. It measures the degree of interpretation of the dependent variables to the independent ones, that is, q. The value range of q is [0, 1]; the larger the value of q is, the larger the contribution the variable has made (Wang et al., 2010). In this study, the geodetector was used to spatially attribute the ecological environmental changes in Yushu. Since the input independent variables required by the geodetector are type variables, land-use types are classified according to categories, and other factors, whose independent variables are numerical, are discretized.

4 Results and analysis

4.1 Analysis of LUCC in Yushu from 2000-2015

The land use map of Yushu from 2000 to 2015 is shown in Figure 3. To show the changes in various land-use types in Yushu more clearly, we calculated the area and proportion of each category in Yushu from 2000 to 2015. The results are shown in Table 4. Combining Figure 3 and Table 4, it can be seen that during the 15 years, the main land-use types in Yushu were grassland and bare land. During the past 15 years, the types of land use areas that increased, from large to small, were water body, bare land and urban land. The other types were reduced.
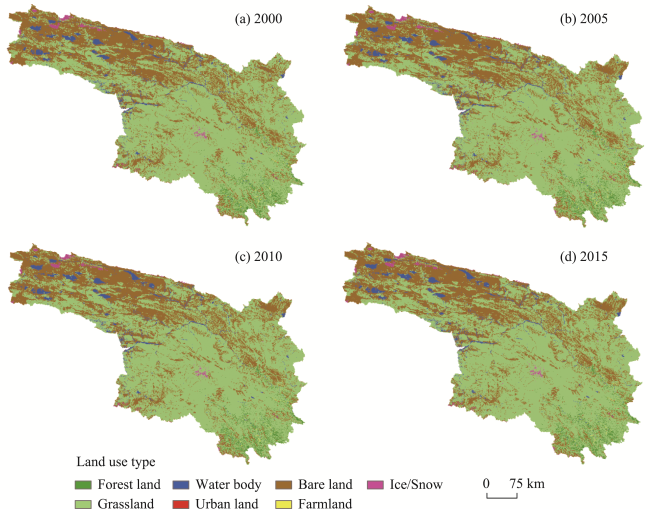
Figure 3 The land use map of Yushu from 2000-2015
To show the direction of land use transfer in Yushu during the past 15 years, we calculated the land use transfer matrix of Yushu, and the results are shown in Table 4. The conversion modes whose conversion area was more than 1000 km2 were: grassland turning into forest land, grassland turning into bare land, forest land turning into grassland, bare land turning into grassland, and bare land turning into water body. Forest land and grassland in Yushu have been severely degraded during the past 15 years, while planting trees, and artificial grassland and vegetation recovery are fruitful. Some grassland turned into water body, it is visible that climate warming has an adverse impact on Yushu. Moreover, a considerable area of water bodies turned into grassland and bare land, and it can be seen that ecological issues such as lakes and wetland degradation occurred in Yushu.
Table 3 The area and proportion of land-use types in Yushu from 2000 to 2015
Land use / land cover (km2) 2000 2005 2010 2015 Change area (2000-2015)
Area % Area % Area % Area % Area %
Forest land 5971.05 2.24 5972.4 2.24 5967 2.24 5964.3 2.24 -6.75 -0.11
Grassland 172,844 64.79 172,037.25 64.48 172,084.5 64.5 172,038.6 64.48 -805.4 -0.47
Water body 7685.55 2.88 7781.4 2.92 7781.4 2.92 8164.8 3.1 479.25 6.24
Urban land 59.4 0.02 59.4 0.02 62.1 0.02 76.95 0.02 17.55 29.55
Bare land 78,031.35 29.25 78,748.2 29.52 78,703.65 29.5 78,421.5 29.36 390.15 0.5
Farmland 371.25 0.14 364.5 0.14 364.5 0.14 360.45 0.14 -10.8 -2.9
Ice/Snow 1833.3 0.68 1833.3 0.68 1833.3 0.68 1769.85 0.66 -63.45 -3.5
Total 266,795.9 100 266,796.45 100 266,796.45 100 266,796.45 100
Table 4 Land use transfer matrix of Yushu during 2000-2015
Area in 2000
(km2)
Area in 2015 (km2)
Forest land Grassland Water body Urban land Bare land Farmland Ice/Snow
Forest land 3823.2 1911.6 36.45 5.05 151.2 29.7 0
Grassland 1831.95 156,863.25 974.7 28.35 13,234.05 122.85 140.4
Water body 32.4 909.9 5741.55 4.05 997.65 6.75 0
Urban land 4.05 20.25 4.05 27 2.7 0 0
Bare land 195.75 12,164.85 1431 9.45 64,088.55 4.05 168.75
Farmland 39.15 125.55 4.05 4.05 2.7 195.75 0
Ice/Snow 1.35 143.1 0 0 228.15 0 1422.9
Total 5927.85 172,138.5 8191.8 77.95 78,705 359.1 1732.05
We used LDI to calculate the land use intensity of Yushu from 2000 to 2015, and the results are shown in Table 5. Because the areas of grassland and bare land in Yushu were too large, and the area ratio of land-use types was relatively stable in the past 15 years, resulting in a slight change in the LDI of Yushu during 2000-2015, which showed that the overall structural changes of Yushu were weak.
Table 5 The LDI of each county of Yushu during 2000-2015
LDI Zhidoi Qumarleb Chindu Zadoi Yushu Nangqen
2000 2.483 2.530 3.224 3.333 3.371 3.015
2005 2.482 2.387 3.227 3.334 3.368 3.015
2010 2.482 2.487 3.232 3.334 3.369 3.015
2015 2.482 2.486 3.232 3.334 3.371 3.016

4.2 Changes in ecosystem services

The results of the four different ecosystem services in Yushu are shown in Figure 4. From 2000 to 2015, the WY of Yushu first increased, and then decreased; the SC of Yushu first increased slightly and then significantly declined; the CS of Yushu first increased, then slightly declined, and finally increased, which may have been related to ecological projects such as returning grazing land to grassland and afforestation in the past 15 years; the LR of Yushu increased significantly. It was highly related to the effective ecological governance and the increasing trend of tourism, especially in the newly built city, which has been very dynamic and attractive since the Yushu earthquake.
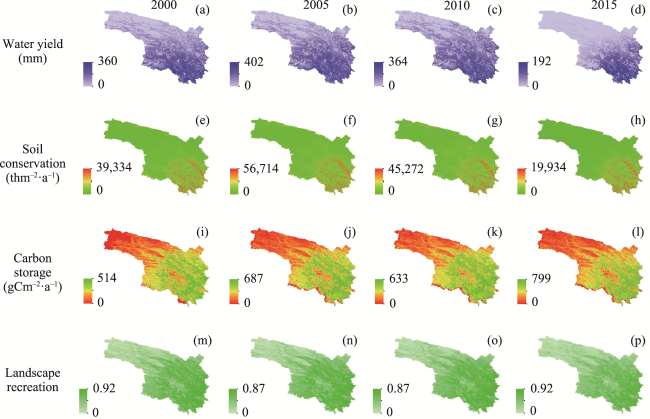
Figure 4 The distribution of four ecosystem services of Yushu from 2000-2015
In order to reduce the influence of a single year on the overall change of the 15-year trend of ecosystem services, the change rate of the time series was employed and the result is shown in Figure 5. During 2000 and 2015, the change rate of WY varied in this region, and it had a clear partition (Figure 5a). The WY in Yushu’s northern part had an increasing trend, and the WY in the southern part of Yushu was significantly reduced. Combined with the surface runoff and precipitation data from meteorological stations and the related literature (Han et al., 2019; Chu et al., 2019), it was found that, in the northern part of Yushu, the significant increase in precipitation since 2000 has increased the WY, while in the south of Yushu, the temperature and evaporation have increased due to climate change and human activities, resulting in a decrease in WY.
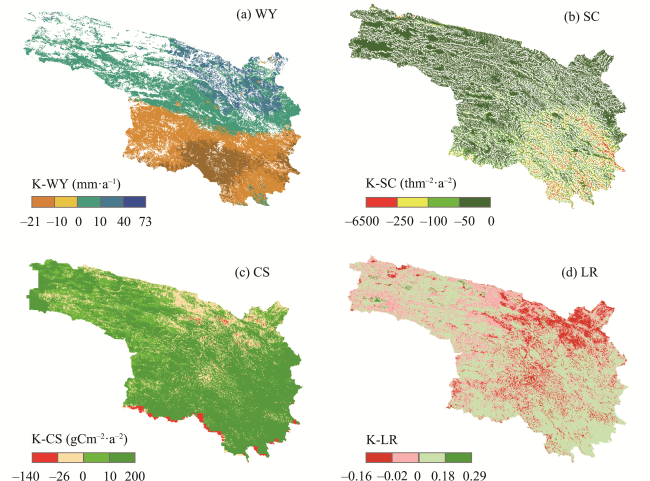
Figure 5 The change rates of ecosystem services in Yushu during 2000-2015
As shown in Figure 5b, the most obvious decrease in soil erosions was in the northwestern part of Yushu because this area is mainly covered by alpine meadows, which can effectively reduce the ecological risk caused by soil erosion, and the decrease in soil erosion in southern Yushu was not evident. Urbanization expansion has been rapid, and human activities have been intense in this area in the last 15 years.
Figure 5c shows the time series change rate of CS in Yushu from 2000 to 2015. During these 15 years, most areas of Yushu had increased in CS. The significant increase occurred in southern Yushu, and the CS in eastern Yushu trended downward.
Figure 5d shows the time series change rate of LR in Yushu from 2000 to 2015. LR presented regional heterogeneity. The downward trend was most obvious in northern Yushu, while the increasing part was mainly distributed in southern Yushu. Due to the ecological problems caused by overgrazing and historical gold rushes in northern Yushu, the ecological environment has been deteriorating in recent years, resulting in a decrease in vegetation and leading to a decrease in the CS and LR. For southern Yushu,this is the place where human activities are most frequent, but the quality and quantity of vegetation here have shown an increase in the past 15 years. After the Yushu earthquake in April 2010, Yushu implemented natural forests protection, returning farmland to forest, key public forest, sealing off mountainous areas to facilitate afforestation, artificial afforestation and inert-roof and other ecological plans. Therefore, the results of Figure 4 show that the resumption of vegetation after the disaster achieved notable results and had a positive impact on the CS and LR of Yushu.

4.3 Change in human well-being

According to the framework of evaluation of human well-being in Yushu, the data for the country level of Yushu were obtained from the statistical yearbook, and the results were taken as shown in Table 6. The human well-being of Yushu has improved considerably from 2000-2015. Among them, the fast-growing indicators were the primary industry added value, the number of students in ordinary secondary schools and the number of technicians in hospitals and health centers, which increased by 442.3%, 284.3% and 216.8% respectively. Yushu’s economic development, culture & education and health significantly improved from 2000 to 2015. We conclude the main reasons for the increase in human well-being were as follows. (1) The construction of infrastructure by the state, such as railways and highways has made it easier for people to obtain resources, which has improved the level of well-being of economic development. (2) The well-being of health is mainly due to the increasing number of beds in hospitals and health centers. This shows that investment in medical construction by local governments has increased the level of well-being of local health. (3) The level of well-being of social security is mainly due to the increasing number of people participating in pension insurance, which reflects that the local social security measures have improved people’s living standards. (4) The well-being of culture & education improved by 284.3% from 2000 to 2015. This increase is related to financial transfer payment support from the central government and the popularization of compulsory education.
Table 6 The results of human well-being in Yushu from 2000 to 2015
Factor arrangement Target arrangement Indicator arrangement Years 2015-2000
2000 2005 2010 2015 Change rate
Economic development National
economy
Primary industry added value
(ten thousand yuan)
39,592 101,850 179,760 214,709 442.30%
Resource acquisition ability Total post and telecommunications business (ten thousand yuan) 204.2 481.2 1268.77 1160.28 82.40%
Health body health Number of beds in hospitals and health centers (bed) 667 502 839 2113 216.80%
Number of technicians in hospitals and health centers (people) 677 764 1013 1270 87.60%
Social security Social security capacity Number of people participating in pension insurance (people) 1648 7793 4877 207,813 125.10%
Culture & education Education level Number of students in ordinary secondary schools (people) 4403 6263 14,949 16,922 284.30%

4.4 Relationships among LUCC, ecosystem services and human well-being

Pearson’s correlation coefficient can reflect the degree of linear correlation between two random variables. The value of the LDI, the average value of ecosystem services and the different levels of well-being at the country scale were subjected to z-score normalization and Pearson correlation analysis was conducted in SPSS. The results are shown in Table 7.
Table 7 Pearson correlation coefficient among the LDI, ecosystem services and human well-being in Yushu
LDI WY CS SC LR Economic development Health Social security Culture & education
LDI 1
WY 0.784** 1
CS 0.755** 0.760** 1
SC 0.563* 0.918** 0.731** 1
LR 0.821** 0.763** 0.936** 0.731** 1
Economic
development
0.439 0.273 0.310 0.14 0.645** 1
Health 0.472 0.396 0.613** 0.471 0.807** 0.34 1
Social security 0.341 0.388 0.536* 0.409 0.372 0.111 0.778** 1
Culture &
education
0.502 0.325 0.625* 0.328 0.562* 0.645** 0.807** 0.559* 1

Note: * Coefficient is significant at the 0.05 level; ** Coefficient is significant at the 0.01 level

Table 7 shows that, 1) the LDI was significantly related to WY, SC, CS and LR. Land use intensity obviously affected the supply of ecosystem services. The LDI was positively correlated with all levels of well-being. This result may be because the LDI can show the level of industrialization of a city, which is closely related to economic development and directly affects the well-being of residents. 2) WY was significantly positively correlated with CS, SC, and LR, and was positively related to well-being at all levels. This result is mainly because WY directly affects the water conservation function, which in turn affects SC and LR. Moreover, Yushu is located in the Source Region of the Three Rivers, and WY is very important. It can be seen that protecting the WY of Yushu is not only beneficial to the country’s ecological security, but also beneficial to the improvement of the human well-being of residents; 3) In addition to being positively related to the well-being of economic development, CS was significantly related to other ecosystem services and well-being. CS is the basis for maintaining other services and is closely related to land use intensity and human well-being. 4) SC was significantly positively correlated with other services, and was positively correlated with other types of well-being. The vegetation coverage in Yushu directly affects the function of soil erosion regulation, and the improvement of soil erosion regulation services is conducive to improving the well-being of residents. 5) LR was significantly positively correlated with economic development, health, and cultural education. Economic development was significantly related to culture & education, and it was found that the level of education and economic development in this area developed in coordination with each other. There was a significant positive correlation among health, social security and cultural education. The improvement of the local education level in Yushu not only promoted the development of the local economy, but also improved the health and well-being of the social security of residents. This result may be due to the popularization of compulsory education in Yushu, which has improved the overall scientific quality of residents.

4.5 The driving forces of ecosystem services

This paper adapted socioeconomic factors and natural factors to explore the driving force of ecological environmental change in Yushu. The socioeconomic factors included population, GDP and lighttime lights, while the natural factors concluded DEM, slope, temperature and precipitation. Geodetector was employed to explore the contribution of various factors to ecological environment change in Yushu. The greater the value of q calculated by the geodetector was, the larger the contribution the factor has made. The result is shown in Table 8. For the WY, GDP and precipitation made the largest contributions. For the CS, GDP and population made the largest contributions. For the SC and LR, DEM and GDP made the largest contribution. To study the factors influencing the overall ecological environment, the four ecosystem services were calculated to analyze of driving forces. The results showed that precipitation, DEM, GDP and population were the main driving forces of ecological environmental change, while temperature and slope ranked second, and nighttime lights had the weakest effect. Nighttime lights can reflect the level of urbanization, and are a powerful tool for studying intensive human activities and their impact. However, nighttime lights were quite weak when explaining the ecological environmental change in Yushu. It can be explained that Yushu’s urbanization level is relatively low, and the impact on the ecological environment is very weak.
Table 8 The contribution of different factors to ecological environmental change in Yushu
Socioeconomic factors Natural factors
Population GDP Nighttime lights DEM Slope Temperature Precipitation
WY 0.352294 0.469590 0.019006 0.143787 0.176959 0.241404 0.468660
CS 0.324778 0.371162 0.024135 0.248597 0.110280 0.227714 0.199070
SC 0.557468 0.571658 0.085792 0.638585 0.179694 0.204624 0.543896
LR 0.198788 0.203982 0.025725 0.214014 0.062491 0.114455 0.168895
Total ES 0.232868 0.266229 0.03639 0.269550 0.076709 0.100156 0.273323

5 Discussion

5.1 The selection of indicators to assess human well-being

Human well-being is a concept comprising the aspects of anthropology, economics, psychology, sociology and other social sciences. The definition of human well-being remains controversial about the definition of human well-being by scholars in a different fields, as well as the evaluation indicators. We adopt Maslow’s hierarchy of needs, which is mostly used to assess human well-being, to build our assessment framework. However, due to the absence of continuous statistic data at the country level, we cannot acquire the most suitable data that we want to evaluate local human well-being. Therefore, we try to use the closest, available and continuous indicators to assess the changes in human well-being from 2000 to 2015 in Yushu. But the current evaluation indicators system has some shortcomings. First, it does not take the religious culture into consideration due to the lack of data. The Tibetan Buddhism has a profound influence on residents in their daily life, which relates to health, social security and culture & education. In addition, traditional Tibetan medicine is an important factor in impacting the health of residents. Most residents prefer to use traditional Tibetan medicine to treat illness, and the related data cannot be counted. We hope that further studies can combine subjective and objective data to conduct a comprehensive assessment of human well-being in the Qinghai-Tibet Plateau.

5.2 Changes in the quality of grassland

The results of the land use transfer matrix show that the proportion change of the land use /land cover is slight. Yushu is an ecologically fragile area, and the grassland is large. We should consider the impact of a small percentage of land structural change on the quality of grassland. NPP can characterize the quality of the terrestrial ecosystem (Crabtree et al., 2009). Therefore, we calculate related statistic indicators of NPP of grassland during 2000-2015 based on the results of Carbon Sequestration. The result is shown in Table 9. The min, max, mean and std refer to the maximum, minimum, average and standard deviation of grassland NPP in Yushu. The grassland NPP decreased in 2010, which coincides with the time of the Yushu earthquake. It can show the Yushu earthquake destroy the vegetation and damage the quality of the grassland. Generally, the quality of grassland shows an upward trend from 2000 to 2015.
Table 9 The statistic indicators of NPP of grassland in Yushu during 2000-2015
NPP (gCm‒2) 2000 2005 2010 2015
min 0.02258276 0.239085048 0.271816283 0.147701055
max 507.8461609 687.2526855 632.9970093 798.7753906
mean 254.1476171 329.777939 322.8934336 332.1697886
std 106.0422684 150.936028 131.0151992 163.9411984
There are two main idea that contributes to the increase in vegetation growth in Qinghai-Tibet Plateau. One is the ecological engineering improves the ecological environment, especially in the eco-fragile region. Others think the warming and humidification of climate in the Qinghai-Tibet Plateau promotes vegetation growth (Zhou et al., 2019). Although there are many studies committed to addressing this problem (Guo et al., 2020; Yuan et al., 2021). There is a study to explore the impact of climate change and ecological engineering (Liu and Zeng, 2019), and the results show that ecological engineering has a greater impact on vegetation growth than the warming and humidification in the Sanjiangyuan national natural reserve area. As mentioned above, the changes in the ecological environment of Yushu should be the results of the combined effects of natural and human factors.

5.3 Change in land cover from 1940 to 2015

The simulated map of the native land cover of Yushu came from the research results of the Institute of Botany, Chinese Academy of Sciences, it refers to the natural land cover without human disturbance, which approximately refers to the land cover status of Yushu in 1940. To show the effect of human activities on the LUCC of Yushu, the simulated map of native land cover was compared with the LUCC of 2015 in Yushu, and the results of the effects of human activities on land use transformation were acquired after spatial analysis in ArcGIS. A transformation type whose area was larger than 500 km2 was selected for making. The results are shown in Figure 6. According to statistical analysis, the transformation modes under human activities in Yushu are: grassland to bare land, forest land to grassland, grassland to water body, grassland to forest land, bare land to grassland, and bare land to forest land.
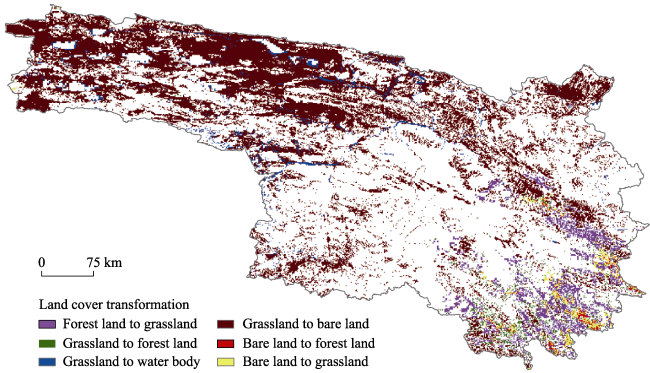
Figure 6 Land cover transformation in Yushu under human activity interference
The conversion of grassland into bare land was mainly distributed in northwestern Yushu. This region is mainly an alpine meadow area, and the ecology is extremely fragile. Due to the development of animal husbandry, the degradation of grasslands is serious. The conversion of forest land to grassland mainly occurred in southeastern Yushu. This region is the municipal capital of Yushu, and economic development leading to intense human activities has damaged the ecology. The conversion of grassland into water body mainly occurred in northwestern Yushu. This was mainly caused by glacial ablation, which reflects that global climate change has had an adverse impact on Yushu. However, the conversion of grassland into forest land, the conversion of bare land into grassland and the conversion of bare land into forest land are a series of positive effects caused by ecological projects.
Generally, compared with the simulated map without human activity effects, the LUCC of Yushu is dominated by two aspects: human activities and climate change lead to ecological environment deterioration, such as grassland degeneration and an increase in water body; a series of ecological projects have had positive effects.

5.4 Recommendations

According to the results of this paper, we provide policies and recommendations for increasing human well-being under sustainable development in Yushu:
(1) The government needs to introduce corresponding policies to address the impact of environmental deterioration. According to the results of LUCC, water body has increased 6.24% and ice/snow has decreased 3.5% in past 15 years. It is evident that climate change brings a series of environmental problems to Yushu, such as glacial ablation, the thawing of permafrost, and the increase in lakes and wetlands. But the driving force analysis shows that the urbanization has the lowest impact among the factors participating in analyse. The urbanization of Yushu is relatively low and the impact of human activities is minimal which has had a limited impact on the ecological environment. However, changes in natural factors (climate change, natural disasters, etc.) have a very large impact on the ecological environment, and it is essential to develop scientific and timely policies.
(2) Ecological projects should continue to be implemented in Yushu. According to the analyses of ecosystem services in Yushu in past 15 years, the ecological environment has improved a lot, which can be partly attributed to the contribution of ecological engineering. Yushu has a high average altitude, and the ecosystem is very fragile. The ecosystem structure and function are simple. When the ecosystem is interfered with, its regulatory mechanism does not completely recover, and the problem of ecological environmental deterioration in Yushu is difficult to address with rapid and comprehensive short-term governance. For the sustainable development of Yushu, ecological projects need to continue long-term implementation strategies, and the corresponding ecological compensation should be extended.
(3) The investment in education in Yushu should increase, and the improvement of CS should be a focus. According to the results of coupling relationship among LUCC, ecosystem services and human well-being, culture &education has a correlation coefficient of 0.625 with CS, 0.562 with LR, and 0.645 with economic development, 0.807 with health and 0.559 with social security. Therefore, the improvement of the well-being of culture &education can not only improve other types of well-being, but also increase the ecosystem services in Yushu.

6 Conclusions

This paper integrated meteorological data, soil data, remote sensing data and other geographic data with socioeconomic data to study the LUCC, ecosystem services and human well-being from 2000 to 2015 in Yushu. Land-use change and land intensity change were identified. The spatiotemporal change trend of ecosystem services based on the pixel scale was researched. Furthermore, this paper explored the difficult relationships among LUCC, ecosystem services and human well-being from 2000 to 2015 in Yushu. Finally, the geodetector was employed to study the contribution of socioeconomic and natural factors to ecological environmental changes in Yushu. The main conclusions of the study are as follows:
(1) The ecological structure was basically stable. The areas of forest land, grassland, farmland and ice/snow have decreased, while the area of water body, urban land and bare land have increased. Although ecological problems such as vegetation degradation and glacial ablation are serious, ecological projects such as afforestation, returning farmland to forest and artificial grassland have played a positive role in restoring the environment. Therefore, the land use intensity of Yushu can be maintained in a relatively low range.
(2) The change in WY is spatially heterogeneous. Specifically, the WY in southern Yushu is decreasing while WY in northern Yushu is increasing. The CS in southern Yushu is increasing while is decreasing in a small part of eastern Yushu. The SC continues to increasing, which shows the effectiveness of ecological environment management in Yushu. LR is increasing, but there is obvious regional heterogeneity. The most obvious increase was in the southern part of Yushu. The evaluation results of ecosystem services showed that although the overall ecological environment of Yushu has been developing in a good direction, ecological environmental problems still exist in some small areas.
(3) The well-being of economic development, health, social security and culture & education are all obviously increasing. The well-being of culture & education is prominent among the various well-being indicators. This result is not only significantly related to CS and LR, but also has a significant positive correlation with other types of well-being.
(4) To improve human well-being under the sustainable development of society and the environment, the government of Yushu should increase education investment and concentrate on improving CS.
[1]
Bai Y, Ochuodho T O, Yang J, 2019. Impact of land use and climate change on water-related ecosystem services in Kentucky, USA. Ecological Indicators, 102: 51-64.

DOI

[2]
Bohensky E L, Reyers B, Van Jaarsveld A S, 2010. Future ecosystem services in a Southern African river basin: A scenario planning approach to uncertainty. Conservation Biology, 20(4): 1051-1061.

DOI

[3]
Bongaarts J, 2019. Summary for policymakers of the global assessment report on biodiversity and ecosystem services of the Intergovernmental Science-Policy Platform on Biodiversity and Ecosystem Services. Population and Development Review, 45(3): 680-681.

[4]
Brown M T, Vivas M B, 2005. Landscape development intensity index. Environmental Monitoring & Assessment, 101(1-3): 289-309.

[5]
Bunsen J, Berger M, Finkbeiner M, 2021. Planetary boundaries for water: A review. Ecological Indicators, 121: 107022.

DOI

[6]
Cabral P, Feger C, Levrel H et al., 2016. Assessing the impact of land-cover changes on ecosystem services: A first step toward integrative planning in Bordeaux, France. Ecosystem Services, 22: 318-327.

DOI

[7]
Che L, Zhou L, Xu J, 2021. Integrating the ecosystem service in sustainable plateau spatial planning: A case study of the Yarlung Zangbo River Basin. Journal of Geographical Sciences, 31(2): 281-297.

DOI

[8]
Chen C, Park T, Wang X et al., 2019. China and India lead in greening of the world through land-use management. Nature Sustainability, 2(2): 122-129.

DOI PMID

[9]
Chen W, Zhao H, Li J et al., 2020. Land use transitions and the associated impacts on ecosystem services in the middle reaches of the Yangtze River Economic Belt in China based on the geo-informatic Tupu method. The Science of the Total Environment, 701: 134690.

DOI

[10]
Chillo V, Vázquez D P, Amoroso M M et al., 2018. Land use intensity indirectly affects ecosystem services mainly through plant functional identity in a temperate forest. Functional Ecology, 32(5): 1390-1399.

DOI

[11]
Chu H, Wei J, Qiu J et al., 2019. Identification of the impact of climate change and human activities on rainfall-runoff relationship variation in the Three-River Headwaters region. Ecological Indicators, 106: 105516.

DOI

[12]
Crabtree R, Potter C, Mullen R et al., 2009. A modeling and spatio-temporal analysis framework for monitoring environmental change using NPP as an ecosystem indicator. Remote Sensing of Environment, 113(7): 1486-1496.

DOI

[13]
Cui F, Wang B, Zhang Q et al., 2020. Climate change versus land-use change: What affects the ecosystem services more in the forest-steppe ecotone? Science of the Total Environment, 759: 143525.

DOI

[14]
Du Q, Zhang M, Wang S et al., 2019. Changes in air temperature over China in response to the recent global warming hiatus. Journal of Geographical Sciences, 29(4): 496-516.

DOI

[15]
Farella G, Menegon S, Fadini A et al., 2020. Incorporating ecosystem services conservation into a scenario-based MSP framework: An Adriatic case study. Ocean & Coastal Management, 193: 105230.

[16]
Fedele G, Locatelli B, Djoudi H, 2017. Mechanisms mediating the contribution of ecosystem services to human well-being and resilience. Ecosystem Services, 28: 43-54.

DOI

[17]
Gao H, Li Z, Peng Li et al., 2016. The capacity of soil loss control in the Loess Plateau based on soil erosion control degree. Journal of Geographical Sciences, 26(4): 457-472.

DOI

[18]
Gomes L C, Bianchi F J J A, Cardoso I M et al., 2020. Land use change drives the spatio-temporal variation of ecosystem services and their interactions along an altitudinal gradient in Brazil. Landscape Ecology, 35(7): 1571-1586.

DOI

[19]
Guo B, Han B, Yang F et al., 2020. Determining the contributions of climate change and human activities to the vegetation NPP dynamics in the Qinghai-Tibet Plateau, China, from 2000 to 2015. Environmental Monitoring and Assessment, 192(10): 663.

DOI PMID

[20]
Han Z, Long D, Fang Y et al., 2019. Impacts of climate change and human activities on the flow regime of the dammed Lancang River in Southwest China. Journal of Hydrology, 570: 96-105.

DOI

[21]
Jiang C, Zhang L, 2015. Climate change and its impact on the eco-environment of the Three-Rivers Headwater Region on the Tibetan Plateau, China. International Journal of Environmental Research and Public Health, 12(10): 12057-12081.

DOI PMID

[22]
Lavorel S, Grigulis K, Leitinger G et al., 2017. Historical trajectories in land use pattern and grassland ecosystem services in two European alpine landscapes. Regional Environmental Change, 17(8): 2251-2264.

DOI

[23]
Lester D, 2013. Measuring Maslow’s hierarchy of needs. Psychological Reports, 113(1): 15-17.

DOI

[24]
Lin T, Xue X, Shi L et al., 2013. Urban spatial expansion and its impacts on island ecosystem services and landscape pattern: A case study of the island city of Xiamen, Southeast China. Ocean & Coastal Management, 81: 90-96.

[25]
Liu F, Zeng Y, 2019. Spatial-temporal change in vegetation net primary productivity and its response to climate and human activities in Qinghai Plateau in the past 16 years. Acta Ecologica Sinica, 39(5): 1528-1540. (in Chinese)

[26]
Lufafa A, Tenywa M M, Isabirye M et al., 2003. Prediction of soil erosion in a Lake Victoria basin catchment using a GIS-based Universal Soil Loss model. Agricultural Systems, 76(3): 883-894.

DOI

[27]
Mack J J, 2006. Landscape as a predictor of wetland condition: An evaluation of the landscape development index (LDI) with a large reference wetland dataset from Ohio. Environmental Monitoring & Assessment, 120(1-3): 221-241.

[28]
Margriter S C, Bruland G L, Kudray G M et al., 2014. Using indicators of land-use development intensity to assess the condition of coastal wetlands in Hawaii. Landscape Ecology, 29(3): 517-528.

DOI

[29]
Matamala R, Gonzàlez-Meler M A, Jastrow J D et al., 2003. Impacts of fine root turnover on forest NPP and soil sequestration potential. Science, 302(5649): 1385-1387.

PMID

[30]
Millennium Ecosystem Assessment (MEA), 2005. Ecosystems and human well-being: Synthesis. World Health, 1134: 25-60.

[31]
Ouyang Z, Zheng H, Xiao Y et al., 2016. Improvements in ecosystem services from investments in natural capital. Science, 352(6292): 1455-1459.

DOI PMID

[32]
Qi S, Jiang M, Yu X, 2011. Evaluating soil erosion in Jiangxi Province with USLE model and remote sensing technology during 1995-2005. China Environmental Science, 31(7): 1197-1203. (in Chinese)

[33]
Quintas-Soriano C, Castro A J, Castro H et al., 2016. Impacts of land use change on ecosystem services and implications for human well-being in Spanish drylands. Land Use Policy, 54: 534-548.

DOI

[34]
Reiss K C, Hernandez E, Brown M T, 2014. Application of the landscape development intensity (LDI) index in wetland mitigation banking. Ecological Modelling, 271: 83-89.

DOI

[35]
Riao D, Zhu X, Tong Z et al., 2020. Study on land use/cover change and ecosystem services in Harbin, China. Sustainability, 12(15): 6067.

DOI

[36]
Schirpke U, Leitinger G, Tasser E et al., 2013. Multiple ecosystem services of a changing alpine landscape: Past, present and future. International Journal of Biodiversity Science Ecosystem Services & Management, 9(2): 123-35.

[37]
Schneider F, Feurer M, Lundsgaard-Hansen LM et al., 2020. Sustainable development under competing claims on land: Three pathways between land-use changes, ecosystem services and human well-being. The European Journal of Development Research, 32(2): 316-337.

DOI

[38]
Sharma R, Rimal B, Baral H et al., 2019. Impact of land cover change on ecosystem services in a tropical forested landscape. Resources, 8(1): 18.

DOI

[39]
Shi L, Halik U, Mamat Z et al., 2020. Spatio-temporal variation of ecosystem services value in the Northern Tianshan Mountain Economic Zone from 1980 to 2030. Peerj, 8: e9582.

DOI

[40]
Steffen W, Richardson K, Rockstrom J et al., 2015. Planetary boundaries: Guiding human development on a changing planet. Science, 347(6223): 1259855.

DOI

[41]
Talukdar S, Singha P, Shahfahad et al., 2020. Dynamics of ecosystem services (ESs) in response to land use land cover (LU/LC) changes in the lower Gangetic plain of India. Ecological Indicators, 112: 106121.

DOI

[42]
Tang Z, Mei Z, Liu W et al., 2020. Identification of the key factors affecting Chinese carbon intensity and their historical trends using random forest algorithm. Journal of Geographical Sciences, 30(5): 743-756.

DOI

[43]
Wallis T W R, Griffiths J F, 1995. An assessment of the weather generator (WXGEN) used in the erosion/productivity impact calculator (EPIC). Agricultural and Forest Meteorology, 73(1/2): 115-133.

DOI

[44]
Wang J, Li X, George C et al., 2010. Geographical detectors-based health risk assessment and its application in the neural tube defects study of the Heshun region, China. International Journal of Geographical Information Science, 24(1): 107-127.

DOI

[45]
Wang J, Xu C, 2017. Geodetector: Principle and prospective. Acta Geographica Sinica, 72(1): 116-134. (in Chinese)

DOI

[46]
Wang X, Dong X, Liu H et al., 2017. Linking land use change, ecosystem services and human well-being: A case study of the Manas River Basin of Xinjiang, China. Ecosystem Services, 27: 113-123.

DOI

[47]
Wang Y, Dai E, Yin E et al., 2018. Land use/land cover change and the effects on ecosystem services in the Hengduan Mountain region, China. Ecosystem Services, 34: 55-67.

DOI

[48]
Wen Z, Zheng H, Smith J R et al., 2019. Functional diversity overrides community-weighted mean traits in linking land-use intensity to hydrological ecosystem services. Science of the Total Environment, 682: 583-590.

DOI

[49]
Wischmeier W H, Mannering J V, 1969. Relation of soil properties to its erodibility. Soil Science Society of America Journal, 33(1): 131-137.

DOI

[50]
Xu Y, Tang H, Wang B et al., 2016. Effects of land-use intensity on ecosystem services and human well-being: A case study in Huailai County, China. Environmental Earth Sciences, 75(5): 416.

DOI

[51]
Yao Y, Zhou G, Wang Y-C, 2019. Spatial patterns and driving forces of land change in Tibetan-inhabited Three Rivers Headwaters region, China. Journal of Mountain Science, 16(1): 207-225.

DOI

[52]
Yuan Q, Yuan Q, Ren P, 2021. Coupled effect of climate change and human activities on the restoration/degradation of the Qinghai-Tibet Plateau grassland. Journal of Geographical Sciences, 31(9): 1299-1327.

DOI

[53]
Zhang H, Yang Q, Li R et al., 2013. Extension of a GIS procedure for calculating the RUSLE equation LS factor. Computers & Geosciences, 52: 177-188.

DOI

[54]
Zhang L, Hickel K, Dawes W R et al., 2004. A rational function approach for estimating mean annual evapotranspiration. Water Resources Research, 40(2): W02502.

[55]
Zhou D, Hao L, Kim J B et al., 2019. Potential impacts of climate change on vegetation dynamics and ecosystem function in a mountain watershed on the Qinghai-Tibet Plateau. Climatic Change, 156(1): 31-50.

DOI

[56]
Zhu W, Pan Y, Zhang J, 2007. Estimation of net primary productivity of Chinese terrestrial vegetation based on remote sensing. Acta Phytoecologica Sinica, 31(3): 413-424. (in Chinese)

Outlines

/