
Journal of Geographical Sciences >
Spatio-temporal variations in ecological spaces and their ecological carrying status in China’s mega-urban agglomerations
|
Wang Shihao (1995-), PhD Candidate, specialized in remote sensing of the ecology. E-mail: wangsh.20b@igsnrr.ac.cn |
Received date: 2022-03-27
Accepted date: 2022-05-17
Online published: 2022-11-25
Supported by
The Strategic Priority Research Program of the Chinese Academy of Sciences(XDA20010202)
The Strategic Priority Research Program of the Chinese Academy of Sciences(XDA20010302)
The rapid expansion of China’s urban agglomerations in recent decades has resulted in over-occupied ecological spaces and increased ecological pressure that are restricting healthy regional development. This paper examines the structure and characteristics of distribution of “production-living-ecological” spaces in five mega-urban agglomerations in China: Beijing-Tianjin-Hebei (BTH), the Yangtze River Delta (YRD), Guangdong-Hong Kong-Macao Greater Bay Area (GBA), Chengdu-Chongqing (CY), and the middle reaches of the Yangtze River (MYR). We analyze spatial and temporal variations in the ecological spaces and factors influencing them from 1990 to 2020, and examine the comprehensive ecological carrying capacity and status of ecological spaces in the past 30 years based on the available water resources, regulation of water and air quality, and leisure and recreation. The results show the following: (1) Urban agglomerations in different stages of formation and development represent varying area ratios of “ecological-production-living” spaces. The modes of expansion and evolution of the living spaces are dominated by multi-center combinations as well as the spatial structure of ecological spaces, including barrier, compact, discrete, and fully enveloping spaces. (2) From 1990 to 2020, the area occupied by living spaces in urban agglomerations continued to increase significantly while that of spaces for ecological production decreased. Except in the GBA, ecological spaces have exhibited a trend of increase in area, especially in the past 10 years. The area ratios and spatio-temporal variations in the “production-living-ecological” spaces indicate that the main functions of production and ecological spaces in mega-urban agglomerations have shifted from supply to regulation and culture, and reflect the transition from rapid urbanization to sustainable urbanization in China. (3) The comprehensive ecological carrying capacities of 78.6%, 73.1%, 54.5%, 56.3%, and 25.8% of cities in BTH, YRD, GBA, CY and MYR are severely overburdened. Water supply and the regulation of water quality are the main factors restricting the ecological carrying capacity of BTH and YRD while leisure and recreation services have hindered the capacities of GBA and CY. Policymakers thus need to pay attention to the conservation and rational layout of ecological spaces to reduce the ecological pressure in urban agglomerations. The work here can provide a scientific basis for the green and sustainable development of urban agglomerations as well as the optimized configuration of “production-living-ecological” spaces.
WANG Shihao , HUANG Lin , XU Xinliang , LI Jiahui . Spatio-temporal variations in ecological spaces and their ecological carrying status in China’s mega-urban agglomerations[J]. Journal of Geographical Sciences, 2022 , 32(9) : 1683 -1704 . DOI: 10.1007/s11442-022-2018-1
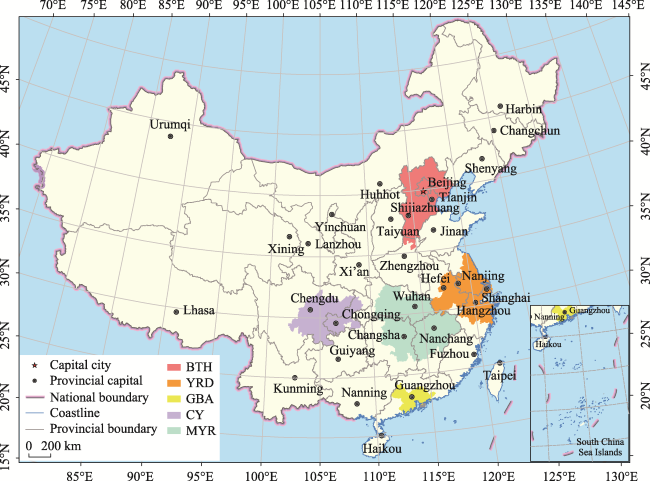
Figure 1 Distribution of five mega-urban agglomerations in China |
Table 1 Yield factors of water resources for different provinces in mega-urban agglomerations of China |
| Region | Beijing | Tianjin | Hebei | Henan | Shanghai | Jiangsu | Zhejiang | Anhui | Guangdong | Chongqing | Sichuan | Hubei | Jiangxi | Hunan |
|---|---|---|---|---|---|---|---|---|---|---|---|---|---|---|
| Yield factors | 0.77 | 0.41 | 0.4 | 0.78 | 1.39 | 1.02 | 2.81 | 1.54 | 3.21 | 2.04 | 1.76 | 1.68 | 2.71 | 2.45 |
Table 2 Classification for ecological carrying capacity |
| Ecosystem service | Ecological carrying status and thresholds | ||||
|---|---|---|---|---|---|
| High surplus | Surplus | Balanced | Overloaded | Severely overloaded | |
| Water resources supply | 0-0.4 | 0.4-0.8 | 0.8-1.2 | 1.2-5 | >5 |
| Water quality regulation | 0-0.4 | 0.4-0.8 | 0.8-1.2 | 1.2-5 | >5 |
| Air quality regulation | 0-0.2 | 0.2-0.5 | 0.5-1.5 | 1.5-10 | >10 |
| Leisure and recreation | 0-0.4 | 0.4-0.8 | 0.8-1.2 | 1.2-10 | >10 |
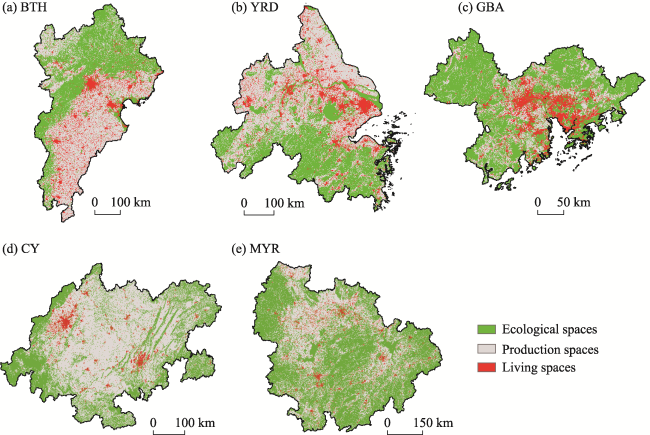
Table 3 Statistics of ecological-production-living spaces in mega-urban agglomerations of China in 2020 |
| Type | Statistical indicator | BTH | YRD | GBA | CY | MYR |
|---|---|---|---|---|---|---|
| Ecological spaces | Area (106 ha) | 9.04 | 8.47 | 3.49 | 7.02 | 20.96 |
| Area percentage (%) | 40.54 | 40.16 | 63.33 | 36.38 | 59.96 | |
| Production spaces | Area (106 ha) | 10.33 | 9.68 | 1.20 | 11.53 | 12.42 |
| Area percentage (%) | 46.31 | 45.87 | 21.83 | 59.74 | 35.53 | |
| Living spaces | Area (106 ha) | 2.93 | 2.95 | 0.82 | 0.75 | 1.58 |
| Area percentage (%) | 13.15 | 13.97 | 14.84 | 3.88 | 4.51 |
Figure 2 Distribution of ecological-production-living spaces in mega-urban agglomerations of China in 2020 |
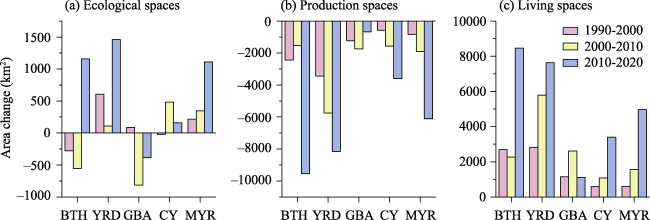
Figure 3 Changes in the area of ecological-production-living spaces in mega-urban agglomerations of China in 1990-2020 |
Table 4 Ecological spaces and changes in mega-urban agglomerations of China during 1990-2020 |
| Time | Statistical indicator | BTH | YRD | GBA | CY | MYR | |
|---|---|---|---|---|---|---|---|
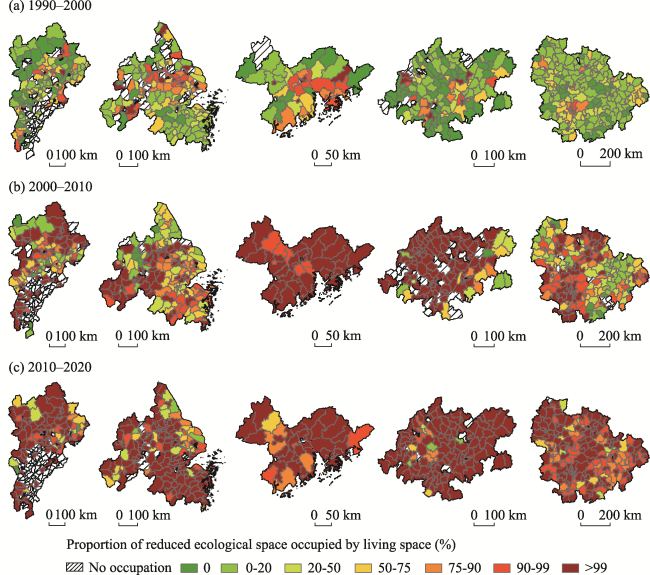
| 1990-2000 | Changes in area of ecological spaces (ha) | -27799 | 60925 | 8806 | -2235 | 21633 | |
| Percentage of area change (%) | -0.12 | 0.29 | 0.17 | -0.01 | 0.06 | ||
| Counties with increased ecological spaces (%) | 31.75 | 62.80 | 42.86 | 39.58 | 47.60 | ||
| Counties with unchanged ecological spaces (%) | 25.12 | 7.25 | 2.04 | 6.25 | 0.00 | ||
| Counties with reduced ecological spaces (%) | 43.13 | 29.95 | 55.10 | 54.17 | 52.40 | ||
| Area of ecological spaces occupied by living spaces (ha) | 27775 | 15998 | 43675 | 2346 | 17425 | ||
| Proportion of reduced ecological spaces occupied by living spaces (%) | 32.96 | 24.06 | 72.22 | 13.11 | 23.66 | ||
| Percentage of number of counties with different ranges of proportions of living spaces occupying ecological spaces (%) | ≥90% | 6.64 | 16.43 | 34.69 | 11.11 | 8.30 | |
| 50%-90% | 12.32 | 17.39 | 24.49 | 9.72 | 17.03 | ||
| <50% | 43.60 | 41.06 | 36.73 | 66.67 | 74.24 | ||
| No occupation | 37.44 | 25.12 | 4.08 | 12.50 | 0.44 | ||
| 2000-2010 | Changes in area of ecological spaces (ha) | -55291 | 10889 | -81350 | 48152 | 34822 | |
| Percentage of area change (%) | -0.28 | 0.02 | -1.55 | 0.25 | 0.10 | ||
| Counties with increased ecological spaces (%) | 23.70 | 39.61 | 20.41 | 74.31 | 58.08 | ||
| Counties with unchanged ecological spaces (%) | 26.07 | 4.35 | 2.04 | 2.78 | 0.44 | ||
| Counties with reduced ecological spaces (%) | 50.24 | 56.04 | 77.55 | 22.92 | 41.48 | ||
| Area of ecological spaces occupied by living spaces (ha) | 43500 | 49811 | 116735 | 7754 | 50685 | ||
| Proportion of reduced ecological spaces occupied by living spaces (%) | 53.45 | 63.46 | 99.03 | 69.37 | 60.46 | ||
| Percentage of number of counties with different ranges of proportions of living spaces occupying ecological spaces (%) | ≥90% | 38.86 | 52.17 | 97.96 | 70.83 | 50.66 | |
| 50%-90% | 10.90 | 21.74 | 0.00 | 5.56 | 22.27 | ||
| <50% | 12.80 | 19.32 | 0.00 | 6.25 | 24.45 | ||
| No occupation | 37.44 | 6.76 | 2.04 | 17.36 | 2.62 | ||
| 2010-2020 | Changes in area of ecological spaces (ha) | 115946 | 146102 | -38333 | 16079 | 110911 | |
| Percentage of area change (%) | 0.50 | 0.52 | -0.76 | 0.09 | 0.32 | ||
| Counties with increased ecological spaces (%) | 52.61 | 68.12 | 48.98 | 77.78 | 66.81 | ||
| Counties with unchanged ecological spaces (%) | 2.84 | 0.97 | 0.00 | 0.00 | 0.00 | ||
| Counties with reduced ecological spaces (%) | 44.55 | 30.92 | 51.02 | 22.22 | 33.19 | ||
| Area of ecological spaces occupied by living spaces (ha) | 12756 | 39322 | 25037 | 13551 | 101289 | ||
| Proportion of reduced ecological spaces occupied by living spaces (%) | 83.38 | 79.08 | 96.65 | 93.26 | 95.67 | ||
| Percentage of number of counties with different ranges of proportions of living spaces occupying ecological spaces (%) | ≥90% | 42.65 | 71.01 | 81.63 | 81.94 | 82.10 | |
| 50%-90% | 4.74 | 8.21 | 10.20 | 4.86 | 12.66 | ||
| <50% | 3.32 | 6.76 | 0.00 | 4.17 | 1.75 | ||
| No occupation | 49.29 | 14.01 | 8.16 | 9.03 | 3.49 | ||
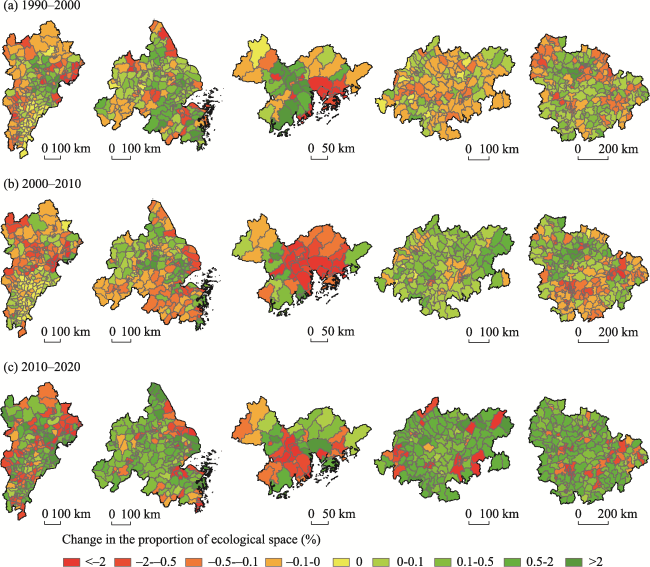
Figure 4 Proportional changes in ecological spaces at the county scale in mega-urban agglomerations of China in 1990-2010 |
Figure 5 The proportion of ecological spaces occupied by living spaces in mega-urban agglomerations of China |
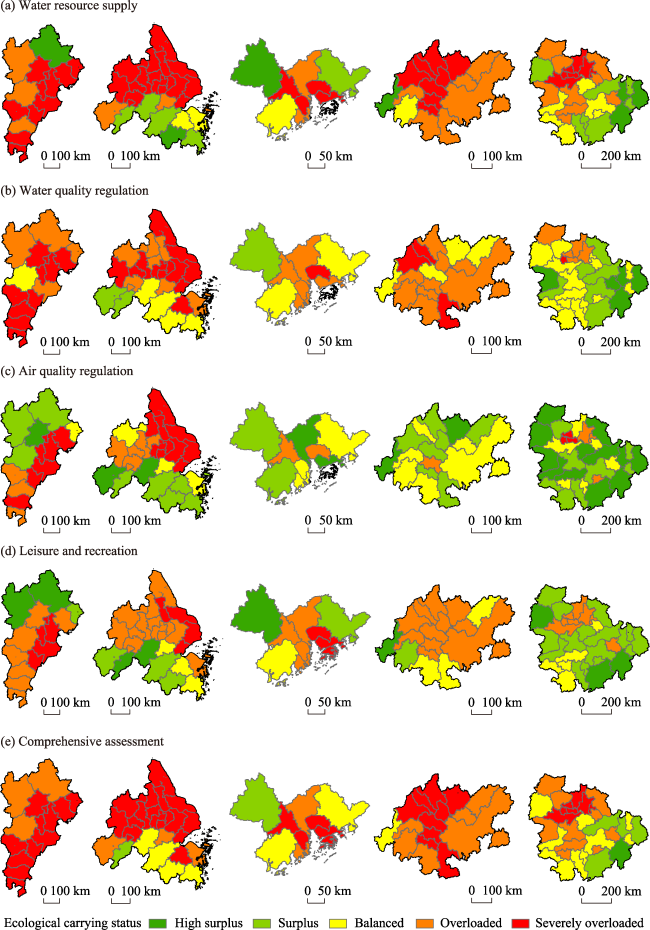
Figure 6 Distribution of ecological carrying status of ecological spaces in mega-urban agglomerations of China |
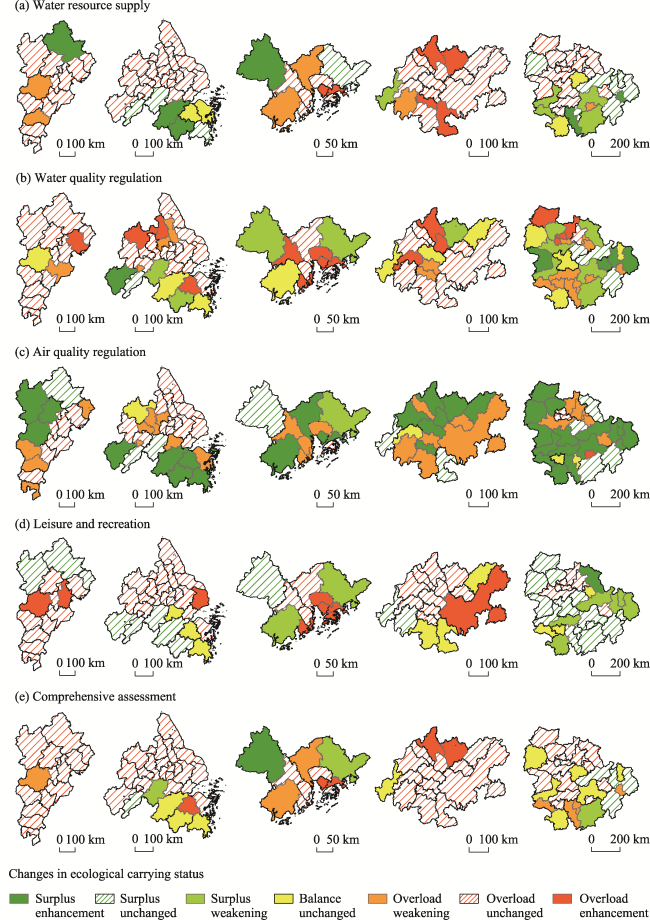
Figure 7 Distribution of changes in ecological carrying status in mega-urban agglomerations of China in 1990-2020 |
| [1] |
|
| [2] |
|
| [3] |
|
| [4] |
CPC Central Committee,
|
| [5] |
CPC Central Committee,
|
| [6] |
|
| [7] |
|
| [8] |
|
| [9] |
|
| [10] |
|
| [11] |
|
| [12] |
|
| [13] |
|
| [14] |
|
| [15] |
|
| [16] |
|
| [17] |
|
| [18] |
|
| [19] |
|
| [20] |
|
| [21] |
|
| [22] |
|
| [23] |
|
| [24] |
|
| [25] |
|
| [26] |
|
| [27] |
|
| [28] |
|
| [29] |
|
| [30] |
|
| [31] |
|
| [32] |
|
| [33] |
|
| [34] |
|
| [35] |
|
| [36] |
|
| [37] |
|
| [38] |
|
| [39] |
|
| [40] |
|
| [41] |
|
| [42] |
|
| [43] |
|
| [44] |
|
| [45] |
|
| [46] |
National Environmental Protection Agency, 1998. National Biodiversity Study in China. Beijing: China Environmental Science Press. (in Chinese)
|
| [47] |
NDRC, 2015. Development Planning of the middle reaches of the Yangtze River. https://www.ndrc.gov.cn/xwdt/ztzl/xxczhjs/ghzc/201605/t20160512_20971938.html2015-04-13. (in Chinese)
|
| [48] |
NDRC, MHURC, 2016a. Development Planning of Yangtze River Delta Urban Agglomerations. http://www.gov.cn/xinwen/2016-2006/2003/content_5079264.htm2016-06-03. (in Chinese)
|
| [49] |
NDRC, MHURC, 2016b. Development Planning of Chengdu-Chongqing City Group. https://www.ndrc.gov.cn/xxgk/zcfb/ghwb/201605/t20160504_20962182.html2016-04-27. (in Chinese)
|
| [50] |
|
| [51] |
|
| [52] |
Political Bureau of the CPC Central Committee, 2015. Outline of Beijing-Tianjin-Hebei Cooperative Development Planning. (in Chinese)
|
| [53] |
|
| [54] |
|
| [55] |
|
| [56] |
|
| [57] |
|
| [58] |
|
| [59] |
|
| [60] |
|
| [61] |
|
| [62] |
|
| [63] |
|
| [64] |
|
| [65] |
|
| [66] |
|
| [67] |
|
| [68] |
|
| [69] |
|
| [70] |
|
| [71] |
|
| [72] |
|
| [73] |
|
| [74] |
|
| [75] |
|
| [76] |
|
| [77] |
|
| [78] |
|
| [79] |
|
| [80] |
|
| [81] |
|
| [82] |
|
| [83] |
|
/
| 〈 |
|
〉 |