Original article

The study of artificial intelligence for predicting land use changes in an arid ecosystem

  • YU Yang , 1 ,
  • CAO Yiguo 2, * ,
  • HOU Dongde 2 ,
  • DISSE Markus 3 ,
  • BRIEDEN Andreas 4 ,
  • ZHANG Haiyan 1 ,
  • YU Ruide 1
Expand
  • 1. State Key Laboratory of Desert and Oasis Ecology, Xinjiang Institute of Ecology and Geography, CAS, Urumqi 830011, China
  • 2. Advanced Research Institute, Southwest University of Political Science & Law, Chongqing 401120, China
  • 3. Chair of Hydrology and River Basin Management, Technical University of Munich, Munich 80333, Germany
  • 4. Chair of Statistics and Risk Management, Universitaet der Bundeswehr Muenchen, Neubiberg D-85577, Germany
*Cao Yiguo, Lecturer, specialized in law science of copyright and artificial intelligence.

Yu Yang, Associate Professor, specialized in environmental change in arid lands. E-mail:

Received date: 2021-08-10

  Accepted date: 2022-01-13

  Online published: 2022-06-25

Supported by

Chinese Academy of Sciences “Light of West China” Program(No.2018-XBQNXZ-B-017)

National Natural Science Foundation of China(No.42107084)

Philosophy and Social Science Major Project funded by the Ministry of Education of the People’s Republic of China(No.20JZD026)

Abstract

During the 21st century, artificial intelligence methods have been broadly applied in geosciences to simulate complex dynamic ecosystems, but the use of artificial intelligence (AI) methods to reproduce land-use/cover change (LUCC) in arid ecosystems remains rare. This paper presents a hybrid modeling approach to understand the complexity in LUCC. Fuzzy logic, equation-based systems, and expert systems are combined to predict LUCC as determined by water resources and other factors. The driving factors of LUCC in this study include climate change, ecological flooding, groundwater conditions, and human activities. The increase of natural flooding was found to be effective in preventing vegetation degradation. LUCCs are sensitive under different climate projections of RCP2.6, RCP4.5, and RCP8.5. Simulation results indicate that the increase of precipitation is not able to compensate for the additional evaporation losses resulting from temperature increases. The results indicate that grassland, shrub, and riparian forest regions will shrink in this study area. The change in grasslands has a strong negative correlation with the change in groundwater salinity, whereas forest change had a strong positive correlation with ecological flooding. The application of artificial intelligence to study LUCC can guide land management policies and make predictions regarding land degradation.

Cite this article

YU Yang , CAO Yiguo , HOU Dongde , DISSE Markus , BRIEDEN Andreas , ZHANG Haiyan , YU Ruide . The study of artificial intelligence for predicting land use changes in an arid ecosystem[J]. Journal of Geographical Sciences, 2022 , 32(4) : 717 -734 . DOI: 10.1007/s11442-022-1969-6

1 Introduction

Artificial intelligence (AI) is currently used in geoscience research to address problems related to complex systems (Das et al., 2015). In the field of human geography, researchers have sought computational solutions to problems involving both numeric and symbolic data (Parker et al., 2003) and applied them in various ways, including the study of land use and cover change (LUCC) (Scott et al., 2017). A new generation of AI technology provides opportunities to use more flexible and nonlinear approaches that better reproduce the true behavior of LUCC in rapidly evolving environments (Carrero et al., 2014). Several AI methods have been applied in predicting LUCC based on remote sensing images (Khler and Kuenzer, 2020), but investigations of the underlying causes are less common. One important reason for this lack of studies is the absence of systematic logical relationships among land use variables. AI systems may contain an algorithm layer (e.g., machining learning), cognitive layer, and data layer. Machine learning methods often require a large amount of training data. When lacking enough training data, a relational database would improve an AI system to recognize and reproduce the true trends of LUCC.
In recent years, AI technologies have been increasingly used to extract patterns and insights from geospatial data (Rogan et al., 2008; Qian et al., 2015; Reichstein et al., 2019). A long short-term memory method was successfully applied for forecasting LUCC in British Columbia, Canada (Duynhoven and Dragievi, 2019). A random forest-based machine learning model achieved high validation accuracy in predicting the spectral band information of satellite images (Patil et al., 2017). Tian et al. (2020) proposed a novel feature descriptor to improve the accuracy of change detection on high-resolution satellite images. Termeh et al. (2018) integrated adaptive neuro-fuzzy inference systems with different metaheuristic algorithms in solving flood susceptibility mapping problems. Choubin et al. (2017) used a fuzzy c-means clustering method to identify homogeneous hydrological watersheds by remote sensing indices. Sajedi-Hosseini et al. (2018) utilized a fuzzy analytical network process for spatial prediction of soil erosion susceptibility, achieving high model accuracy. In these previous studies, AI technologies have shown many advantages in dealing with complexity and accuracy issues for LUCC prediction. If the interactions among the atmosphere, hydrosphere, lithosphere, anthroposphere, and biosphere could be better understood by machine learning, it would improve the application of AI technologies for studying LUCC.
Compared to other ecosystems, arid ecosystems often have lower biodiversity and population densities (Zhang et al., 2020), making them model systems because of the reduced model complexity. In arid regions, natural vegetation is highly dependent on the groundwater level (Zhang et al., 2014; Sun et al., 2021) and salinity (Xu et al., 2014). Decision-makers have thus monitored groundwater conditions to predict the growth of natural plants. However, the simulation of these processes remains rare, partly because the use of AI in geoscience is still in its early stages (Bergen et al., 2019), with much room remaining to utilize cross-disciplinary approaches. For instance, a recent pioneer study of fuzzy analytical network process on soil erosion was carried out in Iran (Sajedi-Hosseini et al., 2018), but the temporal predictions were not made because of the absence of agro-hydro-soil models. Another reason for the lack of studies in this area is the absence of simulation and analytical methods that apply to complex and dynamic ecosystems. Yet, such predictions of LUCC are still valuable for guiding land use planning and management (Han et al., 2015) along with risk assessment and control (Camarinha et al., 2013).
AI is effective and practical for the optimization (Duh and Brown, 2007) and spatial solutions of LUCC (Arsanjani et al., 2013). Genetic algorithms (Cao et al., 2012), cellular automata (Liu et al., 2017), and artificial neural networks (Islam et al., 2018) have been successfully applied in different ecosystems. Compared with these approaches, the intelligent modules which are integrated into this paper (including fuzzy logic, equation-based systems, and expert systems) are more concise and intuitive, making them easier to apply in cross-disciplinary research and practical applications.
The theory of fuzzy logic was first introduced by Zadeh (1965) and has since been found to perform well in many models (Weinzierl and Heider, 2015; Yan et al., 2016; Zhang et al., 2018). Expert models are knowledge-based systems (Wu and Silva, 2010) in which expert judgments can be expressed in both qualitative and quantitative ways to determine certain attributes or logic. At present, hybrid models are becoming more popular (Bui et al., 2015; Banihabib and Shabestari, 2017) because of their integrity and flexibility. In the study of complex systems, hybrid approaches can often reduce computational complexity, because some processes only need to be simulated once (e.g., groundwater salinity), but the simulation of scenarios can be repeated many times. A hybrid geo-simulation model was used to predict future spatial distributions of open wetlands in Canada (Tiné et al., 2019). Other hybridizations of logistic regression, cellular automata, and Markov models were tested in northern China, resulting in more efficient and accurate LUCC predictions (Wang et al., 2019). Overall, the integration of AI technologies is expected to result in better performance for geoscience studies, but the research targets and logics need to be clarified to have broader impacts on practical applications.

2 Methods

In this study, we combined fuzzy logic, equation-based systems, and expert systems into a hybrid system for the prediction of LUCCs. This is mainly a relational database of an AI system, which will help guide machine learning to reproduce the true patterns of LUCC. This approach is a good model for land use prediction and can be applied in other related studies.

2.1 Fuzzy-based modules

Due to the complexity and dynamic nature of land use predictions, some relations cannot be precisely quantified or expressed as equations. In such cases, fuzzy logic is often suitable. A fuzzy logic system can be defined as the nonlinear mapping of input datasets to a scalar output dataset (Mendel, 1995). For instance, as shown in Figure 1, fuzzy set A can be defined by a membership function F(A): X→[0, 1], which defines the degree of membership (likelihood) of each element x∈X from 0 to 1. Similarly, fuzzy set B is defined as F(B): Y→[0, 1], and the consequence fuzzy set F is defined as F(C): Z→[0, 1]. The combination of F(A) and F(B) can then be expressed as: if Ax and By, then Cz, namely as F(C) (A, B). The key point is that the response of this combination can be defined by the center of gravity of C, which is usually not a fuzzy number (Bárdossy and Disse, 1993). Therefore, such a combination can be computerized to express direct logic in land use predictions.
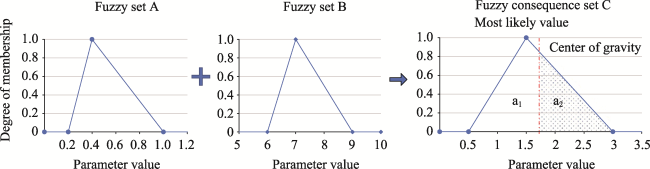
Figure 1 Illustration of fuzzy sets and the consequence fuzzy set
A fuzzy set has no clear boundaries and each has a range of parameter values. Divided by the center of gravity, the integrals (areas) of the separated values are equal (a1 = a2). We found fuzzy logic to be useful in the expression of the relationships between elements in a complex dynamic ecosystem.
In an arid ecosystem, many factors and their interactions can be expressed by fuzzy logic. As an example, consider the density of grasslands (Figure 2). It is difficult to distinguish between high-, medium-, and low-density grasslands; it is much easier for plant experts to define ranges that describe the density as likely belonging to a certain level. In this study, the groundwater level set A was defined as A = {Low, Medium, High} with subsets (m) Low = {-7, -4}, Medium = {-4.5, -1.5} (most likely value of -3), and High = {-2, 0}. Whenever the groundwater level is below -7 m, the membership degree of the low subset is always 1. Similarly, the groundwater salinity set B is given by B = {Low, Medium, High} with subsets (g/l) Low = {0, 2}, Medium = {0, 4} (most likely value of 2), and High = {2, 6}. A consequence grassland density set is given by C = {Low, Medium, High} with grassland coverage subsets (100%) Low = {0.2, 0.5}, Medium = {0.4, 0.8} (most likely value of 0.6), and High = {0.7, 1}. When the grassland density is 0.45, the density could be considered as both low and medium. The overlap is not required, but it is useful in some cases. For instance, there are many types of grassland, and their tolerance to groundwater level and salinity are different.
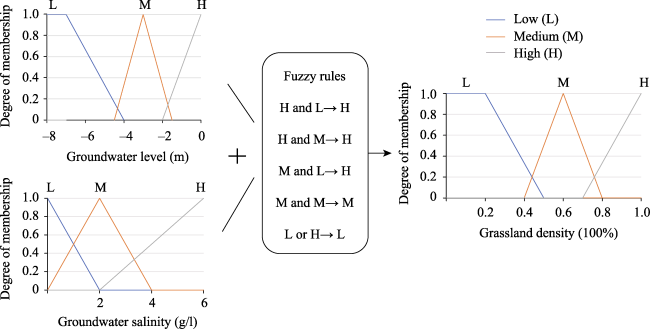
Figure 2 Fuzzy rules for the relationships of groundwater level and groundwater salinity with grassland density
Groundwater salinity at 3 g/l might be high for some vegetation, but still be tolerable for many kinds of halophytes. In the model, we tried to expand the range to cover most general cases. This range overlap can be handled explicitly in the decision-making phase. The final results of fuzzy decisions are determined by the membership degree and membership functions.
The fuzzy rules of groundwater level and salinity determine the changes in grassland density in certain cells. If the groundwater level is high and groundwater salinity is low, then grassland density will be high. Conversely, if the groundwater level is low and groundwater salinity is high, then grassland density will be low. All the cases of the fuzzy rules which determine grassland density are given in Figure 2.
The fuzzy sets of flooding days are defined as Low = {0, 60}, Medium = {0, 120} (most likely value of 60), and High = {120, 365}. Flooding days between 0 and 60 can either be regarded as low or medium level. For riparian forest (take Populus euphratica as a reference; Thomas et al., 2017), the average tree height and the crown area of the trees are determined by the fuzzy rules for flooding days and groundwater level, respectively (Figure 3). The fuzzy sets of the average tree height are defined with subsets (m) Low = {0, 5}, Medium = {5, 12} (most likely value of 7), and High = {12, 20}. Tree height and crown area primarily depend on groundwater level, and secondly depend on summer flooding. The fuzzy set of crown area is given by {Low, Medium, High} with subsets (m2) Low = {0, 6}, Medium = {5, 12} (most likely value of 7), and High = {10, 20}. The fuzzy logic of the density of the riparian forest is determined by the crown area and tree height. The fuzzy set of the density of the riparian forest is given by {Low, High}. If the crown area and tree height are both low, the density of riparian forest will be low. Otherwise, the density of riparian forest will be high.
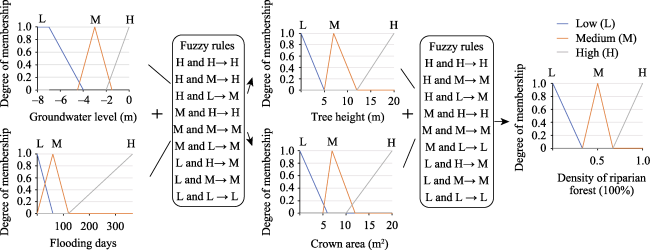
Figure 3 Fuzzy rules for the relationships of groundwater level and flooding days with the density of riparian forest
After establishing the fuzzy rules, it is crucial to assess them adequately. The rules can either be examined by experts or by using observed data. The observed datasets used to assess and improve the fuzzy rules are called training sets (Bárdossy and Disse, 1993). In this study, the specified groundwater level, groundwater salinity, and ecological flooding days are the input fuzzy sets, and certain land use types can be assessed in particular cells. To better display and calculate LUCC, it is necessary to divide the study area into equally-sized cells or hydrologic response units. The fuzzy rules are validated by comparing the responses of the rule system with the observed responses. This process can be further developed as a type of self-learning and improvement by the computer system.

2.2 Equation-based modules

In this study, the empirical formulas are further developed with fuzzy rules to better describe expert knowledge. In arid ecosystems, water is the main driving force of LUCC. Water balance is calculated as follows:
Qin=Qout-WD-WI-WE-WL
where Qin is inflow into the sub-catchment (m3), Qout is the outflow of the sub-catchment (m3), WD is domestic and industrial water use (m3), WI is irrigation water use (m3), WE is the ecological flooding of natural vegetation (m3), and WL is water infiltration loss during transportation (m3).
To quantify the output of LUCC, we calculated several indicators, including reed production and biomass production by the riparian forest. The algorithms of the calculations were derived from fuzzy-based equations as follows.
For each fuzzy set, the degree of membership ranges from 0 to 1. Therefore, for each vector (A, B), the degree of fulfillment of rule i can be defined as follows:
Di=F(Ai)×F(Bi)
Because fuzzy rules allow the simultaneous fulfillment of rules, the consequence corresponding to the vector (A, B) can be defined as a union of individual fuzzy consequences by the following formula:
F(C)(A,B)=∪F(C)(Ai,Bi)
The membership function of the union is then the maximum of the individual membership functions. The response of the fuzzy rule can be defined as a combination of individual responses in the following formula:
F(C)(A,B)=$\frac{\sum D_{i}C(C)}{\sum D_{i}}$
In arid ecosystems, reed production is an important indicator that reflects LUCC and water availability. In our definition, reeds have the largest share among grassland types. Based on the basic fuzzy equations above, reed production is calculated by the following formula:
RP=$\sum^{j=1}_{n}\sum^{i=1}_{12}F(G)(GL_{ij},GS_{ij})×GR_{ij}×s×A$
where RP is reed production each year (t), i represents 12 months each year, j represents the total number of grassland cells, GL is the groundwater level (m), GS is the groundwater salinity (g/l), F(G)(GL,DS) is the response of grassland to the fuzzy rules for groundwater level and groundwater salinity (100 %), GR is the growth rate of reed in each month (t/ha), S is the share of reed in grassland cells (%), and A is the area of each cell (ha).
Biomass production is another important indicator that reflects the growth of a riparian forest. Biomass production is calculated based on an empirical formula and modified by fuzzy rules of high-density and low-density forests by the following formula:
$\begin{align} & \text{BP}=\left\{ \underset{n}{\overset{i=1}{\mathop{\mathop{\sum }^{}}}}\,\left[ {{10}^{\log \left( 0.0382+0.8837\times \log \left( \text{DB}{{\text{H}}^{2}}\times F(\text{TH})\left( \text{G}{{\text{L}}_{i}}{{W}_{Ei}} \right) \right) \right)}}+ \right. \right. \\ & \begin{matrix} \left. {{10}^{\log \left( 0.1072+0.635\times \log \left( \text{DB}{{\text{H}}^{2}}\times F(\text{TH})\left( \text{G}{{\text{L}}_{i}}{{W}_{Ei}} \right) \right) \right.}} \right]\times C\left( \text{H}{{\text{R}}_{i}} \right)+ \\ \underset{m}{\overset{j=1}{\mathop{\mathop{\sum }^{}}}}\,\left[ {{10}^{\log \left( 0.0382+0.8837\times \log \left( \text{DB}{{\text{H}}^{2}}\times F(\text{TH})\left( \text{G}{{\text{L}}_{j}}{{W}_{Ej}} \right) \right) \right)}}+ \right. \\ \left. \left. {{10}^{\log \left( 0.1072+0.635\times \log \left( \text{DB}{{\text{H}}^{2}}\times F(\text{TH})\left( \text{G}{{\text{L}}_{j}}{{W}_{Ej}} \right) \right) \right)}} \right]\times C\left( \text{L}{{\text{R}}_{j}} \right) \right\}\div 1000\times A \\ \end{matrix} \\ \end{align}$
where BP is the biomass production of riparian forest each year (t), i is the total number of high-density riparian forest cells, j is the total number of low-density riparian forest cells, DBH is the tree diameter at breast height (m), which has a sampled average value of 0.347 m, F(TH)(GL,WE) is the response of tree height for the fuzzy rules of groundwater level and ecological flooding (m), C(HR) is the center of gravity of high-density riparian forest in fuzzy logic, with a validated number of 350 trees/ha, and C(LR) is the center of gravity of low-density riparian forest in fuzzy logic, with a validated number of 100 trees/ha.

2.3 Expert modules

The first expert judgment used in the model determined certain land use types from remote sensing images. Combined with literature reviews and field investigations, experts were able to define several cells with low-density riparian forests. These cells mainly contained sparse, short bushes, which is a typical ecosystem characteristic of arid lands in Asia.
Crop growing factors were also determined by expert knowledge. The Food and Agriculture Organization (FAO) Irrigation and Drainage Paper No.33 provides recommendations for many crop factors (Doorenbos and Kassam, 1979); however, these factors are amended in practical situations. In hyper-arid regions, it is necessary to adjust crop factors because plants often exhibit higher transpiration in field surveys (Yu et al., 2015).
Soil water content, irrigation seepage loss, and domestic water use were also determined by local hydrologists based on knowledge gained from statistical data and hydrologic models (Yu et al., 2017). The flooding of natural vegetation is indirectly related to and partially dependent on the knowledge of experts. Because the amount of available ecological water is determined by water input and consumption, the operation of flooding gates is typically dynamic over time. The monthly release of ecological flooding is determined by the experience and previous strategies of local decision-makers.

2.4 Hybrid system

In this study, a hybrid system was found to be a useful and practical tool rather than a physical concept or simply a popular choice. Fuzzy-based modules, equation-based modules, and expert modules were combined to represent the interactions among climate, the water cycle, and LUCC (Figure 4). A hybrid system is easier to establish than a single-module system (e.g., an equation-based system) because it is not possible to describe every relationship in the equations. In a hybrid system, all the logic can be programmed in certain languages (e.g., Python, Java, or C) and realized in self-designed or online platforms.
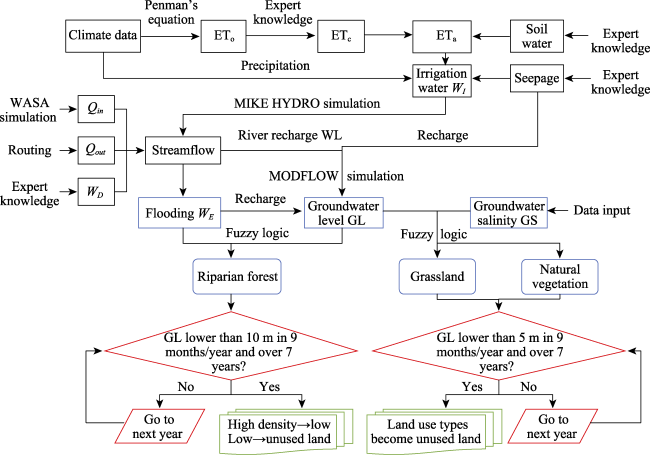
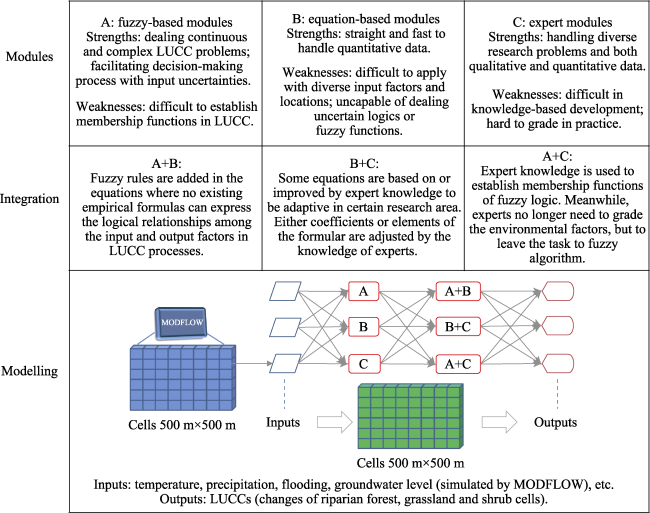
Figure 4 The hybrid system comprised of fuzzy-based modules, equation-based modules, and expert modules
In LUCC classes, shrub (Apocynum, Tamarix, etc.) refers to Gobi Desert flora in Central Asia (Zhang et al., 2020), which is usually sparse shrub with high tolerance to soil water salinity. The growth of those ephemeral plants is dominated by natural flooding and groundwater level. Forest is mainly comprised of Populus euphratica, which has also high tolerance for soil salinity. The differences between shrub and forest depend on vegetation types and the depths of plant roots. Different vegetation types require different fuzzy logic (e.g., with or without tree height and crown area), and different depths of roots determine various thresholds for groundwater levels. Grassland (mainly comprised of reed) is highly dependent on groundwater level and groundwater salinity. Therefore, shrub density relies on flooding, but grasslands are influenced by groundwater salinity in the fuzzy logic. Based on the remote sensing images, vegetation types were differentiated by topographic features and field investigations. Afterward, the dominant species were picked as LUCC classes at the cell level. Furthermore, the FAO 56 soil model was employed in the MIKE HYDRO model (Yu et al., 2017). There were 9 soil types, including sandy loam that had the largest coverage area in this arid region. Soil properties affect evapotranspiration and deep percolation, thus changing the groundwater table during the simulation period.
Reference evapotranspiration was determined using the Penman-Monteith method based climate data (Allen et al., 1998). The FAO 56 dual-crop coefficient model was used to separately calculate soil evaporation and crop transpiration; this allowed the consequences of using different irrigation technologies to be determined with high accuracy (DHI, 2014). Groundwater recharge consisted of river leakage, flooding, and irrigation seepage. The groundwater level was simulated by MODFLOW. The changes in riparian forest, grassland, and shrub were simulated by fuzzy logic. If groundwater level < 10 m in at least nine months per year over 7 consecutive years, high-density forest cells were changed into low-density forest cells, and low-density cells were changed into unused land. Grassland and shrub are considered to have shorter roots than Populus trees. Therefore, if groundwater level < 5 m in at least nine months per year over 7 consecutive years, grassland and shrub cells were changed into unused land. This logic is based on local experts’ knowledge, and it may differ from place to place. During wintertime, the groundwater table is usually lower but has fewer effects on the growth of plants compared with other seasons. In general, the density of grassland and forest will significantly decline during 3 to 5 dry years, and land use type can be altered after 7 years of low groundwater levels.
Fuzzy-based, equation-based, and expert modules were integrated into the modeling system (Figure 5). AI technologies were used in boundary/domain determination (fuzzy sets), dynamic decisions, and predictions. The integrations of the fuzzy, equation-based, and expert knowledge provide indeterminate and stochastic components for deterministic modeling. Compared with fuzzy rules, equations are more direct and faster to handle quantitative data. Under the circumstances that no existing equations can express the logical relationships among input and output factors, fuzzy rules were added to the equations. Expert knowledge is essential for the determination of fuzzy-based rules and membership functions. Expert knowledge and fuzzy logic are complementary tools in the prediction of LUCC. On one hand, expert knowledge can improve the fuzzy rules, making them more reasonable and practical. On the other hand, fuzzy rules make it easier for experts to establish logic for the system. With the ongoing development of the system, local experts and decision-makers can learn from the machine outputs. The decisions from model inputs to outputs are not straightforward but are determined by iterations in the relational network (Figure 5). System complexity is thus reproduced by AI. The more machine learning elucidates the rules, the better predictions that will result.
Figure 5 Integration of fuzzy-based, equation-based, and expert modules in the modeling system

3 Application

3.1 Study area

The developed system was applied to the Alar catchment, a typical arid area in Central Asia. The oasis is located in the upper reaches of the Tarim Basin in Northwest China. The climate in this area is a typical temperate continental climate with hot summers, long winters, and annual precipitation of less than 100 mm. The major income for local people is cotton production, which relies heavily on irrigation water. The oasis, which lies on the edge of the Taklimakan Desert, has severe sand and dust problems. The sustainable land use management of agriculture, forest, and grassland is a crucial challenge in this area (Figure 6). The future climate scenario was based on the projection of regional climate model CCLM (the Consortium for Small-scale Modelling-Climate Limited-area Modelling) (Wang et al., 2013) under the emission scenario RCP 4.5 (Duethmann et al., 2016). River discharge was simulated by the Water Availability in Semi-Arid Environments (WASA) model in the upstream mountain regions. Soil conditions were considered under the framework of the FAO 56 soil module. Meteorological, hydrological, ecological, and geographical data were collected from the study area. The modules and logic were programmed in C++ and realized on the Qt platform. The basic land use map was derived from the MODIS land cover dataset (MCD12Q1) with the International Geosphere-Biosphere Programme (IGBP) classification scheme. Hydrological processes in the catchment were simulated by MIKE HYDRO (Yu et al., 2017) and MODFLOW.
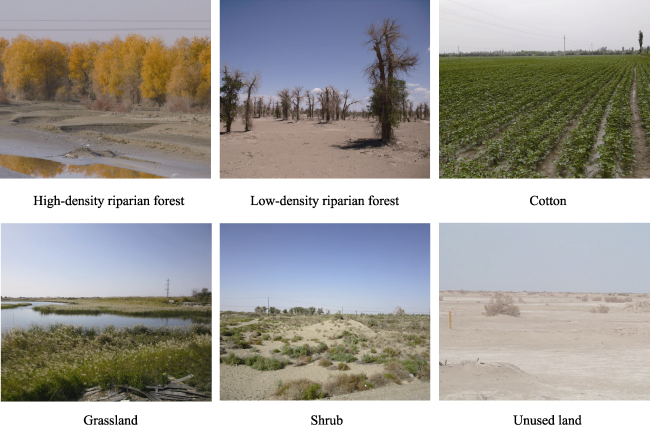
Figure 6 Major land use types in the study area
In the study area, major land use types include grassland, shrub, riparian forest, cotton field, and unused land (wasteland, Gobi, and desert). Two scenarios were designed in the study: 1) Everything Kept as Usual (EKU) scenario, with no additional human actions or management behaviors to prevent land degradation; and 2) Flooding scenario, doubling the water flooding into grassland, shrub, and riparian forest to prevent land degradation. The simulation period was from 2020 to 2050.

3.2 Validation of the model

The hybrid model was calibrated and validated from the beginning of 2005 to the end of 2019. The first five years were the calibration periods, including three steps. 1) Surface runoff was calibrated by the observed discharge at the nearby Alar hydrological station, with an overall NES value of 0.96 and a bias of -3.81%. 2) Groundwater level and salinity were modeled in MODFLOW and fully calibrated by the observed data. In general, groundwater salinization was severe in the area, with an increasing trend over time. 3) Soil porosities and seepage losses were calibrated in the MIKE HYDRO model. In the validation periods, the fuzzy rules for determining LUCC were validated by comparing different phases of land use maps. For instance, grassland degradations under low groundwater levels were examined by remote sensing images after 3, 5, and 7 years to validate the rules, which can better reproduce the most common causes. The validation process is essential for the reliability and accuracy of the model predictions because of system complexity and model uncertainties. In the future, if more land use datasets are acquired in the study area, the machine learning method could also be added to improve LUCC predictions.

3.3 Results

The output of LUCC is illustrated in cells with dimensions of 500 × 500 m for the years 2020 to 2050 (Figure 7).
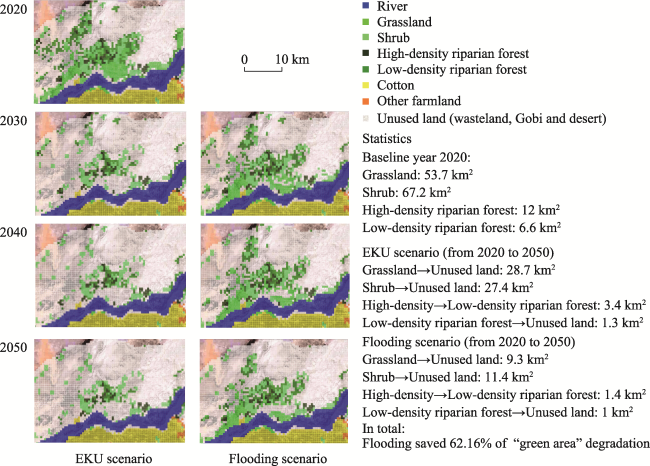
Figure 7 Predictions of LUCC based EKU and flooding scenarios from 2020 to 2050
In the EKU scenario, the areas of grassland, shrub, and riparian forest shrunk dramatically in the study area from 2020 to 2030, indicating that the driving forces of LUCC were active for threatened plants in the early years of the study period. Grassland, shrub, and high- and low-density forest areas were predicted to decrease by 53.5%, 40.8%, 28.4%, and 19.2%, respectively, from 2020 to 2050. In comparison, the flooding scenario was found to be effective in preventing vegetation degradation. With double the water amount via flooding to the ecosystem, 62.16% of the degradation area in the EKU scenario was saved until 2050. According to the results of this study, the risk of land deterioration in the study area is high. Other studies have also reported problems related to water scarcity and salinization (Zhao et al., 2013; Peng et al., 2014) along with their effects on LUCC in the oasis (Huang et al., 2013; Thevs et al., 2015). Figure 7 predicts continuous land degradation from 2020 to 2050. This is a warning for local decision-makers to practice sustainable land management in the oasis.
The mechanistic reasons for the LUCCs are determined by the logic in the system. The degradation of riparian forest and shrub is caused by low groundwater levels and insufficient flooding into the ecosystem, whereas the degradation of grassland is caused by low GL and high GS. Based on expert knowledge, the transition of vegetation degradation will often take several years until the “green areas” become unused land like the Gobi. Due to little rainfall, strong solar radiation, and weathering in hyper-arid regions, a Gobi-like landscape is likely to be formed once a large area of vegetation decays. For further investigation on LUCC influenced by climate change, three climate scenarios RCP2.6, RCP4.5, and RCP8.5 were simulated (Figure 8). The increases in temperature under these three scenarios from 2020 to 2050 were 1.2℃, 1.7℃, and 2.4℃, respectively, while the increases in precipitation were 10%, 14%, and 16.1%, respectively.
The simulation results of LUCC under scenarios indicate a slight decrease of green cells from RCP2.6 to RCP8.5 and much larger land degradation from 2020 to 2050. It is noticeable that the farther the distance of cells from the river, the more likely the land degradation. Different climate scenarios have impacts on the presence of green cells, but not as much as the location (distance to the river) of the cells.
The results of Figure 8 indicate nearly half of the “green areas” degraded by 2050 without management actions to prevent land degradation. From RCP2.6 to RCP8.5, the increase of precipitation is not able to compensate for the additional evaporation losses due to temperature increases. To quantify the interannual change in land use predictions, reed and biomass production were calculated under three climate scenarios: RCP2.6, RCP4.5, and RCP8.5 (Figure 9).
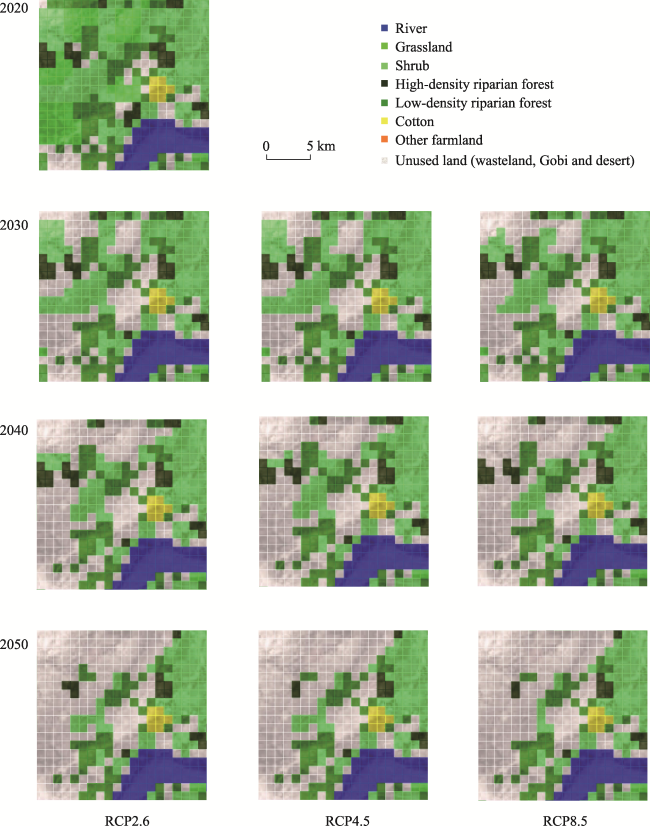
Figure 8 Predictions of LUCC under climate scenarios RCP2.6, RCP4.5 and RCP8.5
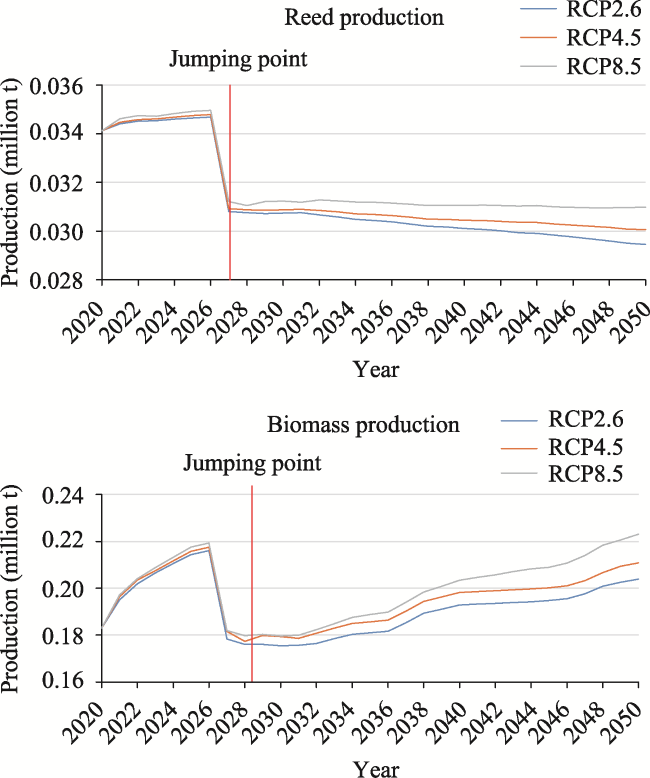
Figure 9 Reed and biomass production under climate scenarios RCP2.6, RCP4.5, and RCP8.5
The results indicate a general decrease in reed production and an increase in biomass production during the study period. From 2020 to 2050, reed production under the three scenarios reduced by 11.4%, 15.3%, and 21.9%, respectively, while biomass production increased by 13.7%, 11.9%, and 9.2%, respectively. A jumping point occurs in each figure after 7 years of simulation. This reflects our intentional setting of LUCC with 7 consecutive years of low groundwater level to test the computer’s response. In future designs, different plants (or plants in different regions) could be separated into different withering years to smooth the curves and make them more realistic. Based on the RCP2.6 to RCP8.5 models, reed and biomass production increased slightly as both temperature and precipitation increased. Similar results have been found in other studies (Poudel et al., 2011; Gustafson et al., 2017) using different models and methodologies. To separate the influence of temperature and precipitation, a sensitivity analysis was conducted (Figure 10). The outputs of the sensitivity analysis were the changes in grassland and forest, with the input variables being the changes in temperature, precipitation, GS, and ecological water (WE). The annual average temperature was 10.5℃, and the annual average precipitation was 59 mm. Baseline GS and WE data were derived from empirical data and expert knowledge. The simulation was run for the years 2020 to 2030.
The change in grassland had a strong positive correlation with the change in precipitation and a lower correlation with the change in WE, whereas it was negatively correlated with changes in temperature and GS. The results suggest that the top priority to control grassland degradation would be reducing GS. Forest change had a strong positive correlation with the change in WE and a weaker positive correlation with the change in precipitation, whereas it was negatively correlated with temperature change. To prevent forest deterioration, the most important factor is to increase water via ecological flooding to support natural vegetation. Forest change had no response to GS; this reflects an intentional setting based on expert knowledge (rather than a false output). Because Populus euphratica has a high tolerance to salinity (Hao et al., 2010), logic between forest and GS was not included in the module. In addition, the results reflect the additional LUCC resulting from changes in the variables; they do not account for the original LUCC in the simulation period.
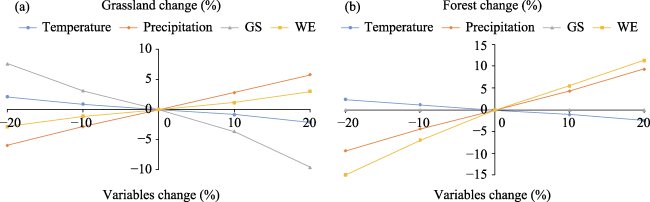
Figure 10 Sensitivity analysis of LUCC based changes in temperature, precipitation, groundwater salinity (GS), and ecological water (WE)

4 Discussion and conclusions

This study developed a hybrid system for predicting land use in an arid ecosystem. Fuzzy logic, equation-based systems, and expert systems were combined to simulate multiple factors and their interactions in a dynamic ecosystem. The logic of the variables was established and embedded into an AI system, and the driving forces of LUCC were analyzed. The results showed that grassland, shrub, and riparian forest regions will shrink in the study area. Grassland change had a strong negative correlation with groundwater salinity change, whereas forest change had a strong positive correlation with water via ecological flooding. Different arid ecosystems often have similarities in climate change, water scarcity, vegetation deterioration, and desertification problems. The outputs of the developed AI system can guide land management policies along with providing warnings about land degradation in arid regions.
The drivers of LUCC discussed in this paper include temperature, precipitation, and ecological flooding to support natural vegetation, groundwater level, and salinity. Moreover, climatic and hydrologic drivers also interact with agroecosystem changes that would result in LUCC. Temperature increases will increase evapotranspiration in the fields, thus raising agricultural water consumption and reducing water for ecological flooding. On the other hand, reduction of farmland area and improvement of water-saving technologies will allow more available water for natural vegetation, which would minimize land degradation in arid regions. In general, the changes in climate scenarios, water resources, and management alternatives have notable impacts on LUCC throughout the simulation. The Intergovernmental Panel on Climate Change (IPCC, 2013) has reported global surface temperature rise to exceed 2℃ for RCP8.5 by the end of the 21st century, which will almost certainly impact regional and global LUCC. In arid regions of Central Asia, the temperature increase is expected to be higher than the global average and the influence on LUCC will be stronger (Yu et al., 2020).
The inclusion of fuzzy logic in the developed AI system increased the flexibility in the design of the system (e.g., the combination of fuzzy logic with equation-based modules). The empirical formulas were further developed with fuzzy rules, to better describe expert knowledge and make them more convenient to use in practice. In this study, we only discussed the case with two fuzzy sets as inputs. It is possible to add more inputs to the fuzzy system; however, the number of rules increases exponentially with the number of fuzzy sets, dramatically increasing system complexity and computational time. In addition, the use of too many variables when making land use predictions would increase uncertainty and make the validation of outputs difficult. Therefore, we only considered the simplest cases in this study. Furthermore, if there were enough testing and validation data, deep learning approaches could be applied to improve the forecasting of LUCC patterns (Duynhoven and Dragievi, 2019). The combination of these AI technologies is the next research step to develop the system until machine learning can further improve to generate more robust LUCC predictions.
Overall, our study is a pioneering attempt at using AI to predict LUCC in an arid ecosystem. Many aspects of our approach could be further developed. For instance, if extra water resources were available in the ecosystem, it would be valuable to plant more trees or vegetation. The natural regeneration of forest and vegetation could also renew the regional landscape in the event of abundant ecological water. Afforestation and grass planting could also transform unused land. Predicting such activities requires the simulation of human land use planning and action. The impact of human activities on the environment is increasing, with both positive and negative influences. Our results indicate management actions (e.g., the flooding scenario) have a profound influence on LUCC predictions.
One disadvantage of the hybrid model developed in this study is the lack of agent-based modules that focus on human actions and their influences. Agents can act according to some model that links the autonomous goals of the agents to the environment (Parker et al., 2003). Including such agent-based models would increase the realism of the model. Another shortcoming of the system is the absence of deep learning (Goodfellow et al., 2016), which would allow the computer to gather knowledge from its own experience rather than exclusively from human experts. Furthermore, the spatial correlation of water cycle and soil conditions are considered by hydrological models, but the interactions of the biosphere (e.g., vegetation community structure) among the surrounding cells are not simulated in the current model. These aspects of the system could be further improved as our knowledge of natural ecosystems and AI technologies are enhanced.
We mainly built a relational database of the AI system. In the future, this AI system may further include machine learning to improve the accuracy of predictions and a training database with LUCC maps, along with our current relational database, to lay the groundwork for basic rules. Additionally, we strongly support open-science principles such as open-source code, open data, and open-access papers due to their ability to accelerate and broaden the use of AI in the geosciences (Bergen et al., 2019). Furthermore, testing AI systems on high-quality datasets in different watersheds and improving the underlying AI technologies would bring benefits to a wider range of communities. Machine learning technologies can improve the accuracy of LUCC predictions with high-resolution remote sensing imagery (Patil et al., 2017). However, the application of AI technologies on LUCC is still at an early stage. Basic principles have to be clear until reliable predictions or new ideas can be generated solely by AI (Schuster, 2018). Incorporating AI into simulation tools enables innovations that would otherwise be difficult through human ingenuity alone (Fraser, 2016). AI technologies will likely play a significant role in LUCC predictions and provide predictions of land degradation into the future.
[1]
Allen R G, Pereira L S, Raes D et al., 1998. Crop evapotranspiration: Guidelines for computing crop requirements. FAO Irrigation and Drainage Paper 56, Volume 300.

[2]
Arsanjani J J, Helbich M, Kainz W et al., 2013. Integration of logistic regression, Markov chain and cellular automata models to simulate urban expansion. International Journal of Applied Earth Observation and Geoinformation, 21: 265-275.

DOI

[3]
Banihabib M E, Shabestari M H, 2017. Fuzzy hybrid MCDM model for ranking the agricultural water demand management strategies in arid areas. Water Resources Management, 31(1): 495-513.

DOI

[4]
Bárdossy A, Disse M, 1993. Fuzzy rule-based models for infiltration. Water Resources Research, 29(2): 373-382.

DOI

[5]
Bergen K J, Johnson P A, Hoop M V et al., 2019. Machine learning for data-driven discovery in solid Earth geoscience. Science, 363(6433): 1299-1310.

[6]
Bui D T, Pradhan B, Revhaug I et al., 2015. A novel hybrid evidential belief function-based fuzzy logic model in spatial prediction of rainfall-induced shallow landslides in the Lang Son city area (Vietnam). Geomatics Natural Hazards & Risk, 6(3): 243-271.

[7]
Camarinha P I M, Canavesi V, Alvalá R C S, 2013. Shallow landslide prediction and analysis with risk assessment using a spatial model in a coastal region in the state of São Paulo, Brazil. Natural Hazards and Earth System Sciences, 14(9): 2449-2468.

[8]
Cao K, Huang B, Wang S et al., 2012. Sustainable land use optimization using Boundary-based Fast Genetic Algorithm. Computers, Environment and Urban Systems, 36(3): 257-269.

DOI

[9]
Carrero R, Navas F, Malvárez G et al., 2014. Artificial intelligence-based models to simulate land-use change around an estuary. Journal of Coastal Research, 70: 414-419.

DOI

[10]
Choubin B, Solaimani K, Habibnejad R M et al., 2017. Watershed classification by remote sensing indices: A fuzzy c‐means clustering approach. Journal of Mountain Science, 14: 2053-2063.

DOI

[11]
Das J, Py F, Harvey J B J et al., 2015. Data-driven robotic sampling for marine ecosystem monitoring. The International Journal of Robotics Research, 34(12): 1435-1452.

DOI

[12]
DHI, 2014. MIKE HYDRO User Guide. DHI, Danmark, 57-187.

[13]
Doorenbos J, Kassam A H, 1979. Yield response to water. FAO Irrigation and Drainage Paper 33, volume 257.

[14]
Duethmann D, Menz C, Jiang T et al., 2016. Projections for headwater catchments of the Tarim River reveal glacier retreat and decreasing surface water availability but uncertainties are large. Environmental Research Letters, 11(5): 1-13.

[15]
Duh J D, Brown D G, 2007. Knowledge-informed Pareto simulated annealing for multi-objective spatial allocation. Computers, Environment and Urban Systems, 31(3): 253-281.

DOI

[16]
Duynhoven A V, Dragievi S, 2019. Analyzing the effects of temporal resolution and classification confidence for modeling land cover change with long short-term memory networks. Remote Sensing, 11(23): 2784-2810.

DOI

[17]
Fraser E, 2016. Computers as inventors: Legal and policy implications of artificial intelligence on patent law. Scripted, 13(3): 305-333.

DOI

[18]
Goodfellow I, Bengio Y, Courville A, 2016. Deep Learning. Cambridge: The MIT Press, 1-26.

[19]
Gustafson E J, Miranda B R, Bruijn A M G D et al., 2017. Do rising temperatures always increase forest productivity interacting effects of temperature, precipitation, cloudiness and soil texture on tree species growth and competition. Environmental Modelling and Software, 97: 171-183.

DOI

[20]
Han H, Yang C, Song J, 2015. Scenario simulation and the prediction of land use and land cover change in Beijing, China. Sustainability, 7(4): 4260-4279.

DOI

[21]
Hao X, Chen Y, Li W, 2010. Hydraulic lift in Populus euphratica Oliv: From the desert riparian vegetation of the Tarim River Basin. Journal of Arid Environments, 74(8): 905-911.

DOI

[22]
Huang T M, Pang Z H, Chen Y N et al., 2013. Groundwater circulation relative to water quality and vegetation in an arid transitional zone linking oasis, desert and river. Science Bulletin, 25(10): 3088-3097.

[23]
IPCC, 2013. Climate change 2013:The physical science basis. Contribution of working group I to the fifth assessment report of the intergovernmental panel on climate change. United Kingdom and New York, NY, USA: Cambridge University Press, 56-72.

[24]
Islam K, Rahman M F, Jashimuddin M, 2018. Modeling land use change using cellular automata and artificial neural network: The case of Chunati Wildlife Sanctuary, Bangladesh. Ecological Indicators, 88: 439-453.

DOI

[25]
Khler J, Kuenzer C, 2020. Forecasting spatio-temporal dynamics on the land surface using Earth observation data: A review. Remote Sensing, 12(21): 3513-3546.

DOI

[26]
Liu X, Liang X, Li X et al., 2017. A future land use simulation model (FLUS) for simulating multiple land use scenarios by coupling human and natural effects. Landscape and Urban Planning, 168: 94-116.

DOI

[27]
Mendel J, 1995. Fuzzy logic systems for engineering: A tutorial. Proceedings of the IEEE, 83(3): 345-377.

DOI

[28]
Parker D C, Manson S M, Janssen M A et al., 2003. Multi-agent systems for the simulation of land-use and land-cover change: A review. Annals of the Association of American Geographers, 93(2): 314-337.

DOI

[29]
Patil S D, Gu Y, Dias F S A et al., 2017. Predicting the spectral information of future land cover using machine learning. International Journal of Remote Sensing, 38(19/20): 5592-5607.

DOI

[30]
Peng H, Thevs N, Ott K, 2014. Water distribution in the perspectives of stakeholders and water users in the Tarim River catchment, Xinjiang, China. Journal of Water Resource and Protection, 6(6): 543-555.

DOI

[31]
Poudel B C, Sathre R, Gustausson L et al., 2011. Effects of climate change on biomass production and substitution in north-central Sweden. Biomass & Bioenergy, 35(10): 4340-4355.

[32]
Qian Y, Zhou W, Yan J et al., 2015. Comparing machine learning classifiers for object-based land cover classification using very high resolution imagery. Remote Sensing, 7(1): 153-168.

DOI

[33]
Reichstein M, Camps-Valls G, Stevens B et al., 2019. Deep learning and process understanding for data-driven Earth system science. Nature, 566: 195-204.

DOI

[34]
Rogan J, Franklin J, Stow D et al., 2008. Mapping land-cover modifications over large areas: A comparison of machine learning algorithms. Remote Sensing of Environment, 112(5): 2272-2283.

DOI

[35]
Sajedi-Hosseini F, Choubin B, Solaimani K et al., 2018. Spatial prediction of soil erosion susceptibility using a fuzzy analytical network process: Application of the fuzzy decision making trial and evaluation laboratory approach. Land Degradation and Development, 29(9): 3092-3103.

DOI

[36]
Schuster W M, 2018. Artificial intelligence and patent ownership. Washington and Lee Law Review, 75: 1945-2004.

[37]
Scott G J, England M R, Starms W A et al., 2017. Fusion of deep convolutional neural networks for land cover classification of high-resolution imagery. IEEE Geoscience and Remote Sensing Letters, 14(9): 1638-1642.

DOI

[38]
Sun L X, Yu Y, Gao Y T, 2021. Temporal and spatial variations of net primary productivity and its response to groundwater of a typical oasis in the Tarim Basin, China. Journal of Arid Land, 13(11): 1142-1154.

DOI

[39]
Termeh S V R, Kornejady A, Pourghasemi H R et al., 2018. Flood susceptibility mapping using novel ensembles of adaptive neuro fuzzy inference system and metaheuristic algorithms. Science of the Total Environment, 615(15): 438-451.

DOI

[40]
Thevs N, Peng H Y, Rozi A et al., 2015. Water allocation and water consumption of irrigated agriculture and natural vegetation in the Aksu-Tarim River Basin, Xinjiang, China. Journal of Arid Environments, 112: 87-97.

DOI

[41]
Thomas F M, Jeschke M, Zhang X M et al., 2017. Stand structure and productivity of Populus euphratica along a gradient of groundwater distances at the Tarim River (NW China). Journal of Plant Ecology, 10(5): 753-764.

[42]
Tian Y, Hao M, Zhang H, 2020. Unsupervised change detection using spectrum-trend and shape similarity measure. Remote Sensing, 12: 3606-3625.

DOI

[43]
Tiné M, Perez L, Molowny-Horas R, 2019. Hybrid spatiotemporal simulation of future changes in open wetlands: A study of the abitibi-témiscamingue region, Québec, Canada. International Journal of Applied Earth Observation & Geoinformation, 74: 302-313.

[44]
Wang D, Menz C, Simon T et al., 2013. Regional dynamical downscaling with CCLM over East Asia. Meteorology and Atmospheric Physics, 121: 39-53.

DOI

[45]
Wang M, Cai L, Xu H et al., 2019. Predicting land use changes in northern China using logistic regression, cellular automata, and a Markov model. Arabian Journal of Geosciences, 12(24): 790-814.

DOI

[46]
Weinzierl T, Heider K, 2015. Assessment of future agricultural conditions in southwestern Africa using fuzzy logic and high-resolution climate model scenarios. Journal of the Geographical Society of Berlin, 146(4): 259-270.

[47]
Wu N, Silva E A, 2010. Artificial intelligence solutions for urban land dynamics: A review. Journal of Planning Literature, 24(3): 246-265.

DOI

[48]
Xu J H, Li W H, Hong Y L, 2014. A quantitative assessment on groundwater salinization in the Tarim River lower reaches, Northwest China. Sciences in Cold and Arid Regions, 6(1): 44-51.

[49]
Yan F, Liu L, Zhang Y et al., 2016. The research of dynamic variable fuzzy set assessment model in water quality evaluation. Water Resources Management, 30(1): 63-78.

DOI

[50]
Yu Y, Chen X, Disse M et al., 2020. Climate change in Central Asia: Sino-German cooperative research findings. Science Bulletin, 65(9): 689-692.

DOI

[51]
Yu Y, Disse M, Yu R et al., 2015. Large-scale hydrological modeling and decision-making for agricultural water consumption and allocation in the main stem Tarim River, China. Water, 7(6): 2821-2839.

DOI

[52]
Yu Y, Yu R, Chen X et al., 2017. Agricultural water allocation strategies along the oasis of Tarim River in Northwest China. Agricultural Water Management, 187: 24-36.

DOI

[53]
Zadeh L A, 1965. Fuzzy sets. Information and Control, 8(3): 338-353.

DOI

[54]
Zhang C, Zhang F, Guo S et al., 2018. Inexact nonlinear improved fuzzy chance-constrained programming model for irrigation water management under uncertainty. Journal of Hydrology, 556: 397-408.

DOI

[55]
Zhang Y M, Zhang D Y, Li W J et al., 2020. Characteristics and utilization of plant diversity and resources in Central Asia. Regional Sustainability, 1(1): 1-10.

DOI

[56]
Zhang Z, Hu H, Tian X et al., 2014. Groundwater dynamics under water-saving irrigation and implications for sustainable water management in an oasis: Tarim River Basin of western China. Hydrology and Earth System Sciences, 18(10): 3951-3967.

DOI

[57]
Zhao X, Xu H, Zhang P et al., 2013. Distribution of soil moisture and salinity in shelterbelts and its relationship with groundwater level in extreme arid area, northwest of China. Water and Environment Journal, 27(4): 453-461.

DOI

Outlines

/