Original article

Effects of land use patterns on slope soil water in the semiarid Loess Plateau, China

  • JIAO Lei , 1 ,
  • YANG Wenhui 1 ,
  • JIA Tian 1 ,
  • MAIERDANG Keyimu 2 ,
  • CHEN Weiliang 2, 5 ,
  • GAO Guangyao , 2, 5, * ,
  • WANG Shuai 3 ,
  • LIU Jianbo 4 ,
  • WANG Cong 2, 5
Expand
  • 1. School of Geography and Tourism, Shaanxi Normal University, Xi’an 710119, China
  • 2. State Key Laboratory of Urban and Regional Ecology, Research Center for Eco-Environmental Sciences, Chinese Academy of Sciences, Beijing 100085, China
  • 3. Faculty of Geographical Science, Beijing Normal University, Beijing 100875, China
  • 4. Tianjin Key Laboratory of Water Resources and Environment, Tianjin Normal University, Tianjin 300387, China
  • 5. National Observation and Research Station of Earth Critical Zone on the Loess Plateau in Shaanxi, Xi’an 710061, China
*Gao Guangyao (1984-), Professor, specialized in ecological restoration and ecohydrology. E-mail:

Jiao Lei (1985-), PhD, specialized in ecological restoration and ecohydrology. E-mail:

Received date: 2021-06-14

  Accepted date: 2021-11-18

  Online published: 2022-06-25

Supported by

National Key Research and Development Program of China(No.2017YFC0504701)

National Key Research and Development Program of China(No.2016YFC0501602)

Natural Science Basic Research Plan in Shaanxi Province of China(No.2019JQ-767)

Doctoral Foundation of Tianjin Normal University(No.52XB1910)

Abstract

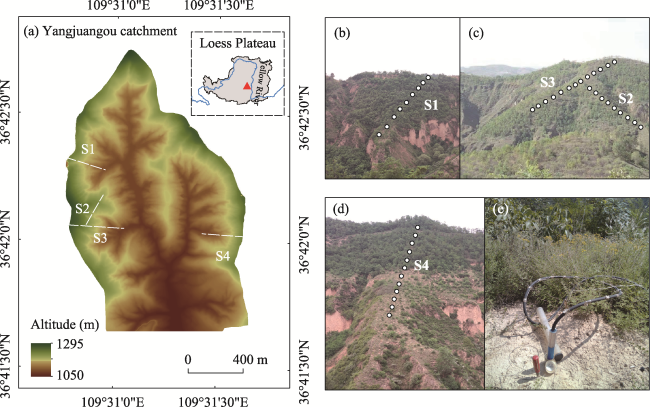
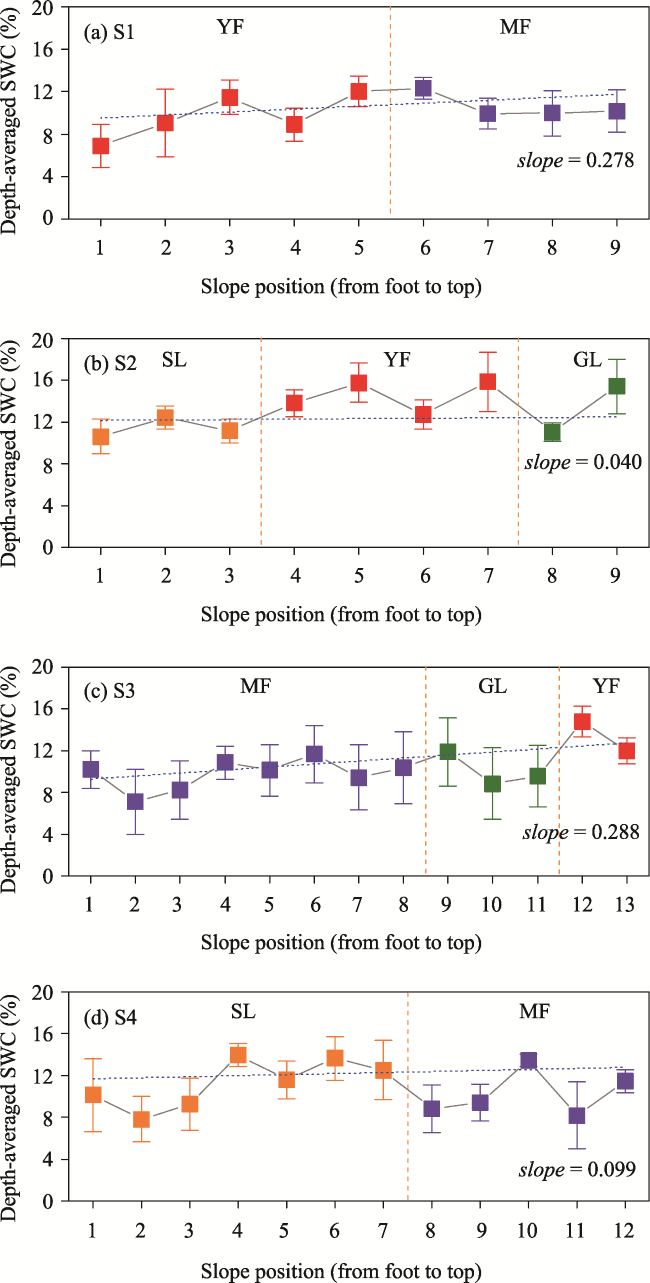
Land use patterns (LUPs) are the form in which various land use types are combined spatially, evidently impacting soil water. However, the influence mechanism by which LUPs form remains unclear. In this study, the soil water content (SWC) in the 0-160-cm soil depth was observed in shrubland (SL), mature forestland (MF), grassland (GL) and young forestland (YF) sites on four slopes with different LUPs in the Yangjuangou catchment of the Chinese Loess Plateau. The SWC in SL-YF-SL (13.28%) was significantly greater than that in YF-MF (9.93%), MF-GL-YF (10.38%) and SL-MF (10.83%) and was temporally stable during the study period. The spatial distribution of SWC along the slope differed among the four LUPs. Vegetation characteristics and soil texture mainly determined the spatial variations in SWC in the shallow soil layers (0-40 cm), while topographic factors were the determinants in the deep soil layers (60-160 cm) as well as in the entire soil profile (0-160 cm). The significance of SWC differences among the various land use patterns increased with decreasing precipitation during the growing seasons. YF-MF (77.8 mm) and SL-YF-GL (73.9 mm) required more rainwater than SL-MF (68.2 mm) and MF-GL-MF (67.5 mm) to compensate for the loss of soil water on the monthly scale during the rainy season. Therefore, vegetation restoration should consider land use patterns on hillslopes for soil water conservation.

Cite this article

JIAO Lei , YANG Wenhui , JIA Tian , MAIERDANG Keyimu , CHEN Weiliang , GAO Guangyao , WANG Shuai , LIU Jianbo , WANG Cong . Effects of land use patterns on slope soil water in the semiarid Loess Plateau, China[J]. Journal of Geographical Sciences, 2022 , 32(4) : 701 -716 . DOI: 10.1007/s11442-022-1968-7

1 Introduction

Soil water is an essential part of the global water cycle, playing a key role in determining the growth of plants, crop production and the sustainable development of terrestrial ecosystems (Dymond et al., 2017; Earles et al., 2018; Feldman et al., 2018). In arid and degraded ecosystems where groundwater is unavailable, water scarcity is considered the most serious restriction to revegetation and ecosystem restoration (Ferrante et al., 2014). Therefore, soil water conservation is crucial for enhancing vegetation development and improving land degradation (Legates et al., 2010; Leitinger et al., 2015; Fu et al., 2017). Soil water is characterized by evident spatiotemporal dynamics at multiple spatiotemporal scales due to the joint impacts of soil, topography, land use, vegetation and climate (Recha et al., 2016; Singh et al., 2019). Herein, conversions of land cover change in the hydrological cycle (e.g., runoff, soil evaporation, rainfall redistribution, infiltration, plant transpiration) including soil water connectivity, influences the soil water content (Western et al., 2004; Wang et al., 2019). The land use type is altered significantly by ecosystem restoration practices (including farmland abandonment and reforestation) (Yu et al., 2020). Inappropriate land use or vegetation types result in soil water depletion due to excessive water consumption by plants, posing a threat to water resources and sustainable ecosystem restoration (Asbjornsen et al., 2011).
Land use patterns are the forms in which various land use types are combined spatially, composing of the canopy style, vegetation structure, and species composition at multiple spatial scales, which exerts a crucial impact on earth surface processes (such as runoff, soil water, soil nitrogen and soil organic carbon) (Caravaca et al., 2002; Fu et al., 2009; Shi et al., 2017; Yu et al., 2020). For example, soil loss control, carbon sequestration and nitrogen stock were higher in various land use patterns than in the single land use type (Fu et al., 2000; Gao et al., 2020). For sustainable vegetation restoration and water resource management in arid and degraded areas, land use patterns could also be considered for proper land use planning at multiple scales (Zhao et al., 2004).
On the Chinese Loess Plateau, the mean soil thickness is 105.7 m (Zhu et al., 2018), such that groundwater is not used by plants. Thus, soil water is especially a vital resource for plant growth and development (Wang et al., 2009; Chen et al., 2020). The effect of land use types on soil water is of great concern and has been well studied in this region (Wang et al., 2011; Wang et al., 2013; Jian et al., 2015; Yang et al., 2015; Jia et al., 2017). However, the effects of land use patterns on the soil water and the spatiotemporal variability of the soil water on slopes with various land use patterns have only been reported in a few studies. For example, Fu et al. (2000) revealed that the soil water content in the 0-70 cm soil depth in the slope farmland-grassland-forest pattern was higher than that in the grassland-slope farmland-forest pattern and slope farmland-forest-grassland pattern. Evidenced by field observation data collected on the Loess Plateau, She et al. (2010) found that soil water was significantly different among the varied land use patterns on slopes, with cropland-fallow land patterns being the highest. Excluding the amount of soil water, the spatial distribution of the soil water along slopes with distinct land use patterns received more attention. Wang et al. (2003) and Yang et al. (2014) showed that soil water was distributed complicatedly on the slopes of multiple land use patterns, while the soil water decreased from the bottom to top along the slope with a single land use. The influence of land use patterns on soil water variation is complex because of the combined effects of land cover, topography and soil properties (Penna et al., 2013; Gwak and Kim, 2016). However, the contributions of impacting factors to the spatial distribution of soil water along slopes have also not been clearly studied. Meanwhile, it has been shown that the temporal variations in the soil water in various land use patterns are largely determined by rainfall (She et al., 2010). However, the temporal variations in soil water in various land use patterns and their responses to rainfall have not been extensively examined.
In this study, continuous multiyear observations of volumetric soil water content were conducted on the slopes within different land use patterns in the Yangjuangou catchment of the Loess Plateau, China. The objectives of this study were to: 1) explore the differences in the soil water content of different land uses and land use patterns, 2) examine the spatial distribution of the soil water along slopes and investigate the dominant influencing factors, and 3) analyze the effect of rainfall on the temporal dynamics of the soil water of different land use patterns. This study provides the required insight for the soil water conservation and guidance for land use management and vegetation restoration in water-limited areas.

2 Materials and methods

2.1 Study area

The Yangjuangou catchment (36°42′N, 109°31′E) has an area of 2.02 km2 and is located in the center of the Loess Plateau. The elevation of the catchment ranged from 1050-1290 m, and the gully density was 2.74 km km-2. The mean annual air temperature is 10.6 ℃. The mean annual precipitation of the area is 535 mm, nearly 79% of which (422.6 mm) is concentrated during the period from May to September (Jiao et al., 2019). The classification of soil is Calcaric Cambisol, which is vulnerable to water erosion (Liu et al., 2012). Soil depth ranges from 50 m to 200 m; thus, soil water is the dominant water resource of vegetation and crops because of the unavailability of groundwater (Jiao et al., 2019).
To control significantly soil erosion, revegetation has been conducted within the last several decades. After the implementation of the “Grain to Green Programme (GTGP)” in 1999, the land use type in the Yangjuangou catchment was converted from cropland to forestland, shrubland and abandoned grassland on the slopes. The area of slope cropland was 17.81 ha in 1996 before the GTGP, which disappeared entirely in 2015. The areas of forestland, shrubland and grassland were 64.81 ha, 13.04 ha and 86.71 ha in 2015, respectively, covering 32.86%, 6.61%, and 43.96% of the catchment.

2.2 Slope selection

There are four land use types on hillslopes in the catchment, i.e., young forestland (YF), mature forestland (MF), grassland (GL), and shrubland (SL). The young forests are mainly young black locust (Robinia pseudoacacia) plantations planted after the implementation of the GTGP. Mature forests are black locust (Robinia pseudoacacia) plantations that are more than 30 years old and were planted in the late 1980s. Grassland originates from abandoned cropland and is dominated by Artemisia sacrorum, Patrinia heterophylla, Glycyrrhiza uralensis and Stipa bungeana. Shrubland is dominated by Artemisia sacrorum, Spiraea pubescens, Sophora davidii, and Hippophae rhamnoides. In this study, four slopes with varied land use combinations were selected (Table 1).
Table 1 Information on the four selected slopes
Slope Length (m) Slope (°) Land use pattern
(from slope foot to top)
No. of soil water
observation plots
Slope 1 (S1) 300 21-39 YF (4)*-MF (5) 9
Slope 2 (S2) 300 12-34 SL (3)-YF (4)-GL (2) 9
Slope 3 (S3) 400 8-38 MF (8) -GL (3)-YF (2) 13
Slope 4 (S4) 350 8-35 SL (7)-MF (5) 12

*The number in parentheses represents the number of observed plots. YF: young forestland; MF: mature forestland; SL: shrubland; GL: grassland

2.3 Field observations

Observation plots were selected along each slope from foot to top at intervals of 30-50 m. At the center of each plot, volumetric soil water content (SWC, %) of 0-160 cm soil depth was observed during the growing season from 2013-2016 with a time domain reflectometry system that consists of a TRIME probe (TDR, TRIME-PICO, Ettlingen, Germany) (Wang et al., 2015). A plastic tube (42 mm diameter) was installed at each measured point of the slopes. A TRIME probe was inserted into the tube, and SWC was measured at various soil depths at 10-cm interval. A removable plastic cap covered the tube entry to avoid rainwater falling into the tube. The TDR system was widely used and provided accurate soil water data after calibration in this region (Wang et al., 2015; Yu et al., 2017; Feng et al., 2018; Cheng et al., 2020).
Figure 1 The study area and the four slopes (a. Yangjuangou catchment; b-d. slopes 1-4 and the observation plots; e. the plastic tube)
The vegetation characteristics of each plot, including the species, richness, height, coverage and diameter at the breast height for trees were also surveyed. The size of the vegetation sampling plot was 10 m × 10 m for forestland, 5 m × 5 m for shrubland, and 1 m × 1 m for grassland. The slope topographic conditions (gradient, aspect and position) of each plot were also determined. Soil properties, including bulk density (BD), soil texture, total carbon (TC), and soil organic carbon (SOC) were measured (Gao et al., 2020).
A tipping bucket rain gauge was used to continuously monitor precipitation (Pre, mm) during the study period, which was set in the open field in the center of the catchment near the observed slopes.

2.4 Statistics analysis

The soil depth-averaged SWC in each plot was derived by Eq. (1) as follows:
$θ_{ij}=\frac{1}{i}\sum^{i}_{i=1}θ_{i}$
where i is the number of measured soil layers in plot j and θi is the SWC in layer i. The averaged SWC in the same land use type was calculated as:
$θ_{k}=\frac{1}{n}\sum^{n}_{n=1}θ_{n}$
where k represents land use types and n is the number of measured plots in land use k.
The mean SWC in each land use pattern on the slope was determined by Eq. (3):
$θ_{f}=\frac{1}{m}\sum^{m}_{m=1}θ_{m}$
where f represents the slopes with varied land use patterns and m is the number of measured plots in slope m.
The relationship between monthly changes in SWC and precipitation was estimated by the following formula:
$△SWC=a×△Pre+b$
where ΔSWC is the monthly change in SWC between one observation and the next observation, ΔPre is the monthly cumulative precipitation between one observation and the next observation, and a and b are the regression parameters. ΔSWC = 0 indicates that SWC does not change between the durations of the two observations. Pre0 is the ΔPre value when ΔSWC = 0, representing the least amount of precipitation that maintains the monthly soil water balance, calculated as follows:
$Pre_{0}=-b/a$
One-way analysis of variance (ANOVA) was used to compare the differences among varied land use types and among slopes with various land use patterns. Two-way ANOVA was used to investigate the annual significance of SWC differences among slopes (p < 0.05). To investigate the annual difference in SWC among slopes, we used a nonlinear regression to establish the relationship between the p value and precipitation during the growing seasons. Linear regression was also conducted to explore the relationships between monthly ΔSWC and ΔPre. Redundancy analysis (RDA) was used to examine the contributions of the effects of vegetation characteristics, topographic factors and soil properties on the spatial distribution of SWC along slopes.

3 Results

3.1 Comparison of the mean soil water content in various land use types and patterns

Among the land use types, the mean SWC was not significantly different in the shallow soil layers (including 0-20 cm, 20-40 cm, and 40-60 cm). The SWC at 60-80 cm in YF was the highest (12.41%), which was significantly higher than that in MF and GL. SWC at the 80-100 cm layer in YF (12.18%) was significantly higher than that of the other three types. SWC at the 100-160 cm layer in YF was the highest (12.46%), followed by GL (11.50%), SL (10.55%) and MF (8.96%). For the 0-160 cm soil profile, the depth-averaged SWC in YF was the highest (12.59%), followed by GL (11.61%) and SL (11.46%), and SWC in MF was the lowest (10.22%) (Figure 2).
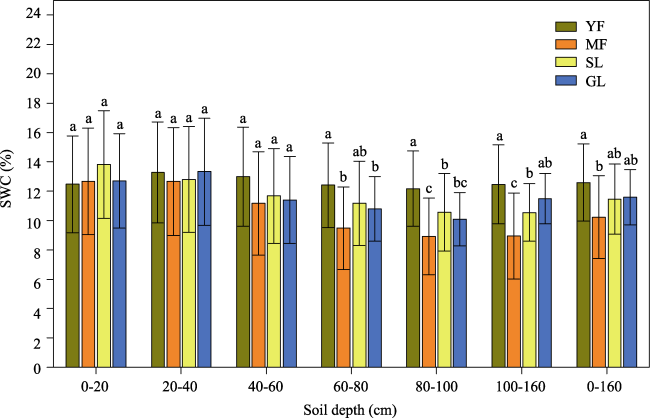
Figure 2 Soil water content (SWC) at different soil depths in various land use types. The error bar represents the standard deviation. The lowercase letters represent significant differences among various land use types at the level of p < 0.05. YF: young forestland; MF: mature forestland; SL: shrubland; GL: grassland
Among the four land use patterns, the SWC at the 0-20-cm layers was not significantly different. The SWC at the 20-40 cm layer on S2, S3 and S4 was significantly greater than that on S1. The SWC on S2 in the 40-60-cm layer was the highest (13.48%), followed by S3, which was significantly higher than that on S1 and S4. At a soil depth > 60 cm, the SWC on S2 was significantly higher than that on the other three slopes. The average SWC at the 0-160-cm soil depth at S2 was the highest (13.28%), significantly higher than those at S4 (10.83%), S3 (10.38%) and S1 (9.93%) (Figure 3).
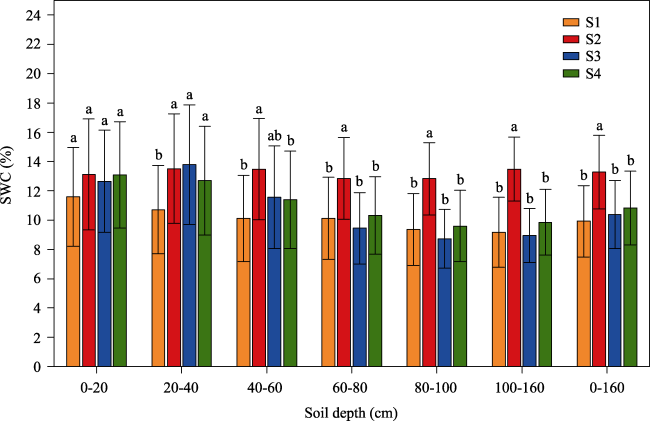
Figure 3 Volumetric soil water content (SWC) at different soil depths on slopes with various land use patterns. The error bars represent the standard deviation. The lowercase letters denote significant differences among various land use patterns at the level of p < 0.05.

3.2 Spatial distribution of soil water content and determinants

From the foot to the top on S1 (YF-MF), the depth-averaged SWC (0-160 cm) showed an increasing trend (linear regression slope = 0.278) (Figure 4). The mean SWC under YF was 9.67%, which was lower than that under MF (10.59%). On S2 (SL-YF-GL), the distribution of SWC fluctuated along the slope. The SWC of YF was 11.44%-15.85%, which was greater than that under SL and GL. The SWC trend increased from the foot of the slope to the top along S3 (linear regression slope = 0.288). SWC under MF on the low and middle slope positions ranged from 7.12%-11.66%, which was lower than SWC under GL and YF. In S4 (SL-MF), the distribution of SWC fluctuated from the slope foot to top. The SWCs under SL and MF were 7.81%-13.96% and 8.20%-13.46%, respectively (Figure 4).
Figure 4 Spatial distribution of SWC along S1 (a), S2 (b), S3 (c), and S4 (d) from slope foot to top. Horizontal blue denotes the trend of the mean SWC from slope foot to top
Based on the RDA, the influential factors that determined the spatial variations in SWC along slopes varied with soil depth. Vegetation cover and TC had relatively higher contributions at the 0-20 cm soil depth. The soil sand content was the highest among all the factors (48.2%) in the 20-40 cm soil layer. At soil depths > 40 cm, slope aspect was the determining factor, with the contribution increasing from 21.2% at 40-60 cm to 39.1% at 100-160 cm. For the 0-160 cm soil profile, slope aspect, TC, position, silt, richness, and SOC could explain the variations in SWC on the slopes, with contributions of 33.7%, 15.7% and 14.4% (Table 2). The contribution of topographic factors (including slope aspect, position, and gradient) was 49.9%. The contributions of soil properties (including BD, TC, SOC, silt, and clay) and vegetation characteristics (richness, species, cover and height) were 31.7% and 18.4%, respectively.
Table 2 Contributions of influential factors on spatial variation of mean SWC on slopes based on RDA
Influencing factors Contributions (%)
20 cm 40 cm 60 cm 80 cm 100 cm 160 cm 0-160 cm
Slope topography Aspect 0.1 0.7 21.2 36.5 38.1 39.1 33.7
Gradient 0.3 6.7 0 2.7 0.5 0 1.8
Position 7.9 7.8 7.8 0.7 8.9 22.3 14.4
Total 8.3 15.2 29 39.9 47.5 61.4 49.9
Soil properties BD 3.8 0 0 12.1 0 0.3 1.1
Clay 0 0 12.4 12.8 6 4.6 3.6
Sand 8.4 48.2 0 0 0 0.1 0
Silt 2.8 10.3 17.7 9.6 4.6 0 3.9
SOC 18 4.5 9.7 2 4.9 0 7.4
TC 24.3 6.5 8 8.6 10.5 13 15.7
Total 57.3 69.5 47.8 45.1 26 18 31.7
Vegetation characteristics Cover 2 0 0.1 4.3 0 0 0.4
Height 2.4 1.3 8.5 4.3 2.9 6.1 10.2
Richness 2.8 6 6.6 4.3 0 0.3 4.1
Species 27.3 6.9 4.4 2.1 8.4 2.5 3.7
Total 34.5 14.2 19.6 15 11.3 8.9 18.4

Note: Aspect: slope aspect; BD: bulk density, g/cm3; Clay: soil clay content, %; Cover: mean vegetation cover, %; Degree: slope gradient; Height: mean plant height, m; Position: slope position; Richness: number of species in each plot; Sand: soil sand content, %; SOC: soil organic carbon, g/kg; Silt: soil silt content, %; Species: dominant species; TC: total carbon, g/kg

3.3 Temporal variation in mean soil water content and its response to rainfall

During the growing seasons (May to September) from 2012 to 2016, Precipitation was 330.7, 624.1, 444.2, 180.1 and 432.6 mm in the Yangjuangou catchment, respectively. The temporal variations in mean SWC were shown as the changing trends of the Pre during the growing seasons (Figure 5). The mean SWC values of 0-160 cm of the 20 measurements were S2 (13.28%) > S4 (10.83%) > S3 (10.38%) > S1 (9.93%). This relationship was stable during the study period regardless of the difference in precipitation among the five growing seasons (2012-2016). However, the significance of the differences in the SWC among slopes temporally varied between growing seasons, with the ANOVA p value exponentially decreasing as precipitation increased during the growing season (Figure 6).
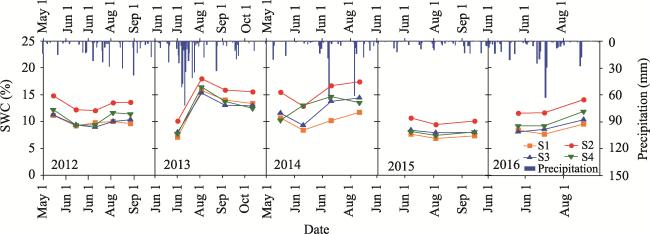
Figure 5 Temporal variations in mean SWC on different land use patterns (SWC, %) and daily precipitation (mm) during the study period
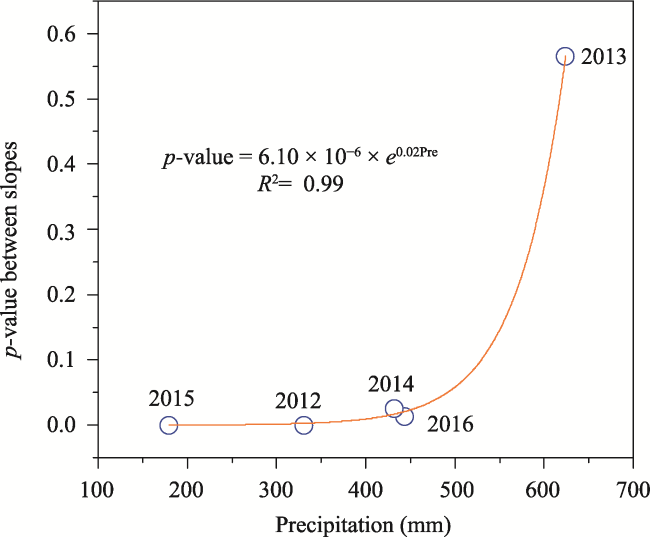
Figure 6 The relationship between growing season precipitation (mm) and ANOVA p value between slopes
ΔSWC at various soil layers increased with ΔPre on the four slopes (Figures 7a-7g). Pre0, representing the lowest monthly rainfall that maintained the soil water balance at different soil depths on the slope, increased with soil depth (Figure 8h). At the 0-160-cm soil profile, Pre0 on S1 (77.8 mm) was highest, followed by on S2 (73.9 mm) and S4 (68.2 mm); that on S3 (67.5 mm) was the lowest. This illustrated that YF-MF and SL-YF-GL required more rainwater than MF-GL-MF and SL-MF to compensate for the loss of soil water at the monthly scale during the rainy season.

4 Discussion

4.1 Soil water content in different land use types

Soil water is an essential water resource for ecosystems on the Loess Plateau. Revegetation, especially afforestation, negatively affects soil water storage, inducing soil desiccation in this region (Wang et al., 2011; Jia et al., 2017). A significant difference in SWC among different land use types was found in this study. The results showed that SWC in MF was significantly lower than that in the other three land use types, which is consistent with previous studies (Wang et al., 2011; An et al., 2017). For example, Fang et al. (2016) reported that SWC in Caragana korshinskii shrubland and black locust forestland was lower than that in grassland and farmland, causing serious soil desiccation. Zhang and Shangguan (2016) also found that SWC was the highest in grassland, followed by shrubland and forestland. There are several reasons for the SWC variations among various land use types. First, the water demand varies between different vegetation types, and soil water consumption by trees is higher than that by herbs and shrubs (Wang et al., 2012; Jian et al., 2015). Additionally, plant morphological characteristics affected rainfall redistribution, and less rainwater infiltrated into soils due to the greater canopy interception of trees compared to shrubs and herbs (Wang et al., 2013; Yang et al., 2018). Therefore, vegetation type and species selection should focus on revegetation and soil water conservation. Lower water demand vegetation, such as local shrubs (Caragana korshinskii) and herbs (Artemisia sacrorum), are suitable for ecosystem restoration on the Loess Plateau.

4.2 Spatial distribution of soil water content on slopes of the various land use patterns

Generally, on slopes with a single land use type, the spatial distribution of SWC exhibited a decreasing trend from slope top to foot because of soil water drainage from the slopes upper to lower section, indicating that topography is the crucial factor determining SWC spatial distribution on slopes with the same land use (Western et al., 2004; Legates et al., 2010). This spatial distribution pattern was shown in many previous studies. For example, on the slope covered with planted Caragana korshinskii, SWC at the 0-1 m soil layer increased from top to bottom of the slope. Fu et al. (2003) found that the soil water (0-70 cm soil depth) had a stable decreasing trend from slope foot to top on cropland. SWC at the 0-1.20 m soil depth increased with a decrease in elevation along a uniform land use slope of grassland (She et al., 2010). Western et al. (2004) also measured SWC in the top 30 cm soil layer and obtained similar results in small catchments in Australia and New Zealand. Notably, the same conclusions of the above studies were drawn based on shallow soil layer observations. However, the spatial distribution pattern of SWC from top to foot along a single land use slope in the middle soil layer (1-2 m) was not a clear trend, while the SWC pattern in the deep soil layer (> 2 m) was a decreasing trend (Yang et al., 2015). Thus, it was indicated that the spatial pattern of SWC along a uniform land use slope varied with soil depth.
However, the multiple land use patterns disrupted the consistent increasing trend from slope top to bottom. The SWC distribution trend was complicated under different land use patterns, and the spatial distribution patterns were not only different among the varied land use patterns but also among the different soil depths (Fu et al., 2003; Yang et al., 2014). On the one hand, for example, the distribution of SWC along the three different land use patterns had “U”, “W” and “V” shapes (Fu et al., 2000). In our study, we also found that the spatial distribution of depth-averaged SWC at 0-160 cm was different among the land use patterns. S2 and S4 showed a fluctuating trend from the slope foot to top, while S1 and S3 showed an increasing trend. This result was inconsistent with previous studies. On the other hand, we found that the spatial distribution patterns in the 0-20-cm and 20-40-cm soil layers were different from those in the middle and deep layers. The differences in SWC among land use patterns and soil depths are closely linked because vegetation, topography, and soil properties possibly work in tandem to control the complex spatial distributions on slopes (Legates et al., 2010). A study conducted in a catchment of the Loess Plateau also explained that the possible reasons for variations in slope SWC resulted from water infiltration due to varied slope gradients (She et al., 2010). Yang et al. (2014) inferred that the different spatial patterns of SWC among different soil deep layers resulted from plant water use. In this study, the results revealed that the slope topographic features (aspect, position and gradient) were the dominant factors that determined the spatial distribution of SWC at 0-160 cm along slopes, followed by the soil properties and vegetation characteristics. However, in the shallow soil layers, the dominant factors were different within the middle and deep layers. This possibly contributed to the variations in spatial pattern among the soil depths.

4.3 Temporal dynamics of soil water content at the slope scale related to rainfall

The temporal changes in SWC reflected the soil water deficit conditions. There are two factors that jointly determine the soil water balance. One is precipitation (water input), and the other is evapotranspiration (water output). On the one hand, SWC varies annually, seasonally and monthly in relation to precipitation, which is the main source of soil water (Recha et al., 2016; Dymond et al., 2017), especially on the slopes of the Loess Plateau. In this area, approximately 58% of the annual precipitation is concentrated in the rainy season, 79% of which is concentrated in the growing season (Jiao et al., 2016; Jiao et al., 2019). Our observations showed that the monthly variations in SWC were similar under various land use patterns during the study period, following the same monthly variations in rainfall events. Furthermore, we found that precipitation determined the significance of the annual SWC difference among slopes; that is, SWC was not significantly different among the slopes in the wet year of 2013 (Figure 6). The reason for the annual difference may be due to the variations in rainfall redistribution and rainwater infiltration with the amount of rainfall. The throughfall of different vegetation or species increased with rainfall size and annual rainfall (Llorens and Domingo, 2007; Magliano et al., 2019). A study on the response of soil water to rainfall conducted in the same catchment suggested that the amount of infiltrated water increased with precipitation under various land use types (Wang et al., 2013). This study also revealed that there was an increasing trend of monthly ΔSWC with ΔPre on the four slopes (Figure 7). Precipitation in the growing season of 2013 was 696 mm, which was much higher than the normal level (422 mm). Frequent and large rainfall events led to vast water infiltration and high SWC values, which were not significantly different among the four slopes.
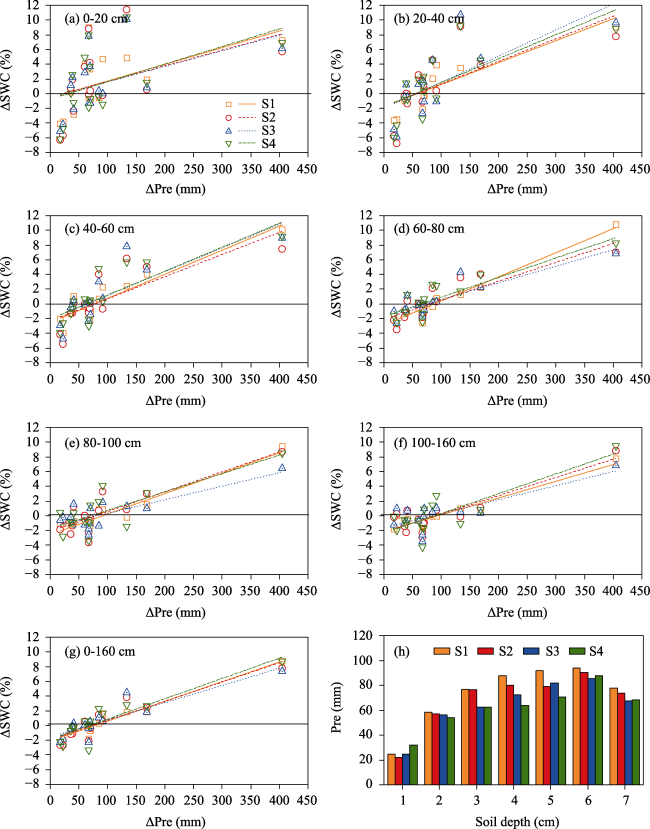
Figure 7 Response of monthly SWC changes (ΔSWC) to monthly cumulative precipitation (ΔPre) on the slopes (a-g) and Pre0 value at different depths (when ΔSWC = 0) (h)
On the other hand, evapotranspiration is the hydrological process by which water transfers out from the soil to the atmosphere, mainly including soil and plant transpiration. When the water output equaled the input, the soil water would not change (ΔSWC) and remained balanced. The least amount of monthly precipitation (Pre0) required to maintain the water balance could be read following the formula between ΔSWC and precipitation. For the 0-160 cm soil profile, S1 required more precipitation to maintain the slope soil water balance, followed by S2, S4 and S3. The difference among the slopes may relate not only to rainwater infiltration as discussed above but also to the water loss through ET. Notably, the Pre0 value increased with soil depth and was the highest for the 100-160 cm soil layer, which was even higher than that of the 0-160 cm soil layer. This result indicated that at least 85.45-94.03 mm was required to recharge the loss of soil water in the deep layers.

4.4 Implications for ecosystem restoration management

Vegetation restoration, leading to clear land use changes, is an effective measure to reduce soil erosion and promote carbon sequestration on the Loess Plateau (Fu et al., 2017; Cao et al., 2019). However, many observations have indicated that revegetation decreases the soil water content and exacerbates the soil desiccation problem due to an increase in ET in the planted forest restricting plant growth (Wang et al., 2011; Jia et al., 2017). For sustainable vegetation development, land use patterns should be optimized at both the slope scale and catchment scale in this region. Which land use pattern should be recommended? Combined with the findings of this study and our previous study (Gao et al., 2020), we suggested that S2 had the highest total soil carbon stock, total soil nitrogen stock and soil water content. In conclusion, GL-YF-SL was the optimal land use pattern on the semiarid hilly areas of the Loess Plateau. Additionally, how should the land use types be arranged on the slopes? In addition to the land use related to vegetation characteristics and soil properties, topographic factors should be comprehensively analyzed to achieve optimal land use arrangements. Finally, overplanting was widespread in many parts of the Loess Plateau (Zhang et al., 2016). As a consequence, the water demand of current vegetation has already been higher than the local water supply over the Loess Plateau (Feng et al., 2016). How much vegetation and what vegetation types that should be planted were questions that cannot be neglected. Although vegetation characteristics and soil water have already been observed, the dynamic relationship between vegetation density and soil water should be deeply examined in the future.

5 Conclusion

This study examined the spatiotemporal variations in SWC of the 0-160-cm soil layer at the slope scale under four land use patterns. After five years of observation, the mean SWC was the highest in the SL-YF-GL pattern, followed by the SL-MF, MF-GL-YF and YF-MF patterns. In addition, the mean SWC in the SL-YF-GL pattern was temporally stable during the study period. The spatial distribution of SWC along slopes varied among the different land use patterns, and its determinants varied with soil depth, i.e., vegetation characteristics and soil texture mainly determined the spatial distribution of SWC in shallow soil layers, while topographic factors were determinants in deep soil layers and the whole soil 0-160 cm soil profile. Furthermore, temporal variations in SWC were closely related to rainfall. On the one hand, the difference in mean SWC among the various land use patterns was much more significant in the wet growing seasons than in the dry growing seasons. In addition, to compensate for the loss of soil water at the monthly scale during rainy season, YF-MF required more rainwater than SL-YF-GL, SL-MF and MF-GL-MF. Therefore, vegetation restoration should consider land use patterns on hillslopes for soil water conservation.
[1]
An W, Li Z, Wang S et al., 2017. Exploring the effects of the “Grain for Green” program on the differences in soil water in the semi-arid Loess Plateau of China. Ecological Engineering, 107: 144-151.

DOI

[2]
Asbjornsen H, Goldsmith G R, Alvarado-Barrientos M S et al., 2011. Ecohydrological advances and applications in plant-water relations research: A review. Journal of Plant Ecology, 4(1/2): 3-22.

DOI

[3]
Cao Z, Li Y, Liu Z et al., 2019. Quantifying the vertical distribution pattern of land-use conversion in the loess hilly region of northern Shaanxi Province 1995-2015. Journal of Geographical Sciences, 29(5): 730-748.

DOI

[4]
Caravaca F, Masciandaro G, Ceccanti B, 2002. Land use in relation to soil chemical and biochemical properties in a semiarid Mediterranean environment. Soil & Tillage Research, 68(1): 23-30.

[5]
Chen W, Li Z, Jiao L et al., 2020. Response of soil moisture to rainfall event in black locust plantations at different stages of restoration in hilly-gully area of the Loess Plateau, China. Chinese Geographical Science, 30(3): 427-445.

DOI

[6]
Cheng R R, Chen Q W, Zhang J G et al., 2020. Soil moisture variations in response to precipitation in different vegetation types: A multi-year study in the loess hilly region in China. Ecohydrology, 13(3): e2196.

[7]
Dymond S F, Bradford J B, Bolstad P V et al., 2017. Topographic, edaphic, and vegetative controls on plant-available water. Ecohydrology, 10(8): e1897.

[8]
Earles J M, Stevens J T, Sperling O et al., 2018. Extreme mid-winter drought weakens tree hydraulic-carbohydrate systems and slows growth. New Phytologist, 219(1): 89-97.

DOI PMID

[9]
Fang X, Zhao W, Wang L et al., 2016. Variations of deep soil moisture under different vegetation types and influencing factors in a watershed of the Loess Plateau, China. Hydrology and Earth System Sciences, 20(8): 3309-3323.

DOI

[10]
Feldman A F, Short G D J, Konings A G et al., 2018. Moisture pulse-reserve in the soil-plant continuum observed across biomes. Nature Plants, 4(12): 1026-1033.

DOI PMID

[11]
Feng T, Wei W, Chen L et al., 2018. Effects of land preparation and plantings of vegetation on soil moisture in a hilly loess catchment in China. Land Degradation & Development, 29(5): 1427-1441.

DOI

[12]
Feng X, Fu B, Piao S et al., 2016. Revegetation in China’s Loess Plateau is approaching sustainable water resource limits. Nature Climate Change, 6(11): 1019-1022.

DOI

[13]
Ferrante D, Oliva G E, Fernández R J, 2014. Soil water dynamics, root systems, and plant responses in a semiarid grassland of Southern Patagonia. Journal of Arid Environments, 104: 52-58.

DOI

[14]
Fu B, Chen L, Ma K et al., 2000. The relationships between land use and soil conditions in the hilly area of the loess plateau in northern Shaanxi, China. Catena, 39(1): 69-78.

DOI

[15]
Fu B, Wang J, Chen L et al., 2003. The effects of land use on soil moisture variation in the Danangou catchment of the Loess Plateau, China. Catena, 54(1): 197-213.

DOI

[16]
Fu B, Wang S, Liu Y et al., 2017. Hydrogeomorphic ecosystem responses to natural and anthropogenic changes in the Loess Plateau of China. Annual Review of Earth and Planetary Sciences, 45(1): 223-243.

DOI

[17]
Fu B, Wang Y, Lu Y et al., 2009. The effects of land-use combinations on soil erosion: A case study in the Loess Plateau of China. Progress in Physical Geography, 33(6): 793-804.

[18]
Gao G, Tuo D, Han X et al., 2020. Effects of land-use patterns on soil carbon and nitrogen variations along revegetated hillslopes in the Chinese Loess Plateau. Science of the Total Environment, 746: 141156.

DOI

[19]
Gwak Y, Kim S. 2016. Factors affecting soil moisture spatial variability for a humid forest hillslope. Hydrological Processes, 31: 431-445.

DOI

[20]
Jia X, Shao M A, Zhu Y et al., 2017. Soil moisture decline due to afforestation across the Loess Plateau, China. Journal of Hydrology, 546: 113-122.

DOI

[21]
Jian S, Zhao C, Fang S et al., 2015. Effects of different vegetation restoration on soil water storage and water balance in the Chinese Loess Plateau. Agricultural and Forest Meteorology, 206: 85-96.

DOI

[22]
Jiao L, Lu N, Fang W et al., 2019. Determining the independent impact of soil water on forest transpiration: A case study of a black locust plantation in the Loess Plateau, China. Journal of Hydrology, 572: 671-681.

DOI

[23]
Jiao L, Lu N, Sun G et al., 2016. Biophysical controls on canopy transpiration in a black locust (Robinia pseudoacacia) plantation on the semi-arid Loess Plateau, China. Ecohydrology, 9(6): 1068-1081.

DOI

[24]
Legates D R, Mahmood R, Levia D F et al., 2010. Soil moisture: A central and unifying theme in physical geography. Progress in Physical Geography: Earth and Environment, 35(1): 65-86.

DOI

[25]
Leitinger G, Ruggenthaler R, Hammerle A et al., 2015. Impact of droughts on water provision in managed alpine grasslands in two climatically different regions of the Alps. Ecohydrology, 8(8): 1600-1613.

PMID

[26]
Liu Y, Fu B, Lu Y et al., 2012. Hydrological responses and soil erosion potential of abandoned cropland in the Loess Plateau, China. Geomorphology, 138(1): 404-414.

DOI

[27]
Llorens P, Domingo F, 2007. Rainfall partitioning by vegetation under Mediterranean conditions. A review of studies in Europe. Journal of Hydrology, 335(1): 37-54.

DOI

[28]
Magliano P N, Whitworth-Hulse J I, Florio E L et al., 2019. Interception loss, throughfall and stemflow by Larrea divaricata: The role of rainfall characteristics and plant morphological attributes. Ecological Research, 34(6): 753-764.

DOI

[29]
Penna D, Brocca L, Borga M et al., 2013. Soil moisture temporal stability at different depths on two alpine hillslopes during wet and dry periods. Journal of Hydrology, 477: 55-71.

DOI

[30]
Recha J W, Mati B M, Nyasimi M et al., 2016. Changing rainfall patterns and farmers’ adaptation through soil water management practices in semi-arid eastern Kenya. Arid Soil Research & Rehabilitation, 30(3): 229-238.

[31]
She D L, Shao M A, Timm L C et al., 2010. Impacts of land-use pattern on soil water-content variability on the Loess Plateau of China. Acta Agriculturae Scandinavica Section B: Soil and Plant Science, 60(4): 369-380.

[32]
Shi P, Zhang Y, Li Z et al., 2017. Influence of land use and land cover patterns on seasonal water quality at multi-spatial scales. Catena, 151: 182-190.

DOI

[33]
Singh G, Panda R K, Mohanty B P, 2019. Spatiotemporal analysis of soil moisture and optimal sampling design for regional-scale soil moisture estimation in a tropical watershed of India. Water Resources Research, 55: 2057-2078.

DOI

[34]
Wang C, Fu B, Zhang L et al., 2019. Soil moisture-plant interactions: An ecohydrological review. Journal of Soils and Sediments, 19: 1-9.

DOI

[35]
Wang J, Fu B, Qiu Y et al., 2003. The effects of land use and its patterns on soil properties in a small catchment of the Loess Plateau. Journal of Environmental Sciences, 15(02): 263-266.

[36]
Wang S, Fu B, Gao G et al., 2015. Linking the soil moisture distribution pattern to dynamic processes along slope transects in the Loess Plateau, China. Environmental Monitoring & Assessment, 187(12): 778.

[37]
Wang S, Fu B, Gao G et al., 2013. Responses of soil moisture in different land cover types to rainfall events in a re-vegetation catchment area of the Loess Plateau, China. Catena, 101: 122-128.

DOI

[38]
Wang S, Fu B, Gao G et al., 2012. Soil moisture and evapotranspiration of different land cover types in the Loess Plateau, China. Hydrology and Earth System Sciences, 16(8): 2883-2892.

DOI

[39]
Wang Y, Shao M A, Zhu Y et al., 2011. Impacts of land use and plant characteristics on dried soil layers in different climatic regions on the Loess Plateau of China. Agricultural and Forest Meteorology, 151(4): 437-448.

DOI

[40]
Wang Z, Liu B, Zhang Y, 2009. Soil moisture of different vegetation types on the Loess Plateau. Journal of Geographical Sciences, 19(6): 707-718.

DOI

[41]
Western A W, Zhou S L, Grayson R B et al., 2004. Spatial correlation of soil moisture in small catchments and its relationship to dominant spatial hydrological processes. Journal of Hydrology, 286(1): 113-134.

DOI

[42]
Yang L, Chen L D, Wei W et al., 2014. Comparison of deep soil moisture in two re-vegetation watersheds in semi-arid regions. Journal of Hydrology, 513: 314-321.

DOI

[43]
Yang L, Chen L, Wei W, 2015. Effects of vegetation restoration on the spatial distribution of soil moisture at the hillslope scale in semi-arid regions. Catena, 124: 138-146.

DOI

[44]
Yang L, Zhang H, Chen L, 2018. Identification on threshold and efficiency of rainfall replenishment to soil water in semi-arid loess hilly areas. Science China Earth Sciences, 61: 292-301. (in Chinese)

DOI

[45]
Yu X, Zhou W, Wang Y et al., 2020. Effects of land use and cultivation time on soil organic and inorganic carbon storage in deep soils. Journal of Geographical Sciences, 30(6): 921-934.

DOI

[46]
Yu Y, Wei W, Chen L et al., 2017. Land preparation and vegetation type jointly determine soil conditions after long-term land stabilization measures in a typical hilly catchment, Loess Plateau of China. Journal of Soils and Sediments, 17(1): 144-156.

DOI

[47]
Yu Y, Zhao W, Martinez-Murillo J F et al., 2020. Loess Plateau: From degradation to restoration. Science of the Total Environment, 738: 140206.

DOI

[48]
Zhang Y, Shangguan Z, 2016. The change of soil water storage in three land use types after 10 years on the Loess Plateau. Catena, 147: 87-95.

DOI

[49]
Zhao W, Fu B, Meng Q et al., 2004. Effects of land-use pattern change on rainfall-runoff and runoff-sediment relations: A case study in Zichang watershed of the Loess Plateau of China. Journal of Environmental Sciences, 16(3): 436-442.

[50]
Zhu Y, Jia X, Shao M A, 2018. Loess thickness variations across the Loess Plateau of China. Surveys in Geophysics, 39(4): 715-727.

DOI

Outlines

/