Original article

Regional land ecological security evaluation and ecological poverty alleviation practice: A case study of Yangxian County in Shaanxi Province, China

  • ZHANG Xinrong , 1 ,
  • WANG Yongsheng , 2, * ,
  • YUAN Xuefeng 3, 4 ,
  • YANG Yuanyuan 2
Expand
  • 1. School of Earth Science and Resources, Chang’an University, Xi'an 710054, China
  • 2. Institute of Geographic Sciences and Natural Resources Research, CAS, Beijing 100101, China
  • 3. School of Land Engineering, Chang’an University, Xi’an 710054, China
  • 4. Key Laboratory of Degraded and Unused Land Consolidation Engineering, Xi’an 710054, China
*Wang Yongsheng (1985-), PhD and Associate Professor, specialized in land engineering and poverty alleviation. E-mail:

Zhang Xinrong (1995-), PhD, specialized in ecological poverty alleviation. E-mail:

Received date: 2021-05-25

  Accepted date: 2021-09-17

  Online published: 2022-06-25

Supported by

Strategic Priority Research Program of the Chinese Academy of Sciences(No.XDA23070301)

Key Program of the National Natural Science Foundation of China(No.41931293)

Abstract

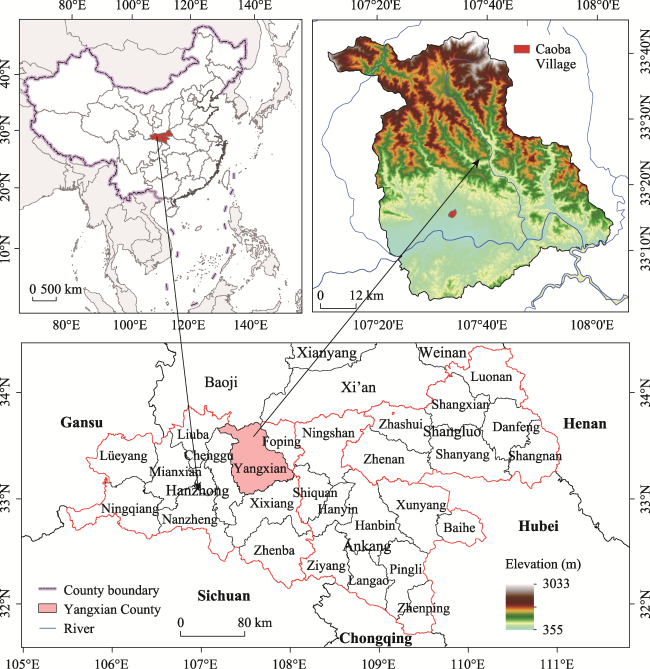
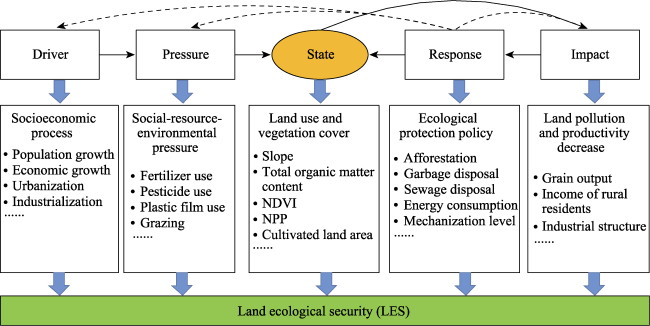
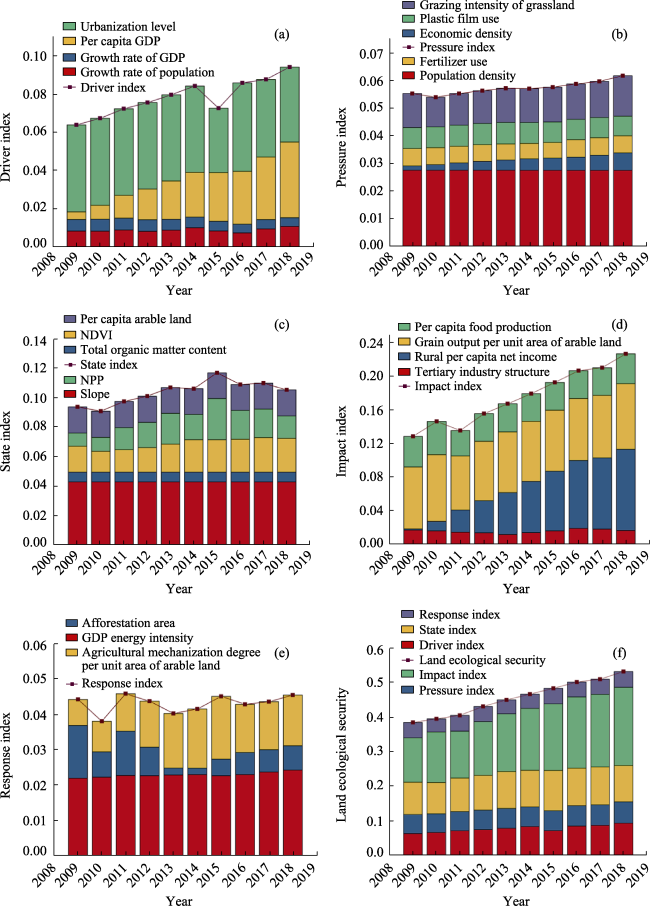
Land ecological security (LES) is an important part of China’s ecological civilization construction, which plays a vital role in ensuring the sustainable development of its society and economy. Based on the Driving force-Pressure-State-Impact-Response (DPSIR) framework, this study quantified the spatiotemporal changes of LES in 28 counties of the southern Shaanxi Province from 2009 to 2018. The influencing factors of LES in Yangxian County were explored to clarify the mechanisms that rely on the land ecological advantages to develop organic agriculture and boost poverty alleviation. Results show that the LES of Yangxian always ranked in the top six in 28 counties of the southern Shaanxi region during 2009-2018. The LES in Yangxian increased from 0.385 in 2009 to 0.533 in 2018, and the LES level changed from relatively unsafe to safe. The indicators of rural per capita net income, grain output per unit area of arable land, and grazing intensity could explain 99.8% of the LES variance in Yangxian. Relying on ecological resources, Yangxian increased farmers’ income and boosted alleviation of poverty through innovative land policies, developing organic agriculture, and rural tourism. These findings will provide theoretical support and model reference for balancing ecological protection and poverty alleviation in restricted development zones.

Cite this article

ZHANG Xinrong , WANG Yongsheng , YUAN Xuefeng , YANG Yuanyuan . Regional land ecological security evaluation and ecological poverty alleviation practice: A case study of Yangxian County in Shaanxi Province, China[J]. Journal of Geographical Sciences, 2022 , 32(4) : 682 -700 . DOI: 10.1007/s11442-022-1967-8

1 Introduction

Land represents the space carrier of human socio-economic activities and is of the most basic production and living element which plays an extremely important supporting role in regional sustainable development (Li et al., 2019a). Rapid urbanization has resulted in arable land loss, abandonment, and pollution (Liu et al., 2010; Liu et al., 2014). In addition, unreasonable land use and management measures also have brought about a series of land degradation problems such as erosion, desertification, and salinization (Foley et al., 2005; Trnka et al., 2013; Wang et al., 2020). These land issues threaten agricultural production efficiency, food security, and human health, directly affecting sustainable socio-economic development (Zhou and Liu, 2018). Land ecological security (LES) represents the health and sustainability of land resources and ecosystems and provides ecological services for future generations (Feng, 2017; Feng et al., 2018). Land ecosystems can maintain their structure and functional stability within a certain time and range (Wang et al., 2019). Specifically, LES is a complicated system consisting of land natural ecological security, land economic security, and land social security (Xu et al., 2014). China’s ecological civilization construction advocates harmonious coexistence between humans and nature and a path towards eco-friendly, green, and sustainable development (Meng et al., 2021). LES plays a vital role in ensuring the sustainable development of the economy, ecology, and society (Wang and Li, 2020).
Land resources have been highly valued by the Chinese central government since the 21st century. A series of land policies, regulations, and engineering technologies have been established continuously and successively, such as the requisition-compensation balance of arable land, increasing vs. decreasing balance of urban-rural built-up land, and economical and intensive land use (Long et al., 2012). These measures play an important role in ensuring the quantity and productivity of arable land and food security. Regarding land degradation, modern land engineering measures such as land consolidation, water and soil allocation, and ecological conservation have been adopted to effectively improve the land ecological environment and arable land quantity (Liu et al., 2020b). Since 2010, China’s State Council has issued a ‘National Principal Function Zones Plan’ to avoid the problems of arable land loss, excessive resource development, and damage to the ecology and environment in the processes of rapid socio-economic development. The plan requires redlines to be drawn to protect the ecosystems, designate permanent basic cropland, and delineate boundaries for urban development to ensure a reasonable urban, agricultural, and ecological spatial layout. The regulation of all territorial space use is conducive to ensuring regional ecological security, but it also limits regional economic development to a certain extent (DeClerck et al., 2006; Hou et al., 2018). Space control measures such as ecological protections could change the production methods and livelihood sources of indigenous residents, ‘restricting the farmers’ land property rights, and leading to the apparent dichotomy between ecological protection and rural poverty (Vedeld et al., 2012). Therefore, it is necessary to explore a path that couples economic development, ecological environment, and rural poverty alleviation in the restricted development zones (Liu, 2018; Ward and Swyngedouw, 2018; Li et al., 2021).
The Chinese government has successively issued policies such as ecological civilization construction, ‘Beautiful China’ and ‘Lucid waters and lush mountains are invaluable assets’ to promote economic development in restricted development zones (Sun et al., 2020). Ecological land resources have become important production elements for regional economic development. Ecological development concepts and measures such as ecological agriculture, circular agriculture (Fan et al., 2018), green agriculture, and organic agriculture (Candiotto, 2018) have effectively transformed ecological resources into economic wealth, realizing a virtuous circle of eco-environmental protection and high-quality economic development (Zhang et al., 2020). The evaluation of LES can reveal the safety characteristics of regional land resources for planning and utilization of ecological land resources. At present, LES assessments have involved cities (Shi et al., 2018), urban agglomerations (Li et al., 2020), river basins (Shen et al., 2017), and reservoir areas (Liu et al., 2019a). The assessment models include Pressure-State-Response (PSR) (Hua et al., 2011) and Driving Force-Pressure-State-Impact-Response (DPSIR) (Ruan et al., 2019). In addition, multi-dimensional evaluation models such as Nature-Economy-Society and Economy-Environment-Society were also used in the previous studies (Lü et al., 2019). DPSIR model are commonly used in ecological security assessments (Zhang et al., 2015). The advantage of this model is that it can comprehensively consider the economy, society, ecology, and environment, and deeply reflect the interactive mechanisms between the natural environment and human beings. The evaluation methods include comprehensive indexes (Du and Gao, 2020), matter-elements (Wu et al., 2019), landscape patterns (Li et al., 2014), and catastrophe theory (Su et al., 2011). The advantage of the entropy comprehensive index method is that it can determine weighting through a combination of subjective and objective methods.
Land plays an important role in regional poverty alleviation and rural revitalization (Liu and Wang, 2019; Guo and Liu, 2021). During the period of China’s targeted poverty alleviation, the combination of an effective land policy and innovations in land engineering promoted a regional modernization of agricultural development and provided a stable and sustainable income for poor households (Wang and Li, 2019; Zhou et al., 2019). In some poverty-stricken areas, ecological land resources were used to develop organic agriculture and eco-tourism for increasing the county’s revenue, collective economy, and income of farmers (Lei et al., 2021). The ecological industrialization developmental approach is innovative in that it vitalizes rural areas with characteristics indicative of a thriving industry, pleasant living conditions, and prosperity (Zhang et al., 2020).
Located in the Qinling-Daba (Qinba) mountainous region of southern Shaanxi Province, Yangxian County experienced long-term poverty because of environmental protections and then were put into place representative of a win-win situation for ecological protection and economic development. The successful reliance on ecological advantages to develop organic industries has become a good model for resolving the contradiction between economic development and ecological protection. Therefore, this study takes Yangxian as an example. Its main objectives are to (1) construct an LES evaluation framework based on the DPSIR model; (2) evaluate the spatiotemporal patterns and influencing factors of regional LES; (3) clarify the promoting mechanisms of ecological land resource utilization and industrial development to regional poverty alleviation through a case study. The results can provide important theoretical support and reference for balancing regional ecological protection and economic development in similar areas.

2 Materials and methods

2.1 Study area

Southern Shaanxi is part of the Qinba mountainous region, containing 28 counties in three cities (Hanzhong, Ankang, and Shangluo), with a total area of 70,200 km2 (Figure 1). Southern Shaanxi is located in the transitional zone between the northern warm temperate and subtropical monsoon climate, with annual precipitation of 900 mm and an annual mean temperature of 10.7 °C. As a primary water resource conservation region and a concentrated contiguous destitute area, it has difficulty reconciling ecological protections while at the same time fostering livelihood development (Liu et al., 2019b). Since 1980, southern Shaanxi has taken numerous measures to alleviate poverty by relying on ecological land resource utilization and an innovative land policy (Liu et al., 2020a).
Figure 1 Location of the study area (Yangxian County, southern Shaanxi Province, China)
Yangxian County is located in the northwest portion of southern Shaanxi (107°11°E‒ 108°33°E, 33°02°N‒33°43°N) (Figure 1). This region is characterized by a subtropical monsoon climate with an annual mean temperature of 14.5°C and precipitation of 839.7 mm. Yangxian is an important water conservation area of the middle route of the South-to-North Water Diversion Project in China. There are two national nature reserves, namely Crested Ibis and Changqing, accounting for 94% of the county area. In the 1980s, the world’s only seven crested ibises were discovered in Yangxian. Hunting and logging practices and the application of mineral fertilizers and pesticides have been banned to protect the environment. Yangxian has fallen into the category of “green poverty”. In 2005, four Chinese Academy of Sciences academicians visited Yangxian and concluded that Yangxian is the best area for developing organic industries in China. Yangxian eliminated regional poverty in February 2020 by using ecological land resources to develop organic agriculture.
Caoba Village is affiliated with the Zhifang Street Office and is located in the core area of the Crested Ibis Natural Reserve. It covers 5.98 km2 and governs 11 village groups, including 576 households and 2050 villagers. Caoba Village is distinguished as a National Civilized Village and Shaanxi Rural Tourism Demonstration Village. Caoba combines ecological advantages with market demand to develop organic agriculture and rural tourism.

2.2 Data sources

The data used in this study include a digital elevation model (DEM), land use and cover change products (LUCC), the normalized difference vegetation index (NDVI), soil data, and socio-economic statistical data. The 90-m resolution DEM data was obtained from the Geospatial Data Cloud (http://www.gscloud.cn). The 30-m LUCC data were provided by the Data Center for Resource and Environment Science (https://www.resdc.cn). The 20-m resolution NDVI data came from the European Space Agency (ESA), Copernicus Open Access Hub (https://scihub.copernicus.eu/dhus/#/home). The soil data were extracted from the 1:1,000,000 soil database of China. The socio-economic data were collected from the Shaanxi Statistical Yearbook, Ankang City Statistical Yearbook, Hanzhong City Statistical Yearbook, Shangluo City Statistical Yearbook, and China Forestry Statistical Yearbook. Data with different dimensions were standardized by the maximum difference normalization method.

3 Methods

3.1 DPSIR model framework for LES

The DPSIR model was used to evaluate LES in this study. The Driving system (D) represents the potential causes of LES change and reflects the basic patterns of socio-economic development and population growth. The Pressure system (P) is the obvious cause of land resource and environmental problems, which is the response caused by D, mainly covering industrial and agricultural pollution emissions, land resources demand, etc. The State system (S) is directly impacted by P and reflects the reality of the land ecosystem, represented by aspects of land use and vegetation coverage. The Impact system (I) is the reaction of the land eco-environmental state changes to human society, mainly defined by the impacts of land state changes on the land productivity and industrial structure. The Response system (R) reflects the active coping strategies adopted by human society to compensate or mitigate changes in the ecological environment. It is noted that R plays a significant role in driving D so that the whole system forms a closed loop for recycling. Besides, the response system (R) can also be used to relieve the pressure and improve the state system, thus potentially improving the overall state of the LES system (Figure 2).
Figure 2 Application of the DPSIR framework to land ecological security (LES)

3.2 Index system

Based upon the specific geographical location and ecological function area of southern Shaanxi (Chang et al., 2019; Liu et al., 2020a), we established an evaluation index of the LES system from the target layer, factor layer, and index layer with consideration of the relevant research results (Li et al., 2019b; Lu et al., 2019; Ma et al., 2019). The target layer is used to measure the overall situation of LES. The factor layer refers to the main factors affecting the LES, including the driver force, pressure, state, impact, and response. The index layer contains 21 indicators, and the explanation for each indicator is shown in Table 1. Indicators are divided into positive indicators and negative indicators according to the attribute.

3.3 The determination of weight

A combination of the Analytic Hierarchy Process (AHP) and entropy weight method was used to calculate the comprehensive weight.
$w_{i}=\frac{\sqrt{w_{AHP_{i}}×w_{ent_{i}}}}{\sum^{n}_{i=1}\sqrt{w_{AHP_{i}}×w_{ent_{i}}}}$
where wi is the comprehensive weight of the ith indicator, and $W_{AHP_{i}}$ and $W_{ent_{i}}$are the AHP weight and entropy weight, respectively. The weights of each indicator are shown in Table 1.
Table 1 Indicators and weights for assessing land ecological security
Target layer Factor layer Number Index layer Unit Index attribute Entropy weight AHP
weight
Comprehensive weight
Land
ecological security
Driving force (D) D1 Growth rate of population % - 0.012 0.023 0.020
D2 Growth rate of gross domestic product (GDP) % + 0.003 0.013 0.007
D3 Per capita GDP person/yuan + 0.066 0.057 0.072
D4 Urbanization level % _ 0.020 0.100 0.052
Pressure
(P)
P1 Population density person/km2 - 0.012 0.058 0.031
P2 Economic density 10,000
yuan/km2
+ 0.242 0.024 0.089
P3 Fertilizer use per unit area of arable land kg/ha - 0.004 0.013 0.008
P4 Plastic film use per unit area of arable land kg/ha - 0.006 0.013 0.010
P5 Grazing intensity of
grassland
10,000 heads/ha - 0.018 0.023 0.024
State
(S)
S1 >25° slope ratio % - 0.048 0.048 0.056
S2 Total organic matter
content
% + 0.100 0.013 0.042
S3 NDVI / + 0.017 0.038 0.030
S4 Net primary productivity of vegetation (NPP) gC/m2 + 0.035 0.026 0.035
S5 Per capita arable land ha/person + 0.040 0.046 0.050
Impact
(I)
I1 Tertiary industrial structure % + 0.037 0.029 0.038
I2 Rural per capita net
Income
yuan + 0.063 0.124 0.103
I3 Grain output per unit area of
arable land
kg/ha + 0.074 0.138 0.118
I4 Per capita food production kg/person + 0.033 0.096 0.066
Response
(R)
R1 GDP energy intensity tons of SCE/yuan - 0.010 0.048 0.026
R2 Afforestation area ha + 0.076 0.024 0.050
R3 Agricultural mechanization degree per unit area of arable land kW/ha + 0.086 0.046 0.073

3.4 Calculating the comprehensive LES Index

The comprehensive LES indices were calculated using the weighted summation method given below:
$LES=\sum^{n}_{i=1}P_{i}×w_{i}$
where Pi represents the standardized value of the ith indicator, and wi is the comprehensive weight of the ith indicator.

3.5 Definition of LES level

The LES evaluation results of 2014 in the middle of the time series were reclassified based on the Natural Breaks (Margarint et al., 2013; Feng et al., 2017). The LES index was divided into five categories safe, relatively safe, critically safe, relatively unsafe, and unsafe (Table 2).
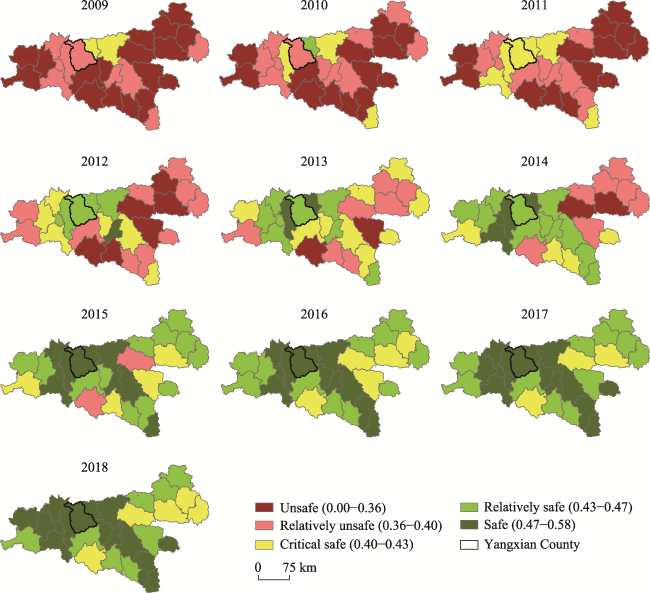
Table 2 The classification of LES level
Grade I II III IV V
Type Safe Relatively safe Critically safe Relatively unsafe Unsafe
Value 0.47-0.58 0.43-0.47 0.40-0.43 0.36-0.40 0.00-0.36

4 Results

4.1 Spatiotemporal evolution of LES in southern Shaanxi

The comprehensive LES index value showed an increasing trend in southern Shaanxi during 2009-2018 (Table 3). In 2009, the highest LES value was 0.415 in Foping County, and the lowest value was 0.289 in Xunyang County. In 2018, the highest value was 0.580 in the Hantai District, and the lowest value was 0.416 in Zhenan County. The average LES value increased from 0.349 in 2009 to 0.481 in 2018. The LES value in Hantai District increased most profoundly, with a positive change of 0.215. The LES value in Shangnan County increased the least, by only 0.055. The LES value in Yangxian increased by 0.148, from 0.385 to 0.533. The LES of Yangxian always ranks among the top six in southern Shaanxi during 2009-2018.
Table 3 The comprehensive LES index of administrative counties in southern Shaanxi from 2009 to 2018
Counties 2009 2010 2011 2012 2013 2014 2015 2016 2017 2018
Hanbin 0.364 0.375 0.386 0.401 0.428 0.451 0.484 0.482 0.502 0.509
Hanyin 0.383 0.384 0.387 0.474 0.445 0.462 0.483 0.497 0.511 0.509
Shiquan 0.345 0.363 0.367 0.402 0.419 0.442 0.468 0.483 0.514 0.515
Ningshan 0.410 0.414 0.421 0.441 0.469 0.463 0.521 0.507 0.544 0.527
Ziyang 0.316 0.325 0.334 0.356 0.375 0.401 0.415 0.432 0.447 0.431
Langao 0.338 0.348 0.356 0.377 0.398 0.422 0.439 0.449 0.468 0.450
Pingli 0.343 0.352 0.366 0.387 0.416 0.447 0.459 0.475 0.497 0.484
Zhenping 0.400 0.406 0.415 0.418 0.442 0.462 0.483 0.497 0.512 0.504
Xunyang 0.289 0.293 0.300 0.333 0.360 0.382 0.404 0.415 0.441 0.440
Baihe 0.342 0.348 0.356 0.380 0.404 0.422 0.448 0.456 0.480 0.481
Hantai 0.365 0.385 0.396 0.432 0.462 0.495 0.482 0.507 0.539 0.580
Nanzheng 0.374 0.390 0.408 0.425 0.452 0.476 0.471 0.489 0.499 0.525
Chenggu 0.394 0.413 0.425 0.458 0.485 0.519 0.497 0.523 0.543 0.567
Yangxian 0.385 0.396 0.406 0.432 0.451 0.468 0.485 0.503 0.511 0.533
Xixiang 0.324 0.341 0.365 0.390 0.409 0.432 0.449 0.453 0.457 0.457
Mianxian 0.344 0.367 0.383 0.408 0.432 0.451 0.432 0.446 0.472 0.488
Ningqiang 0.313 0.328 0.348 0.367 0.383 0.414 0.415 0.450 0.453 0.470
Lüeyang 0.292 0.320 0.355 0.386 0.413 0.446 0.448 0.449 0.454 0.473
Zhenba 0.297 0.317 0.316 0.333 0.348 0.374 0.390 0.416 0.418 0.430
Liuba 0.362 0.383 0.389 0.409 0.430 0.465 0.485 0.502 0.509 0.511
Foping 0.415 0.436 0.409 0.434 0.492 0.501 0.519 0.520 0.480 0.541
Shangzhou 0.327 0.333 0.334 0.358 0.386 0.360 0.448 0.452 0.448 0.459
Luonan 0.344 0.367 0.355 0.380 0.401 0.389 0.457 0.460 0.470 0.455
Danfeng 0.326 0.338 0.339 0.364 0.389 0.382 0.432 0.430 0.447 0.424
Shangnan 0.364 0.362 0.355 0.387 0.406 0.393 0.440 0.447 0.463 0.419
Shanyang 0.339 0.321 0.311 0.341 0.360 0.342 0.419 0.402 0.421 0.421
Zhenan 0.321 0.340 0.338 0.354 0.370 0.357 0.400 0.405 0.425 0.416
Zhashui 0.357 0.371 0.366 0.388 0.428 0.395 0.457 0.456 0.467 0.454
Yangxian’s rank 5 5 6 6 6 5 5 5 6 4
There was an increased number of safe counties and fewer relatively unsafe and unsafe counties from 2009 to 2018. Specifically, the number of unsafe (< 0.36) counties decreased from 17 in 2009 to 0 in 2015 (Figure 3). In 2012, only Shiquan County was at a safe level (≥ 0.47), and by 2018, 15 counties were at safe levels. The safe counties were distributed in the north and south-central areas of Hanzhong and Ankang in 2018. The LES level in Yangxian changed progressively from relatively unsafe in 2009 to critically safe in 2011, to relatively safe in 2012, and then to safe after 2015.
Figure 3 Spatial distribution of the LES level in counties from 2009 to 2018

4.2 The subsystem change and influencing factors of LES in Yangxian County

The driving force index of Yangxian County showed a general increasing trend (Figure 4a), from 0.064 in 2009 to 0.094 in 2018. The valley value of the driving force index was 0.0743 in 2015, mainly due to the sharp decrease of urbanization level indicator, from 0.045 in 2014 to 0.034 in 2015. The per capita gross domestic product (GDP) indicator increased from 0.004 in 2009 to 0.040 in 2018, but the urbanization level indicator decreased from 0.045 to 0.039. With rapid socio-economic development, per capita GDP increased from 10,421 person/yuan in 2009 to 36,191 person/yuan in 2018, which has become an important driving force for the change of LES.
Figure 4 Evaluation results of each subsystem index in Yangxian County from 2009 to 2018
The pressure index showed no obvious increasing trend (Figure 4b), from 0.055 in 2009 to 0.062 in 2018. The following indicators remained essentially unchanged: population density, fertilizer, and plastic film use per unit area of arable land. The economic density and grazing intensity indicators showed a slight increase from 2009 to 2018, with positive changes of 0.005 and 0.002, respectively.
Table 4 Estimated parameters and ANOVA of the stepwise linear regression analysis
Model Input variable Adjusted R2 P Linear regression equation
1 I2 0.989 <0.001 y=0.374+1.584x
2 I2(x1), I3(x2) 0.996 <0.001 y=0.297+1.558x1+1.078x2
3 I2(x1), I3(x2), P5(x3) 0.998 <0.001 y=0.266+1.470x1+0.960x2+3.524x3
The state index showed a trend of first increasing and then decreasing from 2009 to 2018 (Figure 4c). In 2015, the state index reached the highest value of 0.116, mainly due to the sharp increase of NPP indicator, from 0.017 in 2014 to 0.028 in 2015. The following indicators remained essentially unchanged: slope, total organic matter content, and per capita arable land. The NPP and NDVI indicators showed an increasing trend from 2009 to 2018, with increases of 0.006 and 0.005, respectively. The growth of vegetation cover plays an important role in air purification, climate regulation, and soil conservation to stabilize the land ecosystem and promote LES.
The impact index generally increased from 0.128 in 2009 to 0.227 in 2018 (Figure 4d). The following indicators remained essentially unchanged: tertiary industrial structure, grain output per unit area of arable land, and per capita food production. The rural per capita net income indicator increased significantly, from 0.001 in 2009 to 0.097 in 2018. So the growth of the rural per capita net income from 3063 yuan to 10,046 yuan (do not take inflation into account) could promote LES. The improvement of the state of LES increased the income of farmers and improved their standard of living.
The response index showed an obvious fluctuating trend (Figure 4e), with the lowest value of 0.038 occurring in 2010. The GDP energy intensity indicator remained essentially unchanged. The afforestation area indicator first decreased and then increased from 2009 to 2018, with its lowest value of 0.002 occurring in 2013 and 2014 and its highest value of 0.015 occurring in 2009. The agricultural mechanization degree indicator first increased and then decreased from 2009 to 2018, with its highest value of 0.018 occurring in 2015. By improving the degree of agricultural mechanization, the scale and industrialization of agriculture could be improved to ensure the healthy operation of the land ecosystem.
Stepwise linear regression between the comprehensive LES index and the 21 indicators is shown in Table 4. The results show that rural per capita net income (I2), grain output per unit area of arable land (I3), and grazing intensity (P5) could explain 99.8% of the LES variance. Rural per capita net income (I2) alone could explain 98.9% of the LES variance, and the combination of I2 and I3 explains 99.6% of the LES variance. The associated P-values are all less than 0.001.

4.3 Organic agriculture development and poverty alleviation in Yangxian County

Since the world’s only seven crested ibises were discovered in Yangxian County in the 1980s, the application of mineral fertilizers and pesticides have not been allowed in arable land, and large-scale breeding practices have been banned in water source areas. Furthermore, strict restrictions have been placed upon mineral exploitation and high energy-consuming and polluting enterprises. The ban on the use of pesticides and mineral fertilizers has resulted in economic losses of more than 20 million yuan. The dichotomy between ecological protection and the livelihood of farmers has become increasingly prominent, so Yangxian is said to have fallen into “green poverty” (Figure 5). In 2003, the Yangxian County government proposed an “Ecological County Strategy” to develop ecological agriculture, ecological industry, and ecological culture. In 2005, the county government put forward an “organic food industrial development plan” under the policy guidance of both the central and Shaanxi provincial governments. Many measures have been taken to develop the organic industry, such as establishing 17 demonstration areas for soil testing and formulated fertilization strategies in the grain, rape, melon, and fruit industries which occupy an area of 12,133 ha. Further efforts include upgrading low- and medium-yield fields in 18 villages, establishing demonstration areas of green prevention and control, and formulating strategies for disease and pest control on the rice and wheat fields which encompass 2000 ha.
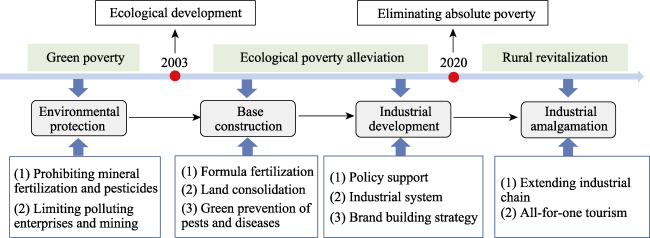
Figure 5 Ecological poverty alleviation process in Yangxian County
A leading group for developing the organic industry was established in 2010, which implemented policies that support organic production enterprises such as subsidized loans, land subsidies, and land allocation. With an annual investment of 30 million yuan, the leading group set up an organic development office responsible for formulating production standards, planning, and establishing a building brand for the organic industry. In addition, an organic industry monitoring team was established to achieve the normal supervision of base, enterprise, and operating organization based on the “county, township, and village” supervision network. Social capital was absorbed to develop the organic industry and research organic food production. Expert workstations were established with relevant scientific research institutes, and related expert forums and technology training were regularly carried out for organic industry. The government encourages farmers to participate in the organic industry by providing seed and fertilizer subsidies. Farmers can obtain rent through land transfer and dividends by investing their land and capital in organic industry cooperatives. Farmers can also work as salaried employees in organic enterprises.
Presently, Yangxian County’s organic product has certified 9613 ha of 83 types in 15 categories. The organic industrial output value accounted for more 1/5 of the total agricultural output value in Yangxian. The rural per capita net income in the organic production demonstration zone is more than 1500 yuan higher than the county average. Ten bases and ten demonstration lines have been built to produce and process organic products, thus providing steady and sustainable income for poor households. A total of 14 leading organic companies signed poverty alleviation agreements with poor people, forming a “production-processing-sales” community of interest. More than 20 leading organic enterprises and 386 agricultural cooperatives have attracted poor people to work, resulting in an annual per capita income of poor families of more than 2000 yuan, helping to pull 11,500 households and 33,600 poor people out of poverty. During the period of rural revitalization, the organic planting and breeding industrial chain will be extended to promote agricultural waste recycling and ensure the sustainable development of the organic industry. At the same time, large-scale tourism and leisure agriculture will promote the coordinated development of all-for-one tourism and the organic industry.
Caoba Village is located in the core area of Crested Ibis Natural Reserve. The agricultural output reduction caused by environmental protection efforts resulted in a significant reduction of agricultural economic benefits. Many farmers migrated for work, and the issue of arable land abandonment was very serious. In 2005, agricultural production became inefficient and "small, scattered, chaotic" under the ecological protection and household contract responsibility system (Table 5). Therefore, Caoba began to explore organic agricultural development paths such as growing Whangkeumbae pears, rice, and rape. In 2009, Caoba combined its ecological advantages with market demand to vigorously develop organic agriculture. The Crested Ibis Lake Professional Cooperative was established by integrating resources and activating elements to carry out the "cash shareholding, grain shareholding, and joint venture shareholding" model. Caoba has effectively transformed its resources into assets, funds into shares, and villagers into shareholders and promoted the integration of organic planting, processing, and rural tourism. National financial subsidies and social donations funds were used to expand the scale of cooperatives by "asset quantification and asset shareholding". Dividends are distributed according to 20% cash, 20% collective, and 60% second dividend based on land output and overall operating profit. The cooperative established an organic agricultural product processing line and attained standardized production. In total, 35 kinds of organic products in four categories have been developed and certified. Three associations and five companies were set up to increase farmers’ income and develop a collective economy. In 2019, Caoba helps villagers from 21 administrative villages plant organic black valley encompassing 400 ha, supporting 345 poor households. The annual per capita income increased by more than 3000 yuan compared with 2016. During the new period, Caoba developed rural tourism by building experience park, sightseeing park, demonstration park, and tourist reception center. A total of 56,000 tourists visited in 2018, with a tourism income of 800,000 yuan. In 2019, Caoba built an agricultural industry chain through a land trust to promote arable land consolidation, mechanized farming, and improved agricultural production scale and efficiency.
Table 5 The process of organic agriculture and poverty alleviation in Caoba Village
Period Major measures Major effectiveness Rural development status
Exploration period (2005-2008) ① Building roads to connect
villages and groups
② Building water storage ponds, improving irrigation facilities and field road networks
③ Introducing Whangkeumbae pear and transforming low-yield pear orchard
The agricultural output was low, and the rural per capita net income was only 1800 yuan.
The village collective owned as much as 200,000 yuan
① Village-environment
“dirty, messy, bad”
② Agricultural production
“small, scattered, chaotic”
③ Land abandonment
low efficiency
Transformation
period
(2009-2017)
① Building comprehensive service buildings and kindergartens
② Integrating resources, establishing Crested Ibis Lake
professional cooperative
③ Developing rural tourism
① The per-mu (15 mu =1 ha) output of organic rice was 2100 yuan, which was 1.5 times that of ordinary rice.
② The rural per capita net income was 11,000 yuan, and the cumulative village collective income was 826,000 yuan.
① Significant improvement
in production and living
conditions
② Cooperative operation
③ Collective management
New period
(after 2018)
① Land trust to improve production scale and efficiency
② Developing agricultural industrial parks, demonstration parks, and leisure farms, and promoting coordinated development among rural production-living-ecological functions
③ Building agricultural industry chain of production, sightseeing, leisure, vacation, and entertainment
① The rural per capita net income was 13,500 yuan, and the cumulative village collective income was 130,000 yuan.
② Receiving 56,000 tourists, with a total tourism income of 800,000 yuan
① Thriving businesses
② Pleasant living
environment

Prosperity

5 Discussion

5.1 Developing ecological industry and promoting ecological poverty alleviation

Considering China’s ecological civilization and rural revitalization strategy, it was necessary to coordinate eco-environmental protection with poverty alleviation and development. Studies show that the spatial distribution of poverty-stricken areas is highly coupled with national key ecological function areas and development-restricted zones (Zhou et al., 2020). Ecological poverty alleviation provides a sustainable way to reduce poverty by utilizing ecological resources and gaining further industrialization and urbanization at the expense of the eco-environment (Lei et al., 2021). The feasible pathways for alleviating ecological poverty include natural resources and ecological engineering construction, ecological compensation, ecological public welfare posts, the development of characteristic ecological industries, and ecological migration (Yang et al., 2019; Yang et al., 2021b).
The ecological industries in China consist mainly of agriculture and services. The former mainly includes organic agriculture and the under-forest industry, and the latter includes ecological tourism and carbon sinks. Organic agriculture relies on high-quality air, water and soil. In ecologically rich resource and protection areas, green agriculture, organic agriculture, and geographical indication products represent favorable ways to attain sustained and dynamic coordination between industrial development and the ecological environment. Based on the concept of ecological industrialization, activating local ecological resources to develop ecological industries could promote green prosperity and alleviate poverty. Government, enterprises, party organizations, and cooperatives should be included in the management and organization of ecological industry, emphasizing farmer participation and the potential to increase farmers’ income. Diversified ecological poverty alleviation models such as cultivating industrial brands, extending industrial chains, and developing rural tourism should be adopted for the sustained and stable development of characteristic industries. Taking Yongshun County in Hunan as an example, the activation of the forest ecological resource results in the cultivation of symbiotic economic crop products such as forest grass, forest medicine, forest fruit, forest oil, forest tea, and forest tourism, as well as the compound production mode of under-forest breeding to promote circular and multi-beneficial ecological industries. The integration of the local agricultural resources in Jianhe County, located in the southeastern part of Guizhou Province, has led to an ecological industrial system with edible fungus as its main industry, besides the Uncaria, ecological chicken, and ecological pig industries were developed simultaneously. Similarly, in southern Shaanxi, the reliance on unique ecological resources such as water, air, and forests, could develop ecological agriculture, ecological industry, and ecological tourism to increase the county’s revenue and farmers’ property income (Table 6).
Table 6 The typical case of ecological poverty alleviation in southern Shaanxi Province
City County Pathways Industries Model
Hanzhong Foping Ecological forest ranger
Ecological
compensation
Ecological
resettlement
Under-forest
economy
Tourism
Characteristic planting and breeding
Chinese herbal medicines such as Gastrodia elata, Polyporus, Cornus officinalis
Enterprises+party organizations+village collective economic cooperatives+farmers+N
Ankang Ningshan Dried fruits, forest tourism, under-forest medicine, characteristic breeding, and flower seedlings Ecology+forestry industry+forest ranger
Ecology+forest rights +resettlement
Ecology+forestry engineering +tourism
Shangluo Zhashui Edible fungi such as black fungus and mushroom
Economic forests such as walnuts and chestnuts
Branch+reform+collective econo my+companies+base+poor households

5.2 LES assessment and influencing factor analysis

The relationship between LES and its influencing factors is complex (Feng et al., 2018). This study showed that rural per capita net income, grain output per unit area of arable land, and grazing intensity could explain 99.8% of the LES variance (Table 4). Among these leading factors, rural per capita net income exerted the most prominent impact on LES, which is consistent with previous studies (Wen et al., 2021) and reflects the living standards of farmers (Yang et al., 2020). The higher the living standard, the easier to maintain LES. In Yangxian, the rural per net income increased from 3063 yuan to 10,046 yuan by developing the organic industry and building a characteristic brand during 2009-2018. The factor of grain output per unit area of arable land describes land production efficiency. Various soil and water conservation measures were taken to reduce the loss of soil nutrients, improve soil physical and chemical properties, and increase the number of soil microorganisms. The improvement of the agricultural production condition increased land utilization efficiency and promoted sustainable land use. The factor of grazing intensity describes the number of livestock per unit area of grassland, which exerts pressure on the grassland ecosystem by feeding, trampling, and excretion (Pakeman et al., 2000). Moreover, pesticides, fertilizers, and plastic film in the environment have been linked to soil, water, and air pollution. Similar studies showed that environmental pollution is an important factor affecting regional LES (Mao et al., 2013; Pope and Wu, 2014; Popkova et al., 2016). An increased per-capita GDP will transform the industrial structure, cause the green environmental protection of tertiary industry to grow, and further enhance the state’s attention to environmental protection and investment (Yang et al., 2021a).
This study comprehensively considered natural, economic, social, ecological, and environmental factors to quantify and evaluate LES based on the DPSIR model. However, due to data unavailability, the assessment index system has certain limitations. Some indicators were not considered, such as the sewage treatment rate, harmless treatment rate of domestic waste, and pollution control investment. Thus, in future research, multi-source data and precise indicators will be considered to improve the assessment accuracy and better reflect the spatiotemporal differences of LES (Liu et al., 2019a). Besides, it is noted that this assessment relied mainly on the available statistical dataset, and whether the evaluated LES level is safe or unsafe is a relative estimate (Wang et al., 2014). Although this approach lacks absolute accuracy, this study clearly reflects the change in land ecosystem conditions over time. Therefore, it should assist officials and citizens in resolving issues regarding regional LES improvements.

6 Conclusion

Based on the DPSIR model, this study constructs an evaluation system to quantify the spatiotemporal changes of land ecological security (LES) in 28 counties of southern Shaanxi Province from 2009 to 2018. Taking Yangxian County as a case study, we employed stepwise linear regression analysis to explore the influencing factors of LES. Finally, this study clarified the promoting mechanisms of ecological land resource utilization to organic agriculture development and poverty alleviation. The main conclusions are summarized as follows: (1) Yangxian’s LES always ranks in the top six in the southern Shaanxi region during 2009-2018. The LES index in Yangxian increased from 0.385 in 2009 to 0.533 in 2018, and the LES level changed from relatively unsafe to safe. (2) In Yangxian, the driving force and impact index showed an increasing trend. The indicators of rural per capita net income, grain output per unit area of arable land, and grazing intensity could explain 99.8% of the LES variance. (3) Relying on land ecological resources, Yangxian increased farmers’ income and alleviated poverty by establishing innovative land policy, developing organic agriculture, and rural tourism. Caoba Village effectively transformed its resources into assets, funds into shares, and villagers into shareholders by integrating its resources and establishing a Crested Ibis Lake professional cooperative. These results could provide important theoretical support and a practical reference for activating ecological resources to increase a county’s revenue and farmers’ income in restricted development zones.
[1]
Candiotto L Z, 2018. Organic products policy in Brazil. Land Use Policy, 71: 422-430.

DOI

[2]
Chang Y, Hou K, Wu Y et al., 2019. A conceptual framework for establishing the index system of ecological environment evaluation: A case study of the upper Hanjiang River, China. Ecological Indicator, 107: 105568.

DOI

[3]
DeClerck F, Ingram J C, Rumbaitis del Rio C M, 2006. The role of ecological theory and practice in poverty alleviation and environmental conservation. Frontiers in Ecology and the Environment, 4(10): 533-540.

DOI PMID

[4]
Du Y W, Gao K, 2020. Ecological security evaluation of marine ranching with AHP-entropy-based TOPSIS: A case study of Yantai, China. Marine Policy, 122: 104223.

DOI

[5]
Fan W G, Dong X B, Wei H J et al., 2018. Is it true that the longer the extended industrial chain, the better the circular agriculture? A case study of circular agriculture industry company in Fuqing, Fujian. Journal of Cleaner Production, 189: 718-728.

DOI

[6]
Feng Y J, 2017. Modeling dynamic urban land-use change with geographical cellular automata and generalized pattern search-optimized rules. International Journal of Geographical Information Science, 31(6): 1198-1219.

[7]
Feng Y J, Liu Y, Liu Y, 2017. Spatially explicit assessment of land ecological security with spatial variables and logistic regression modeling in Shanghai, China. Stochastic Environmental Research and Risk Assessment, 31: 2235-2249.

DOI

[8]
Feng Y J, Yang Q Q, Tong X H et al., 2018. Evaluating land ecological security and examining its relationships with driving factors using GIS and generalized additive model. Science of The Total Environment, 633: 1469-1479.

DOI

[9]
Foley J A, DeFries R, Asner G P et al., 2005. Global consequences of land use. Science, 309(5734): 570-574.

DOI

[10]
Guo Y Z, Liu Y S, 2021. Poverty alleviation through land assetization and its implications for rural revitalization in China. Land Use Policy, 105: 105418.

DOI

[11]
Hou C X, Zhou L H, Wen Y et al., 2018. Farmers’ adaptability to the policy of ecological protection in China: A case study in Yanchi County, China. The Social Science Journal, 55(4): 404-412.

DOI

[12]
Hua Y E, Yan M A, Limin D, 2011. Land ecological security assessment for Bai Autonomous Prefecture of Dali based using PSR model: With data in 2009 as case. Energy Procedia, 5: 2172-2177.

DOI

[13]
Lei M, Yuan X Y, Yao X Y, 2021. Synthesize dual goals: A study on China’s ecological poverty alleviation system. Journal of Integrative Agriculture, 20(4): 1042-1059.

DOI

[14]
Li X B, Tian M R, Wang H et al., 2014. Development of an ecological security evaluation method based on the ecological footprint and application to a typical steppe region in China. Ecological Indicators, 39: 153-159.

DOI

[15]
Li Y H, Wang Y S, Yan J Y et al., 2019a. Analysis and research on typical cases of land engineering and rural sustainable development. Strategic Study of CAE, 21(2): 40-47. (in Chinese)

[16]
Li Y R, Zhang X C, Zhi C et al., 2021. Towards the progress of ecological restoration and economic development in China’s Loess Plateau and strategy for more sustainable development. Science of The Total Environment, 756: 143676.

DOI

[17]
Li Z T, Li M, Xia B C, 2020. Spatio-temporal dynamics of ecological security pattern of the Pearl River Delta urban agglomeration based on LUCC simulation. Ecological Indicators, 114: 106319.

DOI

[18]
Li Z T, Yuan M J, Hu M M et al., 2019b. Evaluation of ecological security and influencing factors analysis based on robustness analysis and the BP-DEMALTE model: A case study of the Pearl River Delta urban agglomeration. Ecological Indicators, 101: 595-602.

DOI

[19]
Liu C X, Wu X L, Wang L, 2019a. Analysis on land ecological security change and affect factors using RS and GWR in the Danjiangkou Reservoir area, China. Applied Geography, 105: 1-14.

DOI

[20]
Liu W, Li J, Xu J, 2020a. Impact of the ecological resettlement program in southern Shaanxi Province, China on households’ livelihood strategies. Forest Policy and Economics, 120: 102310.

DOI

[21]
Liu W, Xu J, Li J et al., 2019b. Rural households’ poverty and relocation and settlement: Evidence from western China. International Journal of Environmental Research and Public Health, 16(14): 2609.

DOI

[22]
Liu Y S, 2018. Introduction to land use and rural sustainability in China. Land Use Policy, 74: 1-4.

DOI

[23]
Liu Y S, Fang F, Li Y H, 2014. Key issues of land use in China and implications for policy making. Land Use Policy, 40: 6-12.

DOI

[24]
Liu Y S, Feng W L, Li Y R, 2020b. Modern agricultural geographical engineering and agricultural high-quality development: Case study of loss hilly and gully region. Acta Geographica Sinica, 75(10): 2029-2046. (in Chinese)

[25]
Liu Y S, Liu Y, Chen Y F et al., 2010. The process and driving forces of rural hollowing in China under rapid urbanization. Journal of Geographical Sciences, 20(6): 876-888.

DOI

[26]
Liu Y S, Wang Y S, 2019. Rural land engineering and poverty alleviation: Lessons from typical regions in China. Journal of Geographical Sciences, 29(5): 643-657.

DOI

[27]
Long H L, Li Y R, Liu Y S et al., 2012. Accelerated restructuring in rural China fueled by ‘increasing vs. decreasing balance’ land-use policy for dealing with hollowed villages. Land Use Policy, 29(1): 11-22.

DOI

[28]
Lu S S, Qin F, Chen N et al., 2019. Spatiotemporal differences in forest ecological security warning values in Beijing: Using an integrated evaluation index system and system dynamics model. Ecological Indicators, 104: 549-558.

DOI

[29]
G B, Liao T J, Yao Q S et al., 2019. Spatiotemporal variation and land ecological security and its evaluation in Chongqing City based on DPSIR-EES-TOPSIS model. Research of Soil and Water Conservation, 26(6): 249-258: 266. (in Chinese)

[30]
Ma L B, Bo J, Li X Y et al., 2019. Identifying key landscape pattern indices influencing the ecological security of inland river basin: The middle and lower reaches of Shule River Basin as an example. Science of The Total Environment, 674: 424-438.

DOI

[31]
Mao X Y, Meng J J, Xiang Y Y, 2013. Cellular automata-based model for developing land use ecological security patterns in semi-arid areas: A case study of Ordos, Inner Mongolia, China. Environmental Earth Sciences, 70(1): 269-279.

DOI

[32]
Margarint M C, Grozavu A, Patriche C V, 2013. Assessing the spatial variability of coefficients of landslide predictors in different regions of Romania using logistic regression. Natural Hazards and Earth System Sciences, 13: 3339-3355.

[33]
Meng F X, Guo J L, Guo Z Q et al., 2021. Urban ecological transition: The practice of ecological civilization construction in China. Science of The Total Environment, 755: 142633.

DOI

[34]
Pakeman R J, Thwaites R H, Duc M G et al., 2000. Vegetation re-establishment on land previously subject to control of Pteridium aquilinum by herbicide. Applied Vegetation Science, 3(1): 95-104.

DOI

[35]
Pope R, Wu J G, 2014. Characterizing air pollution patterns on multiple time scales in urban areas: A landscape ecological approach. Urban Ecosystems, 17(3): 855-874.

DOI

[36]
Popkova E G, Shakhovskaya L S, Abramov S A et al., 2016. Ecological clusters as a tool of improving the environmental safety in developing countries. Environment, Development and Sustainability, 18(4): 1049-1057.

DOI

[37]
Ruan W Q, Li Y Q, Zhang S N et al., 2019. Evaluation and drive mechanism of tourism ecological security based on the DPSIR-DEA model. Tourism Management, 75: 609-625.

DOI

[38]
Shen Y, Cao H M, Tang M F et al., 2017. The human threat to river ecosystems at the watershed scale: An ecological security assessment of the Songhua River Basin, Northeast China. Water, 9: 219.

DOI

[39]
Shi Y S, Li J Q, Xie M Q, 2018. Evaluation of the ecological sensitivity and security of tidal flats in Shanghai. Ecological Indicators, 85: 729-741.

DOI

[40]
Su S L, Li D, Yu X et al., 2011. Assessing land ecological security in Shanghai (China) based on catastrophe theory. Stochastic Environmental Research and Risk Assessment, 25(6): 737-746.

DOI

[41]
Sun M Y, Li X H, Yang R J et al., 2020. Comprehensive partitions and different strategies based on ecological security and economic development in Guizhou Province, China. Journal of Cleaner Production, 274: 122794.

DOI

[42]
Trnka M, Kersebaum K C, Eitzinger J et al., 2013. Consequences of climate change for the soil climate in Central Europe and the central plains of the United States. Climatic Change, 120(1): 405-418.

DOI

[43]
Vedeld P, Jumane A, Wapalila G et al., 2012. Protected areas, poverty and conflicts: A livelihood case study of Mikumi National Park, Tanzania. Forest Policy and Economics, 21: 20-31.

DOI

[44]
Wang H Y, Qin F, Zhang X C, 2019. A spatial exploring model for urban land ecological security based on a modified artificial bee colony algorithm. Ecological Informatics, 50: 51-61.

DOI

[45]
Wang L, Bian Z F, Chen H Q, 2014. Land ecological security assessment for Yancheng city based on catastrophe theory. Earth Sciences Research Journal, 18(2): 181-187.

DOI

[46]
Wang W X, Li M X, 2020. Spatiotemporal change of land ecological security in human based on DPSIR. Chinese Journal of Ecology, 39(8): 2724-2736. (in Chinese)

[47]
Wang Y S, Li Y H, 2019. Promotion of degraded land consolidation to rural poverty alleviation in the agro-pastoral transition zone of northern China. Land Use Policy, 88: 104114.

DOI

[48]
Wang Y S, Li Y H, Liu Y S, 2020. China’s sandy land consolidation engineering and regional agricultural sustainable development practice under water resource constraint: Case study of Yulin City in Shaanxi Province, China. Bulletin of Chinese Academy of Sciences, 35(11): 1408-1416. (in Chinese)

[49]
Ward C, Swyngedouw E, 2018. Neoliberalisation from the ground up: Insurgent capital, regional struggle, and the assetisation of land. Antipode, 50(4): 1077-1097.

DOI

[50]
Wen M X, Zhang T, Li L et al., 2021. Assessment of land ecological security and analysis of influencing factors in Chaohu Lake Basin, China from 1998-2018. Sustainability, 13(1): 358.

DOI

[51]
Wu X, Liu S L, Sun Y X et al., 2019. Ecological security evaluation based on entropy matter-element model: A case study of Kunming city, southwest China. Ecological Indicators, 102: 469-478.

DOI

[52]
Xu L Y, Yin H, Li Z X et al., 2014. Land Ecological Security Evaluation of Guangzhou, China. International Journal of Environmental Research and Public Health, 11(10): 10537-10558.

DOI

[53]
Yang R Y, Du W Y, Yang Z S, 2021a. Spatiotemporal evolution and influencing factors of urban land ecological security in Yunnan Province. Sustainability, 13(5): 2936.

DOI

[54]
Yang S Q, Yang Z S, Long L J et al., 2019. Theoretical research on cultivated land ecological compensation based on targeted poverty alleviation and development. Asian Agricultural Research, 11(12): 24-31.

[55]
Yang Y J, Ge S, Lu S, 2020. Assessment of land ecosystem health with Monte Carlo simulation: A case study in Qiqihaer, China. Journal of Cleaner Production, 250: 119522.

DOI

[56]
Yang Y, Wang L, Yang F et al., 2021b. Evaluation of the coordination between eco-environment and socioeconomy under the “Ecological County Strategy” in western China: A case study of Meixian. Ecological Indicators, 125: 107585.

DOI

[57]
Zhang F T, Wang L C, Su W C, 2015. The safety evaluation of water resources based on DPSIRM conceptual framework in Karst region. China Environment Science, 35(11): 3511-3520. (in Chinese)

[58]
Zhang X C, Liu Y S, Li Y R et al., 2020. Mechanism and typical of rural ecological industrialization in the loess hilly-gully region of China. Resource Science, 42(7): 1275-1284. (in Chinese)

[59]
Zhou Y, Guo L Y, Liu Y S, 2019. Land consolidation boosting poverty alleviation in China: Theory and practice. Land Use Policy, 82: 339-348.

DOI

[60]
Zhou Y, Li Y R, Liu Y S, 2020. The nexus between regional eco-environmental degradation and rural impoverishment in China. Habitat International, 96: 102086.

DOI

[61]
Zhou Y, Liu Y S, 2018. China’s fight against soil pollution. Science, 362(6412): 298.

DOI

Outlines

/