Original article

Construction of ecological security patterns and ecological restoration zones in the city of Ningbo, China

  • ZHANG Haitao , 1 ,
  • LI Jialin , 1, 2, * ,
  • TIAN Peng 1 ,
  • PU Ruiliang 3 ,
  • CAO Luodan 1
Expand
  • 1. Department of Geography and Spatial Information Techniques, Ningbo University, Ningbo 315211, Zhejiang, China
  • 2. Ningbo Universities Collaborative Innovation Center for Land and Marine Spatial Utilization and Governance Research at Ningbo University, Ningbo 315211, Zhejiang, China
  • 3. School of Geosciences, University of South Florida, Tampa, FL 33620-5250, USA
*Li Jialin (1973-), PhD and Professor, E-mail:

Zhang Haitao (1997-), Master Candidate, specialized in coastal ecological environment. E-mail:

Received date: 2021-08-05

  Accepted date: 2021-11-18

  Online published: 2022-06-25

Supported by

National Natural Science Foundation of China(No.41976209)

Abstract

Studying an ecological restoration zoning process under the background of ecological security patterns is of great significance to the rapid adjustment and optimization of a landscape pattern. In this study, a remote sensing ecological index and a morphological spatial pattern analysis method were used to assess the quality of habitats and identify ecological sources in the city of Ningbo; ecological corridors, ecological pinch points, and ecological barrier points were extracted by using a circuit theory to construct ecological security patterns and ecological restoration zones. The results indicate: (1) There were 47 ecological sources, and 83 key ecological corridors in Ningbo, and the ecological land area was about 1898.39 km2, accounting for 19.89% of the total study area. (2) The ecological source areas were distributed in “one patch and three belts”, and the low-resistance ecological corridors were concentrated in southern Yuyao city, western Haishu district, and central and western Fenghua district; the ecological network in the western and southern regions was dense. (3) There were four types of ecological restoration zones that need to be established, which were prioritized restoration zones, prioritized protection zones, key conservation zones, and general conservation zones distributed hierarchically from inner part towards outside. (4) Ninghai county, Yuyao city, and Fenghua district had large ecological land areas, however, prioritized restoration and protection zones in Ninghai and Fenghua were also large. The analysis results are expected to provide a reference for optimizing a territorial ecological space in a city.

Cite this article

ZHANG Haitao , LI Jialin , TIAN Peng , PU Ruiliang , CAO Luodan . Construction of ecological security patterns and ecological restoration zones in the city of Ningbo, China[J]. Journal of Geographical Sciences, 2022 , 32(4) : 663 -681 . DOI: 10.1007/s11442-022-1966-9

1 Introduction

With rapid urbanization, the fragmentation of surface landscapes is increasingly aggravated (Liu et al., 2016); artificial surfaces are continuously expanding while natural landscapes are eroded and tend to be dispersed and isolated; human activities have exerted significant impacts on horizontal ecological processes (Chen and Zhou, 2005; Yu et al., 2006). Consequently, most ecosystem services are under a degenerated state (Carpenter et al., 2009). As ecological civilization construction is continuously boosting under the “ecology first” background, the ecological protection and restoration through reasonable construction of ecological layout has become an important measure to maintain a regional ecological security (Ma et al., 2004). However, a large-scale ecological restoration is relatively difficult at a regional scale with well-developed cities, industrial agglomerations, and dense population. Therefore, the hierarchical and regional ecological protection and restoration of homeland is a significant means of realizing accurate adjustment and maintaining regional ecological security in highly-intense developed regions (Wang et al., 2020).
An ecological security pattern constructs an ecological network by identifying ecological sources, constructing resistance surface and extracting ecological corridors, thus forming a regional ecological security pattern (Yu, 1999). This mainstream paradigm has been extensively applied to typical areas with fragile habitats such as mountainous areas (Huang et al., 2019), drainage basins (Ma et al., 2019), cities (Li et al., 2020b) and mining areas (Li et al., 2020b), providing a reference for strengthening the space connection of a system structure, adjusting ecological functions and processes, and improving regional ecological environments (Kavanagh et al., 2004).
Ecological sources are habitats of species, which can be identified by the following methods: (1) Direct identification method (Pan and Liu, 2015), with which scenic spots or ecological protection red lines are directly selected as ecological sources, but this method can hardly embody the internal ecological quality and difference. (2) Threshold screening method, with which forest land, grassland and water body with an area, respectively, greater than 1 km2, 3 km2 or 10 km2 are chosen according to land use types. (3) Compound analysis method, with which an integrated ecosystem services value (Peng et al., 2019; Xu et al., 2019; Tian et al., 2021) and human ecological demand (Zhang et al., 2017; Jiang et al., 2021) are used to select ecological sources. Selected indicators (e.g., water retention, soil conservation, carbon storage, habitat quality, etc.) for the above methods are comprehensive. In addition, this selection process also relies on measured data, and thus, the lack of measured data may affect the accuracy of the selected indicators.
Resistance surface, which reflects the difficulty in species migration on the earth surface, is constructed commonly through the following methods: (1) Value assignment for land use types featured by a single index (Yang et al., 2017), which militates against the manifestation of internal differences. (2) Hierarchical area setting method (Liu et al., 2018), with which resistance values are set according to the area difference among different land use types, and this method can embody the internal differences but the type of resistance source is single. (3) Multi-index superposition method (Fu et al., 2020), which sets resistance values according to natural and human factors like land use, terrain and topography and road network, and this method not only selects multi-index from multiple aspects but also considers internal differences.
Ecological corridor is a channel for material migration and energy flow between ecological sources and possible route for the migration of species, with a certain redundancy. The common extraction methods of ecological corridors may include: (1) Minimum cumulative resistance (MCR) model extraction method (Peng and Zhou, 2019; Yin et al., 2020), with which the extraction process is convenient; but the corridors are not random; the simulation of species migration is restricted; and the extracted corridors fail to embody the width and importance. (2) Circuit theory (Song and Qin, 2016; Zhang et al., 2017; Fang et al., 2020), which simulates ecological processes through the relationship between current and resistance and can reflect the randomness of species migration, and, besides, the corridors extracted can identify the importance of a corridor width. Hence, the circuit theory is more persuasive in case of lacking verification.
To sum up, current research contents and methods of ecological security patterns, though being relatively mature, can still be enriched and perfected from the following three aspects: 1) the objectivity of evaluation indices may be enhanced while the subjectivity in the selection of ecological sources should be relieved; 2) the resistance surface can be constructed from multiple aspects and factors, and the internal differences of elements can be refined; 3) the ecological corridors can be extracted by selecting a method that can relatively cater to species migration, so as to build an ecological network.
In this study, a remote sensing ecological index (RSEI) coupling four ecological environment indicators were adopted. The indictors reflect the impact of urban expansion, climate change, and vegetation change on ecological environment (Xiong et al., 2021), and they can quantify the ecological environment and work for detecting, simulating and predicting spatiotemporal changes of regional ecological quality (Liao and Jiang, 2020; Xiong et al., 2021). The RSEI-based assessment process only relies on the availability of satellite images; the index is in a very general form without manually setting parameters (Xu, 2013a), and thus it can more objectively assess the regional ecological environment (Xu, 2013b). In short, we used the RSEI to evaluate the quality of the regional ecological environment, enriched the objectivity of ecological source identification, refined the internal heterogeneity of the resistance surface from differences in an area, distance and type. Meanwhile, we also used the circuit theory to construct ecological restoration zones based on ecological security patterns and expected to provide a reference for optimizing territorial ecological space in a city.

2 Study area and data

2.1 Study area

Locating at the northeastern Zhejiang Province and south bank of Hangzhou Bay, Ningbo city (120°55'-122°16'E, 28°51'-30°33'N) is an economic center at the south wing of the Yangtze River Delta, having a jurisdiction over six districts, two counties and two county-level cities, with a total area of about 9543 km2 (Figure 1). Topographically, it is high in the southwest and low in the northeast, with a plain area accounting for about 40.30%. There are many low mountains and hills, numerous sea islands and circuitous coastlines, and the cities are mainly seated on the northern plains. It belongs to a subtropical monsoon climate with sufficient heat resources and abundant rainfall, and the dominant vegetations are subtropical evergreen forests, which are mainly distributed in hilly and mountainous areas. Under the topographic influence, relatively fragmented geomorphic units and continuously expanded urban built-up areas have generated important effects on the spatial distribution of ecological sources and corridors; particularly, valley ecological degradation imposes a stress on the connectivity of ecological corridors.
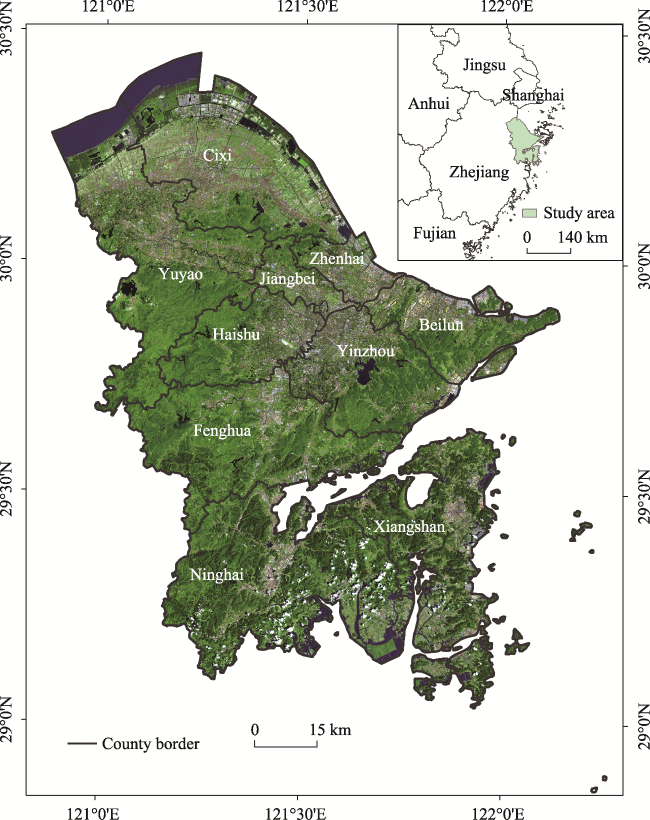
Figure 1 The geographical location of Ningbo city, shown in a satellite color composite image

2.2 Data and preprocessing

Two scenes of Landsat 8 OLI/TIRS C1 Level-1 imagery, acquired on August 16, 2020, were screened out to perform preprocessing such as radiometric calibration, atmospheric correction, mosaicking and clipping. Land use types were verified and corrected via Google Earth through visual interpretation, and land use types were reclassified into farmland, green land (forest and grassland), water body, built-up land and bare land. The ecological protection red line in Zhejiang Province was vectorized. All data (Table 1) were represented under a unified coordinate system at a spatial resolution of 30 m.
Table 1 A summary of main data used in this study
Type Format Source
Satellite images Landsat 8 OLI/TIRS C1 Level-1 United States Geological Survey (https://www.usgs.gov/)
Administrative boundary At 1:1000000 scale National Catalogue Service For Geographic Information (https://www.webmap.cn/)
Digital Elevation Model (DEM) ASTER GDEM V3 Grids at 30 m resolution EarthData (https://earthdata.nasa.gov/)
Land use Grids at 30 m resolution in 2020 Resource and Environment Science and Data Center (https://www.resdc.cn/)
Population density Grids at 100 m resolution in 2020 WorldPOP (https://www.worldpop.org/)
Road Lines in 2020 Open Street Map (https://www.openstreetmap.org/)
Red line of ecological protection in Zhejiang Province Image in 2018 The People’s Government of Zhejiang Province (http://www.zj.gov.cn/)

3 Methodology

The construction of ecological security patterns and ecological restoration zones is summarized in Figure 2. The specific procedures are: 1) to calculate the RSEI index of the study area, filter out areas with a value greater than 0.8, calculate the core area through a morphological spatial pattern analysis (MSPA), and select areas with an area greater than 10 km2 after adjustment of the ecological protection red line as ecological sources; 2) to construct the resistance surface from three aspects: natural endowment, land use types, and human development; 3) to extract ecological corridors, ecological pinch points, and ecological barrier points using the software Circuitscape and Linkage Mapper; and 4) to construct the ecological security patterns and ecological restoration zones.
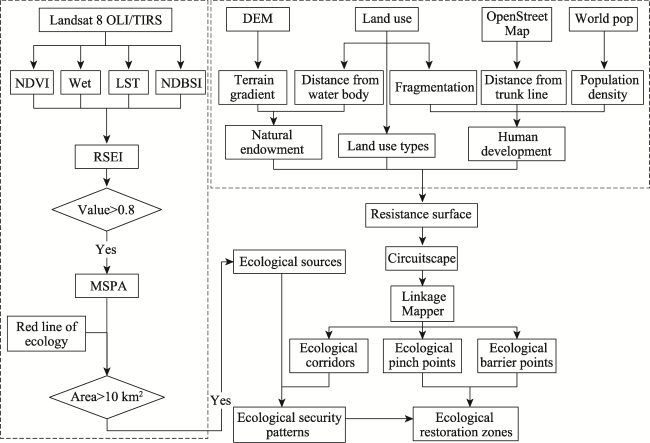
Figure 2 A framework for constructing ecological security patterns and ecological restoration zones in this study

3.1 Remote sensing ecological index

The remote sensing ecological index (RSEI), which integrates four ecological-spectral indices: normalized difference vegetation index (NDVI), wetness (Wet), land surface temperature (LST) and normalized difference built-up and bare soil index (NDBSI), can be rapidly and conveniently used to evaluate regional ecological quality without needing manual parameter setting (Xu, 2013a; 2013b), and it has been extensively applied to objectively evaluating an eco-environmental quality. Definitions of the four ecological-spectral indices with Landsat 8 data are described as follows:
NDVI:
$NDVI=\frac{(ρ_{5}-ρ_{4})}{( ρ_{5}+ρ_{4})}$
Wet:
Wet=$0.1511_{ρ_{2}}+0.1973_{ρ_{3}}+0.3283_{ρ_{4}}+0.3407_{ρ_{5}}-0.7117_{ρ_{6}}-0.4559_{ρ_{7}} $
The NDBSI is affected by both buildings and bare land, so it is synthesized from index- based built-up index (IBI) and soil index (SI).
$NDBSI=\frac{(SI+IBI)}{2}$
$SI=\frac{(ρ_{6}+ρ_{4})-(ρ_{5}+ρ_{2})}{(ρ_{6}+ρ_{4})+(ρ_{5}+ρ_{2})}$
IBI=$\frac{2ρ_{6}/(ρ_{6}+ρ_{5})-[ρ_{5}/(ρ_{5}+ρ_{4})+ρ_{3}/(ρ_{3}+ρ_{6})]}{2ρ_{6}/(ρ_{6}+ρ_{5})+[ρ_{5}/(ρ_{5}+ρ_{4})+ρ_{3}/(ρ_{3}+ρ_{6})]}$
Whereρ2-7 represents the 2nd to 7th bands’ reflectance of Landsat 8, respectively.
The retrieval of land surface temperature (LST) was implemented via Landsat 8 TIRS based on a radiative transfer equation-based method (Yu et al., 2014). The TIR radiance value Lλ includes three parts: the energy of radiance of ground object transmitted to the sensor via the atmosphere, the energy reflected by the atmosphere after the downwelling radiation to the ground surface, and upwelling path radiance L↑ of atmosphere.
$L_{λ}=[εB(T_{s})+(1-ε)L↓]τ+L↑$
where ε denotes the surface emissivity; TS is the true surface temperature (K); B(TS) is the thermal radiance of black body and τ stands for the atmospheric transmittance in a TIR band. The radiance B(TS) of black body with temperature T in the TIR band is calculated as follows:
$B(T_{s}=\frac{[L_{λ}-L↑-τ(1-ε)L↓]}{τε})$
LST can be acquired using the function of Planck formula:
LST=$\frac{K_{2}}{In[K_{1}/B(T_{s})+1]}$
For TIRS10, K1 = 774.89 W/(m2·µm·sr), K2 = 1321.08 K.
After the four indices were calculated, they were fused by conducting a principal component analysis (PCA) and the dimension reduction was implemented by taking the first principal component image. Before conducting a PCA analysis, according to inversion results and actual situation of the study area, the confidence interval for each index was taken within the standard of 2% from its normalized value. The normalized result of the first principal component was taken as RSEI, and then the RSEI was divided into five levels by an equal interval of 0.2.

3.2 Morphological spatial pattern analysis

According to the topological relation between elements and structure, a morphological spatial pattern analysis was used to divide grid data into seven types (zones) of ecological landscapes (core, islet, perforation, edge, bridge, loop and branch) based on mathematical morphological principles including corrosion, expansion, open operation and close operation, and their (the seven ecological landscapes) specific ecological significance was clearly presented (An et al., 2021). The core zone is a complete patch and can serve as a habitat. By referring to relevant references (Xu, 2013a; Xu,2013b) and practical regional status, the areas with RSEI > 0.8 were used as the foreground, and the core zones with an area of > 10 km2 were chosen as ecological sources.

3.3 Circuit theory

Circuitscape (McRae and Shah, 2009) simulates and predicts the movement, gene flow and genetic differentiation between animal and plant populations in heterogeneous landscapes based on the circuit theory. The resistance value corresponding to each grid is assigned according to an influence mode and resistance value of resistance sources, and the current value between nodes is iteratively calculated through the pairing, all-to-one and one-to-all patterns. A migration probability of species between ecological sources is positively correlated with a cumulative current value between nodes. In this study, the ecological sources were taken as the nodes, and the terrain gradient, distance from water body, distance from trunk line, population density, degree of landscape fragmentation and land use were chosen as the resistance sources from the aspects of natural endowment, human development and land use types. Next, the type, distance and area differences were planned as a whole. Hierarchical buffer zones were set for both road network and water body, so their resistance values might be set. The Shannon diversity index of land use data was calculated as a fragmentation degree via the software of Fragstats using a moving window method, and natural breaks were used to classify and assign resistance values. The resistance value was set with referring to relevant research (Liu et al., 2018; Dai et al., 2021). A weight of each resistance source was determined using an analytic hierarchy process method (with a consistency ratio of 0.068), and the resistance surface was constructed (Table 2).
Table 2 Resistance factors and resistance weight coefficients
Type Degree Resistance Weight Type Degree Resistance Weight
Natural
endowment
Terrain
gradient
<0.19 10 0.10
Fragmentation <0.17 10 0.26
0.19-0.46 20 0.17-0.48 20
0.46-0.78 30 0.48-0.71 30
0.78-1.06 40 0.71-0.91 40
≥1.06 50 ≥0.91 50
Distance from water body (m) <100 10 0.15 Land
use
types
Green land
(ha)
≥10 1 0.29
100-500 20 3-10 5
500-1000 30 <3 10
1000-1500 40 Water body (ha) <10 15
≥1500 50 10-100 35
Human
development
Distance
from trunk line (m)
≥2000 10 0.09 ≥100 50
1500-2000 20 Bare land
(ha)
30
1000-1500 30
500-1000 40
<500 50 Farmland
(ha)
40
Population density
(people/ha)
<17 10 0.11
17-79 20
79-238 30 Built-up land (ha) <10 60
238-567 40 10-100 75
≥567 50 ≥100 100
By calculating the cost-weighted distance between ecological sources with the nearest distance in pixel, Linkage Mapper (Carroll et al., 2012) was used to create the cost surface of weighted distance and to calculate the least-cost path (LCP). The ratio of cost-weighted distance (CWD) of least-cost path to its length (CWD: LCPL) was chosen to display the path cost. The greater the CWD: LCPL value, the greater the resistance, the worse it was for the species migration between the ecological sources. A global ecological corridor is the LCP between the ecological sources integrated from all ecological sources, and a potential ecological corridor is the LCP between every two specific ecological sources. The potential ecological corridor may pass through an intermediate ecological source. The global ecological corridor is taken as a key ecological corridor and all the potential ecological corridors are not included in the ecological security patterns.
The importance degree of one ecological source in an ecological security pattern can be described by the source centrality. Regarding the ecological sources as nodes in the current, Centrality Mapper (Carroll et al., 2012) was used to take the minimum CWD between any two ecological sources as the resistance, and to generate a cumulative current diagram through the iterative operation similar to the pairing mode in Circuitscape. A greater current value represents the better connectivity of this ecological source with a higher importance in the ecological security pattern. The calculation process relies upon the LCP and minimum CWD.
An identification of pinch points considers that a pinch point is a high-current-density area in an ecological corridor, an area that may be passed by species migration, and a key point that connects between the ecological sources, with a great significance to the connectivity of ecological corridors, thus the pinch point’s protection should be prioritized in the ecological protection. By invocting the pairing calculation mode of Circuitscape, Pinchpoint Mapper inputs the constructed resistance surface, sets the cut-off distance of CWD as 3000, and generates a pinch point diagram through an iterative calculation.
An identification of barrier points considers that Barrier Mapper (McRae et al., 2012) was used to set a circular moving search window with a designated radius D. Based on the least-cost distance LCD0, if the pixel value within the window is reduced by one unit, then the LCD0 value declines to LCD1 after the barrier points are removed, and the improvement score is IS = (LCD0-LCD1)/D. The greater the improvement score, the greater the recovery degree of regional connectivity after the barriers are removed. In this study, the search radius was set as 60 m to identify barrier points.

3.4 Method of constructing ecological restoration zones

Ecological sources and ecological corridors are areas that should be preferentially protected in a regional ecological security pattern. The regional and hierarchical protection of these areas should be implemented in order to improve the protective effect, reduce the protection cost and maximize the protection benefit. The ecological pinch point is the area with high current value in the ecological corridor, indicating that species are most likely to pass there. Ecological barrier points are areas in an ecological corridor that are not easy for species to pass through. Therefore, they can be expressed as areas in an urgent need of restoration. Current values of both ecological pinch points maintaining a connectivity of ecological corridors and ecological barrier points being urgently restored were superposed after the processes. According to the natural breaking point method, they were divided into prioritized restoration zones, prioritized protection zones and key conservation zones in a descending order of their importance degrees, and the ecological sources that were not included in those zones were specifically posed and set as general conservation zones.

4 Results

4.1 Ecological sources identification and resistance surface construction

The RSEI was divided into 1-5 levels (Figure 3). The 1st level zones occupied an area of 383.12 km2, accounting for 4.01% of the total study area. These zones were mainly distributed in the core area of built-up land, with low NDVI and Wet and high NDBSI and LST values, so the overall habitat quality was poor. The 2nd level zones covered an area of about 1403.84 km2 (14.71%), and the main land use types were built-up land and farmland with poor habitat quality. The 3rd level zones occupied an area of 2092.03 km2 (21.92%), mainly being wetland mudflats, river systems and some farmlands nearby the coast with medium habitat quality. The 4th level zones occupied an area of about 2583.74 km2 (27.08%), mainly including grass land and marginal areas of forest land with high habitat quality. The 5th level zones covered an area of 3080.03 km2 (32.28%), mainly distributed in mountainous areas; the main land use type was forest land; and the habitat quality was high. The quality of habitats at different levels showed a hierarchical structure. Overall, the zones affected by human activities to a minor extent enjoyed relatively high habitat quality, while the habitat quality was poor in areas where human activities were concentrated like cities and rural settlements as well as industrial and mining areas, in which the zones with RSEI of 0.8-1.0 were determined. By the morphological spatial pattern analysis (MSPA), a total of 42 ecological sources with a core area larger than 10 km2 were selected, covering a total area of 1325.11 km2. By referring to the ecological protection red line chart of Zhejiang Province, the zones outside the red line were taken as the ecological sources, and those included in it but not completely overlapped by the red line were considered as ecological protection of the province. Given the definition of the ecological protection red line, a total of 47 ecological sources were generated, with a total area of about 1540.15 km2, accounting for 16.14% of the total study area (Figure 4a).
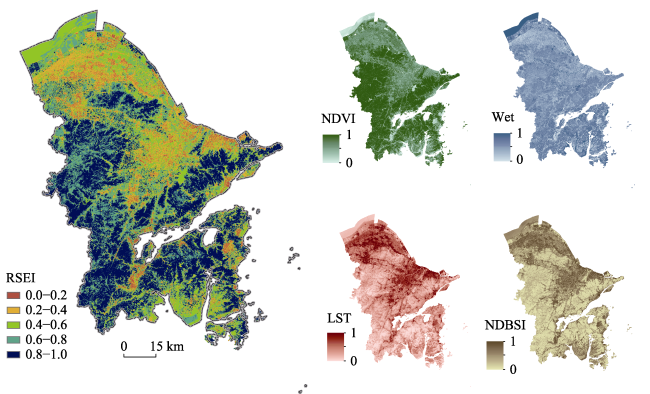
Figure 3 Remote sensing ecological index (RSEI) image, which was fused with four ecological-spectral indices: NDVI, Wet, LST and NDBSI. The RSEI was divided into five levels
The ecological sources distributed along mountain ranges, as a whole, presenting three ecological source accumulation zones from the northeast to the southwest. According to the ecological protection red line, the southern coast of Hangzhou Bay was added to form a “one patch and three belts” distribution pattern (Figure 4a). From the county-level administrative division, the ecological sources in Ninghai county, Yuyao city and Fenghua district had large areas, being 388.76 km2, 242.97 km2 and 233.63 km2, respectively. The ecological sources in Ninghai, Fenghua and Yinzhou district occupied large areas in the administrative region, with proportions of 22.72%, 18.65% and 18.52%, respectively, and the ecological sources in Zhenhai and Jiangbei districts occupied small proportions, being 12.45 km2 and 5.20 km2, respectively. The areas of Zhenhai and Jiangbei were relatively small, and they had a low and flat terrain, which was favorable for urban expansion, and thus the built-up land occupied a high proportion. There were a few high-level habitat patches in the two districts. The ratios of ecological source area in each district/county were ranked as Ninghai > Fenghua > Yinzhou > Haishu > Beilun > Yuyao > Xiangshan > Cixi > Zhenhai > Jiangbei.
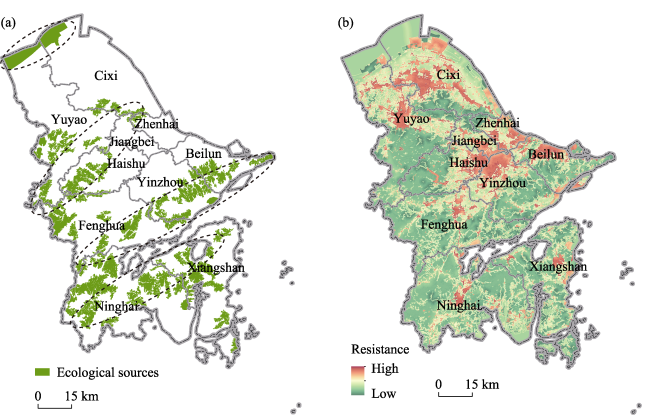
Figure 4 Ecological sources (a) and resistance surface (b)
The resistance surface constructed by combining natural and human factors intuitively reflected the disturbance suffered by the species during their migration between ecological sources (Figure 4b). Among various factors, the human development factor had a relatively high weight, and the contiguous artificial surfaces and fragmentary and sporadic artificial surfaces were the primary causes affecting the connectivity between ecological sources. In addition, influenced by geographical location and topographic factors, the special coastal landform in coastal areas aggravated the progress of small-scale “geographical isolation” of sea islands. The resistance values for the resistance surface in Ningbo city ranged from 8.39 to 60.30; the high-resistance values were mainly concentrated in urban built-up areas; and the overall resistance value was high in Zhenhai, Jiangbei, and Cixi. The high-resistance areas in the northern region presented a flaky distribution; the low mountains and hills were represented by Siming and Wulei mountains that became the low-value areas of northern resistance surface; the southern high-resistance areas centralized in intermontane valleys and coastal areas; and the values were gradually reduced outward from cities and settlements.

4.2 Ecological corridor distribution

Ecological corridors were of important channels connecting ecological sources and realizing a material migration, energy transfer and information exchange. The ecological corridors and ecological sources jointly constitute a regional basic ecological security pattern. The least-cost path (LCP) was extracted via Linkage Mapper. A total of 95 ecological corridors were generated among the 47 ecological sources in Ningbo, with a total length of about 708.67 km, among which there were 83 key ecological corridors and 12 potential ecological corridors. The total length of key ecological corridors was 471.19 km (an average of 5.68 km with a maximum of 38.25 km and a minimum of 0.08 km). The key ecological corridors were densely concentrated in the central-west: No.12 ecological source connected the most key ecological corridors (8), and the ecological source of No.42 did not connect with any other ecological sources owing to the administrative boundary and the island landform. The total length of potential ecological corridors was about 237.47 km (an average of 19.79 km with a maximum of 46.69 km and a minimum of 0.93 km). As shown in Figure 5a, the width of ecological corridor denoted the CWD: LCPL value: the narrower the corridor, the lower the CWD:LCPL ratio, namely, the smaller the resistance value. The average CWD:LCDL value of key ecological corridors was 19.74, but that of key ecological corridors between Nos. 4 and 5 ecological sources was the minimum, about 12.03. It could be clearly seen from Figure 5a that the CWD:LCPL values of ecological corridors among ecological sources in southern Yuyao, western Haishu and northwestern Fenghua were low; the more the ecological corridors were densely distributed, the more the favorable overall connectivity, and the lower the species migration cost among these areas.
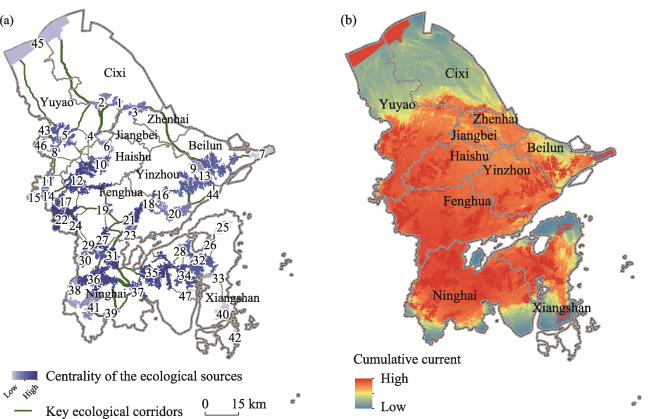
Figure 5 Ecological security patterns (a) and cumulative current (b)
The cumulative current values of 47 ecological sources ranged from 0 to 453.55. As shown in Figure 5a, the darker the ecological source, the greater the cumulative current value, and the stronger the centrality. The cumulative current value of No.27 ecological source was the maximum, which was the core area of ecological sources and contributed the most to the connectivity of regional ecological sources. The centrality of No.42 ecological source was 0, becoming an ecological isolated island. As shown in Figure 5b, the current value of No.42 ecological source was 0, and the current value of other islands was also 0 under the influences of administrative boundary and coastal landform.
The cumulative current diagram was analyzed by combining the centrality of ecological sources and resistance of ecological corridors in the study area under the one-to-one pattern. The key areas of ecological security patterns in Ningbo were located in the western and southern areas, including southern Yuyao, western Haishu, Fenghua, northern Ninghai and central-east Xiangshan. The areas with high-centrality ecological sources were located in mountainous areas, where the density of ecological corridors was gradually reduced outward from the central-west. The resistance values of ecological corridors passing through the flat areas were large; the distribution density of ecological corridors in coastal areas of Xiangshan was relatively low under the topographic influences of bay and island; but the resistance values of ecological corridors were relatively low; and the cumulative current value was large. The southern coastal zones became narrow and small in human settlements, with intense human development activities, weak connectivity, and low current value due to circuitous lines of bay, thus becoming an ecological marginal area with a small quantity of mudflats and salt marshes. As an important type of ecological land, wetlands are of great importance to the regional ecological security. Affected by the distribution of built-up land and farmland in the northern part, there were a few ecological sources with a great ecological resistance, a low density of ecological corridors, a weak connectivity between ecological sources and a low cumulative current value.

4.3 The construction of ecological restoration zones

It could be observed from Figure 6 that the prioritized restoration zones are concentrated at the junction between the narrow part inside ecological sources and ecological corridors and they played a decisive role in the integrity of ecological sources and connectivity of ecological corridors. Their ecological quality had a direct impact on the construction of the whole regional ecological network and regional ecological security. Given possible barriers, these zones should be restored as priorities as they were collectively distributed in Ninghai and Fenghua, with an area of 7.30 km2 and 5.59 km2, respectively. Ecological corridors dominated the prioritized protection zones, constituting a basic network framework of ecological security patterns, which could serve as a channel and bridge for the material migration and energy transfer between ecological sources. Some ecological corridors in Ningbo city should be protected as priorities due to their important location and large resistance, and the resistance of ecological corridors should be mitigated by taking ecological improvement measures while maintaining the current status. Key conservation zones were the core zones with high centrality of ecological sources and some areas with small resistance values along ecological corridors. These zones, which covered a large area, dominated the whole regional ecological quality and was a basis for the regional ecological security, so they should be given first priority among priorities, needing a continuous improvement of habitat quality. General conservation zones were mainly distributed in the edge zones of key conservation zones, with relatively low importance in the ecological network and a low resistance value, too. However, they usually located in the border areas between natural and artificial surfaces, with a fragile ecological environment; they could be easily degraded due to the stress imposed by human activities. Though there was not a high importance degree in the whole ecological network and was a weak effect on maintaining the regional ecological connectivity, they should still be protected and restored. Influenced by topographic factors in southern Xiangshan, both centrality and connectivity of ecological sources were low, so they were classified as general conservation zones.
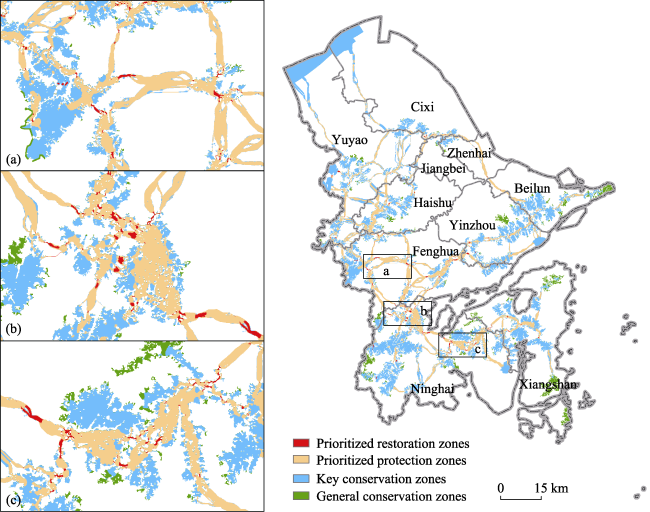
Figure 6 Ecological restoration zones (a, b, and c are partial enlarged views)
From the construction results of restoration zones in a county-level administrative division, the areas of subzones were ranked as key conservation zones > prioritized protection zones > general conservation zones > prioritized restoration zones (Table 3). The different ecological remediation zones in each district or county were obviously different in area, and the prioritized restoration zones in Ninghai and Fenghua were large, accounting for 70.58% of the total area of all prioritized restoration zones. Although human activities were intense in Jiangbei, Zhenhai and Beilun, the ecological sources and corridors were less distributed. They are located at the vacancy of an ecological network, and the area of prioritized restoration zones was small. The area of prioritized protection zones in Fenghua and Ninghai was large, and their ecological corridors were staggered in the two areas, where ecological protection should be enhanced to ensure a regional ecological security. Among the key conservation zones, Ninghai and Yuyao occupied large areas, being 261.91 km2 and 243.87 km2, respectively, and their administrative areas were large with a high proportion of ecological sources. The coastlines were circuitous in Xiangshan and Ninghai, together with a large amount of sea islands, so the general conservation zones occupied large areas (50.44 km2 and 37.01 km2, respectively). In addition, the connectivity of ecological sources was weak in Xiangshan.
Table 3 Areas of ecological restoration zones at various regional levels (km2)
Prioritized restoration zones Prioritized protection zones Key conservation zones General conservation zones
Haishu 0.54 45.68 71.45 6.74
Jiangbei 0.05 5.18 4.87 1.20
Beilun 0.14 22.46 68.22 20.68
Zhenhai 0.12 15.01 9.94 1.61
Yinzhou 1.15 42.98 106.67 12.23
Fenghua 5.59 156.79 136.06 9.22
Xiangshan 1.32 40.27 117.19 50.44
Ninghai 7.30 135.15 261.91 37.01
Yuyao 1.45 98.29 243.87 17.67
Cixi 0.60 22.63 115.77 2.94
Total 18.28 584.44 1135.94 159.73
By combining the area analysis of county-level administrative regions with ecological restoration zones, the ecological land area in Ningbo was about 1898.39 km2, accounting for 19.89% of the total study area. The ecological land areas in the county-level administrative regions were ranked as Ninghai > Yuyao > Fenghua > Xiangshan > Yinzhou > Cixi > Haishu > Beilun > Zhenhai > Jiangbei, and the total ecological land area in Ninghai, Yuyao and Fenghua accounted for about 58.49% of total ecological land area in the study area, so they were of great importance to the regional ecological security. The ecological land areas in Ninghai, Fenghua, Yuyao and Yinzhou accounted for large proportions (25.80%, 24.56%, 23.49% and 20.43%, respectively) of their respective administrative regions, while those in Jiangbei and Cixi accounted for small proportions (5.41% and 10.27%, respectively) of their corresponding administrative regions. The areas of ecological restoration zones in Haishu, Beilun, Yinzhou, Ninghai, Yuyao and Cixi were ranked as key conservation zones > prioritized protection zones > general conservation zones > prioritized restoration zones, being identical with the total area relations among the four ecological restoration zones. Efforts should be made to strengthen the conservation of ecological sources as well as the ecological adjustment and optimization of edge zones of ecological sources. The areas of the four ecological restoration zones in Jiangbei, Zhenhai and Fenghua were ranked as prioritized protection zones > key conservation zones >general conservation zones > prioritized restoration zones, among which the area of prioritized protection zones was relatively large, and the emphasis should be laid on the removal of ecological barrier points based on the protection of ecological corridors. The areas of the four ecological restoration zones in Xiangshan were ranked as key conservation zones > general conservation zones > prioritized protection zones > prioritized restoration zones, and the protection of edge zones of ecological sources should be reinforced.

5 Discussion and conclusions

5.1 Discussion

An ecological security pattern is a regional ecological line of defense. The ecological restoration zones constructed on the basis of ecological security patterns are helpful to the precise optimization of the ecological security patterns. Compared with the existing forbidden development zones (Li et al., 2021), it is more conducive to maintain connectivity between different areas, and the variation of ecological importance within the protected area is also enhanced.
Ecological security includes human survival, human development and environmental resources (Liu and Chang, 2015). The ecological protection red line can reflect the regional ecosystem services (Liu et al., 2015). The habitat suitability, ecological importance and necessary ecological service value denoted by RSEI and the ecological protection red line can meet the needs of human survival, human development and environmental resources. A reasonable selection of conservation and restoration zones is a key to maximize impacts of ecological engineering. Therefore, an efficient ecological regulation can be realized by using more objective ecological environmental evaluation indices, combining with the red line of ecological protection, selecting areas with good habitat quality as ecological sources and constructing an ecological security pattern to perform hierarchical protection and restoration.
In this study, Ningbo city was taken as the study area. The construction of resistance surface was restricted by the administrative boundaries in the study area, while the surface status outside the boundaries was not considered. In reality, ecological processes are not influenced by the administrative boundaries. Due to considering the special coastal landform in the study area, sea islands become isolated ecological islands, and the “geographical isolation” may still exist within a small scale island due to the obstruction from seawater. Hence, it was reasonable that there were no ecological corridors in the ecological sources between islands and mainland in this study. During the extraction of ecological corridors, ecological pinch points and barrier points, the cost-weighted distance method and circuit theory were utilized, and the simulated possible species migration paths between ecological sources were regarded as the ecological corridors. Actually, the species that are most possible to migrate between dispersed ecological sources are animals with flying ability like birds (Liu et al., 2021), and other species may migrate in areas with densely distributed ecological sources. Therefore, the resistance values were set in a simulation process, not focusing on one single species, but instead, on factors that influence migration. The resistance values were used to characterize the difficulty of species migration. There is no one unified standard in the current literatures. Therefore, in this study, the resistance surface was constructed by combining a type and distance with area differences from multiple aspects like natural endowments and influences of human activities, which were more persuasive.
The analysis results regarding the ecological restoration zoning under the background of an ecological security pattern in a city area with a relatively perfect internal structure can only serve as the ecological defense line and provide a reference for maintaining the current regional ecological status in terms of landscape patterns. However, biological processes in different restoration zones should be restored in order to realize the ecological restoration. Of course, influenced by artificial boundaries and a study scale, a transregional study will better facilitate the construction of ecological security pattern (Dong et al., 2021), which remains to be solved in the future. Besides, the field survey and verification of ecological pinch points and barrier points in the future study should be stressed in an effort to better serve the accurate restoration and protection of ecologically vulnerable areas.

5.2 Conclusions

The regional habitat quality was evaluated through a remote sensing ecological method. A morphological analysis method was used to identify ecological sources by considering the ecological protection red line. Further, an ecological resistance surface was constructed under a full consideration of natural endowment and human development from differences of multiple aspects including type, area and distance. The ecological corridors, ecological pinch points and barrier points were extracted using the circuit theory; an ecological security network was constructed; and ecological restoration zones were identified and mapped. In this study, several conclusions were derived from the analysis results as follows:
(1) A total of 47 ecological sources were identified in Ningbo city, with a total area of about 1540.15 km2, which accounted for 16.14% of the total study area. A total of 83 key ecological corridors were extracted, with a total length of about 471.19 km, and thus an ecological network pattern of Ningbo was formed. The total ecological land area was about 1898.39 km2 (19.89% of total study area).
(2) The core areas of ecological network collectively distributed in the western and southern regions, including southern Yuyao, western Haishu, Fenghua, northern Ninghai and central-west Xiangshan. The ecological sources presented a “one patch and three belts” distribution pattern, and the low-resistance ecological corridors were concentrated in southern Yuyao, western Haishu and central-west Fenghua.
(3) The prioritized restoration zones in the ecological restoration zones were concentrated in areas between the narrow part inside ecological sources and ecological corridors. The ecological corridors played a dominant role in the prioritized protection zones; the key conservation zones were mainly the core zones of ecological sources with high centrality and some zones with small resistance values on ecological corridors; and the general conservation zones were mainly distributed in the edge areas of key conservation zones.
(4) The ecological land use area was large in Ninghai, Yuyao and Fenghua. The prioritized restoration zones and prioritized protection zones in Ninghai County and Fenghua District occupied large areas, and thus the emphasis should be laid on ecological restoration and protection in order to improve the ecological environment, keep the connectivity of ecological network and maintain the regional ecological security.
[1]
An Y, Liu S, Sun Y et al., 2021. Construction and optimization of an ecological network based on morphological spatial pattern analysis and circuit theory. Landscape Ecology, 36(7): 2059-2076.

DOI

[2]
Carpenter S R, Mooney H A, Agard J et al., 2009. Science for managing ecosystem services: Beyond the Millennium Ecosystem Assessment. Proceedings of the National Academy of Sciences, 106(5): 1305-1312.

DOI

[3]
Carroll C, McRAE B H, Brookes A, 2012. Use of linkage mapping and centrality analysis across habitat gradients to conserve connectivity of gray wolf populations in western North America. Conservation Biology, 26(1): 78-87.

DOI PMID

[4]
Chen X, Zhou C H, 2005. Review of the studies on ecological security. Progress in Geography, 24(6): 8-20. (in Chinese)

[5]
Dai L, Liu Y, Luo X, 2021. Integrating the MCR and DOI models to construct an ecological security network for the urban agglomeration around Poyang Lake, China. Science of The Total Environment, 754: 141868.

DOI

[6]
Dong J Q, Peng J, Xu Z H et al., 2021. Integrating regional and interregional approaches to identify ecological security patterns. Landscape Ecology: 1-14.

[7]
Fang Y, Wang J, Huang L Y et al., 2020. Determining and identifying key areas of ecosystem preservation and restoration for territorial spatial planning based on ecological security patterns: A case study of Yantai city. Journal of Natural Resources, 35(1): 190-203. (in Chinese)

DOI

[8]
Fu Y J, Shi X Y, He J et al., 2020. Identification and optimization strategy of county ecological security pattern: A case study in the Loess Plateau, China. Ecological Indicators, 112: 106030.

DOI

[9]
Huang M Y, Yue W Z, Feng S R et al., 2019. Analysis of spatial heterogeneity of ecological security based on MCR model and ecological pattern optimization in the Yuexi county of the Dabie Mountain Area. Journal of Natural Resources, 34(4): 771-784. (in Chinese)

DOI

[10]
Jiang H, Peng J, Dong J Q et al., 2021. Linking ecological background and demand to identify ecological security patterns across the Guangdong-Hong Kong-Macao Greater Bay Area in China. Landscape Ecology, 1-16.

[11]
Kavanagh P, Newlands N, Christensen V et al., 2004. Automated parameter optimization for Ecopath ecosystem models. Ecological Modelling, 172(2-4): 141-149.

DOI

[12]
Li G M, He B B, Li L et al., 2021. Ecological functions and human activity interference evaluation in ecological protection redline for urban environment. Photogrammetric Engineering & Remote Sensing, 87(6): 413-420.

[13]
Li S C, Xiao W, Zhao Y L et al., 2020a. Incorporating ecological risk index in the multi-process MCRE model to optimize the ecological security pattern in a semi-arid area with intensive coal mining: A case study in northern China. Journal of Cleaner Production, 247: 119143.

DOI

[14]
Li Z T, Li M, Xia B C, 2020b. Spatio-temporal dynamics of ecological security pattern of the Pearl River Delta urban agglomeration based on LUCC simulation. Ecological Indicators, 114: 106319.

DOI

[15]
Liao W H, Jiang W G, 2020. Evaluation of the spatiotemporal variations in the eco-environmental quality in China based on the remote sensing ecological index. Remote Sensing, 12(15): 2462.

DOI

[16]
Liu D, Chang Q, 2015. Ecological security research progress in China. Acta Ecologica Sinica, 35(5): 111-121.

DOI

[17]
Liu D, Lin N F, Zou C X et al., 2015. Development of foreign ecological protected areas and linkages to ecological protection redline delineation and management in China. Biodiversity Science, 23(6): 708.

DOI

[18]
Liu J, Yin H W, Kong F H et al., 2018. Structure optimization of circuit theory-based green infrastructure in Nanjing, China. Acta Ecologica Sinica, 38(12): 4363-4372. (in Chinese)

[19]
Liu Z F, He C Y, Wu J G, 2016. The relationship between habitat loss and fragmentation during urbanization: An empirical evaluation from 16 world cities. PLoS One, 11(4): e0154613.

DOI

[20]
Liu Z H, Huang Q D, Tang G P, 2021. Identification of urban flight corridors for migratory birds in the coastal regions of Shenzhen city based on three-dimensional landscapes. Landscape Ecology, 36(7): 2043-2057.

DOI

[21]
Ma K M, Fu B J, Li X Y et al., 2004. The regional pattern for ecological security (RPES): The concept and theoretical basis. Acta Ecologica Sinica, 24(4): 761-768. (in Chinese)

[22]
Ma L B, Bo J, Li X Y et al., 2019. Identifying key landscape pattern indices influencing the ecological security of inland river basin: The middle and lower reaches of Shule River Basin as an example. Science of the Total Environment, 674: 424-438.

DOI

[23]
McRae B H, Hall S A, Beier P et al., 2012. Where to restore ecological connectivity? Detecting barriers and quantifying restoration benefits. PloS One, 7(12): e52604.

DOI

[24]
McRae B H, Shah V B, 2009. Circuitscape User’s Guide. Santa Barbara: The University of California.

[25]
Pan J H, Liu X, 2015. Assessment of landscape ecological security and optimization of landscape pattern based on spatial principal component analysis and resistance model in arid inland area: A case study of Ganzhou District, Zhangye City, Northwest China. Chinese Journal of Applied Ecology, 26(10): 3126-3136. (in Chinese)

[26]
Peng J, Zhao S Q, Dong J Q et al., 2019. Applying ant colony algorithm to identify ecological security patterns in megacities. Environmental Modelling & Software, 117: 214-222.

[27]
Peng W F, Zhou J M, 2019. Development of land resources in transitional zones based on ecological security pattern: A case study in China. Natural Resources Research, 28(1): 43-60.

DOI

[28]
Song L L, Qin M Z, 2016. Identification of ecological corridors and its importance by integrating circuit theory. Chinese Journal of Applied Ecology, 27(10): 3344-3352. (in Chinese)

DOI PMID

[29]
Tian P, Li J L, Cao L D et al., 2021. Assessing matching characteristics and spatial differences between supply and demand of ecosystem services: A case study in Hangzhou, China. Land, 10(6): 582.

DOI

[30]
Wang C X, Yu C Y, Chen T Q et al., 2020. Can the establishment of ecological security patterns improve ecological protection? An example of Nanchang, China. Science of The Total Environment, 740: 140051.

DOI

[31]
Xiong Y, Xu W H, Lu N et al., 2021. Assessment of spatial-temporal changes of ecological environment quality based on RSEI and GEE: A case study in Erhai Lake Basin, Yunnan province, China. Ecological Indicators, 125: 107518.

DOI

[32]
Xu H Q, 2013a. A remote sensing index for assessment of regional ecological changes. China Environmental Science, 33(5): 889-897. (in Chinese)

[33]
Xu H Q, 2013b. A remote sensing urban ecological index and its application. Acta Ecologica Sinica, 33(24): 7853-7862. (in Chinese)

[34]
Xu J Y, Fan F F, Liu Y X et al., 2019. Construction of ecological security patterns in nature reserves based on ecosystem services and circuit theory: A case study in Wenchuan, China. International Journal of Environmental Research and Public Health, 16(17): 3220.

DOI

[35]
Yang T R, Kuang W H, Liu W D et al., 2017. Optimizing the layout of eco-spatial structure in Guanzhong urban agglomeration based on the ecological security pattern. Geographical Research, 36(3): 441-452. (in Chinese)

[36]
Yin J B, Li H, Wang D Y et al., 2020. Optimization of rural settlement distributions based on the ecological security pattern: A case study of Da’an city in Jilin province of China. Chinese Geographical Science, 30(5): 824-838.

DOI

[37]
Yu F, Li X B, Wang H et al., 2006. Land use change and eco-security assessment of Huangfuchuan watershed. Acta Geographica Sinica, 61(6): 645-653. (in Chinese)

[38]
Yu K J, 1999. Landscape ecological security patterns in biological conservation. Acta Ecologica Sinica, 19(1): 8-15. (in Chinese)

[39]
Yu X L, Guo X L, Wu Z C, 2014. Land surface temperature retrieval from Landsat 8 TIRS: Comparison between radiative transfer equation-based method, split window algorithm and single channel method. Remote Sensing, 6(10): 9829-9852.

DOI

[40]
Zhang L Q, Peng J, Liu Y X et al., 2017. Coupling ecosystem services supply and human ecological demand to identify landscape ecological security pattern: A case study in Beijing-Tianjin-Hebei region, China. Urban Ecosystems, 20(3): 701-714.

DOI

Outlines

/