Original article

Vegetation-related dry deposition of global PM2.5 from satellite observations

  • FENG Huihui , 1, 2 ,
  • DING Ying 1 ,
  • ZOU Bin , 1, 2, * ,
  • COHEN Jason Blake 3 ,
  • YE Shuchao 1 ,
  • YANG Zhuolin 1 ,
  • QIN Kai 4 ,
  • LIU Lei 5 ,
  • GU Xiaodong 6, 7
Expand
  • 1. School of Geosciences and Info-Physics, Central South University, Changsha 410083, China
  • 2. Key Laboratory of Metallogenic Prediction of Nonferrous Metals and Geological Environment Monitoring of Chinese Ministry of Education, Changsha 410083, China
  • 3. School of Atmospheric Sciences, Sun Yat-sen University, Guangzhou 510275, China
  • 4. School of Environment Science and Spatial Informatics, China University of Mining and Technology, Xuzhou 221116, Jiangsu, China
  • 5. College of Earth and Environmental Sciences, Lanzhou University, Lanzhou 730000, China
  • 6. Guangzhou Center for Rule of Green Development Law Studies, Guangdong University of Foreign Studies, Guangzhou 510420, China
  • 7. Southern Marine Science and Engineering Guangdong Laboratory (Guangzhou), Guangzhou 511458, China
*Zou Bin (1981-), Professor, specialized in remote sensing of resources and environment. E-mail:

Feng Huihui (1986-), specialized in remote sensing of resources and environment. E-mail:

Received date: 2021-08-22

  Accepted date: 2021-11-18

  Online published: 2022-06-25

Supported by

National Natural Science Foundation of China(No.42071378)

Natural Science Foundation of Hunan Province(No.2020JJ3045)

Foundation of Natural Science of Guangdong(No.2019BT02H594)

Abstract

Vegetation plays an important role in the dry deposition of particles with significant spatial variability, but the magnitude remains unclear at the global scale. With the aid of satellite products, this study estimated the vegetation-related dry deposition of fine particulate matter (PM2.5). Methodologically, dry deposition was first calculated using an empirical algorithm. Then, deposition on the leaf surface was estimated to evaluate the influence of vegetation. Our results showed that the mean deposition velocity (Vd) of global PM2.5 was 0.91×10‒3 µg·m‒2·s‒1, with high velocities observed in sparsely vegetated regions because of the high friction velocity. Under the combined effect of the PM2.5 mass concentration and deposition velocity, the global mean dry deposition reached 0.47 g·m‒2·yr‒1. Global vegetation absorbed 0.26 g·m‒2·yr‒1 from PM2.5 pollution sources, contributing 54.98% of the total dry deposition. Spatially, vegetation-related dry deposition was high in the Amazon, Central Africa and East China due to dense vegetation coverage or serious pollution. Temporally, the increasing trends were mainly in Central Africa and India because of worsening air pollution. The results of this study helped to clarify the impact of vegetation on air pollution, which supported related land management and planning for air quality improvement.

Cite this article

FENG Huihui , DING Ying , ZOU Bin , COHEN Jason Blake , YE Shuchao , YANG Zhuolin , QIN Kai , LIU Lei , GU Xiaodong . Vegetation-related dry deposition of global PM2.5 from satellite observations[J]. Journal of Geographical Sciences, 2022 , 32(4) : 589 -604 . DOI: 10.1007/s11442-022-1962-0

1 Introduction

Due to the combined effects of global climate change and anthropogenic activities, the world has experienced significant land use and cover change (LUCC) in recent decades (De Jong et al., 2011; Zhu et al., 2016; Song et al., 2018; Chen et al., 2019). Significant surface change has subsequently affected the global eco-environment by altering land-atmosphere interactions (Sterling et al., 2013; Feng and Zou, 2019a), global climate change (Pielke Sr et al., 2011; Findell et al., 2017), hydrological processes (Bagley et al., 2014) and environmental quality (Heald and Spracklen, 2015). Investigation of the response of the environment to LUCC has become one of the most important topics in recent international research projects on global change (e.g., the International Geosphere-Biosphere Programme (IGBP), International Human Dimensions Programme on Global Environmental Change (IHDP), Global Land Project (GLP) and United Nations’ Sustainable Development Goals (SDGs)) (Verburg and Veldkamp, 2005; Howells et al., 2013; Verburg et al., 2015; Fu et al., 2019).
Among all environmental problems, air pollution is one of the most serious issues in the modern world, particularly fine particle matter (PM2.5) pollution (Fenger, 2009; Zivin and Neidell, 2018; Feng et al., 2019; Feng and Zou, 2019b; Hammer et al., 2020). It is crucial to clarify the evolution of air pollution and to identify the corresponding driving factors for environmental management. According to the law of conservation of mass, the evolution of air pollution depends on the processes of emission, deposition, transport, and dispersion (Sun et al., 2014; Feng and Zou, 2020; Wang et al., 2021). Numerous studies have been performed to estimate the emission, transport and dispersion of PM2.5, while research on deposition remains rare because of the difficulty in observing PM2.5 (particularly on a large scale) (Harrison et al., 1997; Vecchi et al., 2004; Huang et al., 2014). The estimation of deposition would greatly reduce uncertainty in research on air pollution. Therefore, a full investigation of dry deposition is required to capture air pollution variation and to support relevant eco-environmental management (Du et al., 2019; Monticelli et al., 2020).
Deposition can be further divided into wet and dry processes with or without the influence of precipitation. Wet deposition is relatively easy to measure and interpolate over a large region, whereas dry deposition is difficult and expensive to estimate because of high heterogeneity in space (Du et al., 2019; Saylor et al., 2019). Traditional monitoring mainly relies on in situ observations or model simulations. The former is useful for monitoring deposition at the local scale (Fu et al., 2020; Yan et al., 2020). However, it lacks spatial representation and is difficult to apply on a large scale. Models can estimate deposition by simulating the physical mechanism of dry deposition, but unavoidable uncertainties origin-ating from the initial conditions, model errors and prediction scenarios remain (Saylor et al., 2019). Recently, satellite observations have been widely used in studies of atmospheric environments due to their spatially consistent view, which provides a potential way to estimate spatial dry deposition on a large scale (Feldman et al., 2007; Mishchenko et al., 2007; Fang et al., 2016; Feng and Zou, 2020).
Several factors account for dry deposition, including particle properties, meteorological conditions and underlying surface characteristics (Wesely and Hicks, 2000). As one of the most important surface characteristics, land use and cover (LUC) plays a crucial role in dry deposition, which has prompted increasing attention from researchers (Matsuda et al., 2010; Dzierzanowski et al., 2011; Shen et al., 2013; García De Jalon et al., 2019). Most previous studies have confirmed that vegetation can enhance dry deposition (Janhäll, 2015). Physically, vegetation removes air pollution primarily through uptake via leaf stomata (Smith, 2012). Furthermore, vegetation can decrease wind speed because of increased surface roughness, which subsequently helps to enhance the interception of airborne particles (Nowak et al., 2006). In addition, vegetation (e.g., trees) usually has a large collecting surface area, which helps to increase turbulence and to promote the opportunity for particles to be deposited on leaves (Mcdonald et al., 2007). Although the studies discussed above had been performed to investigate the influence of vegetation, most studies have focused on local or regional scales in which the climate and terrain are relatively homogeneous. As a result, the spatial pattern of dry deposition mainly depended on the various absorption capacities of the different vegetation types. However, at larger scales (particularly globally), both climate and surface are highly heterogeneous. Under this condition, the influence of vegetation is strongly affected by the interactions of atmospheric and surface conditions. For example, the study by Gong et al. (2020) revealed that variations in meteorological parameters influence the relationship between ozone deposition and vegetation. Thus, the influence of vegetation on air pollution deposition is much more complex at the global scale, which needs a full investigation to capture the evolution of pollution and to support environmental management (Saylor et al., 2019).
This study aims to estimate the global dry deposition of PM2.5 and to evaluate the impact of vegetation change with the aid of satellite products. Pixelwise dry deposition was first calculated by using an empirical algorithm proposed by Zhang and He (2014). Then, the deposition on the leaf surface was estimated to evaluate the impact of vegetation change. This study helps to capture the evolution of air pollution and enhances our understanding of the mechanisms of dry deposition, which could further support effective land management for improving air quality.

2 Materials and methods

Several satellite products, including datasets on land use, vegetation, air pollution and climate, were collected for this study. The first two datasets were used to capture the trend in global vegetation change, while the third and fourth were adopted to evaluate the response of deposition to global vegetation change. Dataset descriptions are as follows.

2.1 Materials

(1) Global LUCC dataset. The land use and cover change data used in this study were the Terra and Aqua combined Moderate Resolution Imaging Spectroradiometer (MODIS) Land Cover Climate Modeling Grid (CMG) (MCD12C1 Version 6, https://ladsweb.modaps.eosdi s.nasa.gov/). This dataset was produced through supervised classification of MODIS reflectance data (Friedl et al., 2002; Friedl et al., 2010; Sulla-Menashe et al., 2019) and has been widely used in climate change research at the global and regional scales (Feng and Liu, 2014, 2015; Negrón-Juárez et al., 2015). It contains five classifications, including the International Geosphere Biosphere Programme (IGBP), the University of Maryland (UMD), the MODIS-derived leaf area index and fraction of photosynthetically active radiation (LAI/ fPAR) scheme, the MODIS-derived net primary production (NPP) scheme, and the plant functional type (PFT) scheme. The IGBP classification was selected in this study to match the study by Zhang and He (2014) for estimating deposition.
(2) Global vegetation dataset. Vegetation indicators (e.g., the normalized difference vegetation index, NDVI) have been widely used to capture global vegetation change in previous studies (Stow et al., 2007; De Jong et al., 2011; Feng and Zou, 2019a). However, the NDVI can only distinguish vegetated or barren land, while it is difficult to evaluate the crucial parameters for vegetation (e.g., the fraction cover and biomass). This study adopted the fractional vegetation coverage (FVC) and leaf area index (LAI) of the Global Land Surface Satellite (GLASS) to reflect global vegetation change. The former is defined as the area ratio of vegetation, while the latter is the total one-sided leaf area over a unit land (Campos-Taberner et al., 2015). The datasets are available from the National Earth System Science Data Center (http://www.geodata.cn/data/publisher.html, China). The datasets were prepared at a spatial resolution of 0.05° and a temporal resolution of eight days. The LAI dataset was generated from MODIS surface reflectance time series data based on regression neural networks with a high accuracy (R2 = 0.81, RMSE = 0.78) (Xiao et al., 2016), while the FVC was generated from MODIS data based on multivariate adaptive regression splines (R2 = 0.84, RMSE = 0.15) (Yang et al., 2016).
(3) Global PM2.5 data. Global surface PM2.5 data were available from the Atmospheric Composition Analysis Group (http://fizz.phys.dal.ca/~atmos/martin/?page_id=140#V4.NA. 01) at a spatial resolution of 0.05 degrees. The global version of V4.GL.03 from 1998 to 2019 was used in this study. It estimated the global annual surface PM2.5 mass concentration through its geophysical relationships with the aerosol optical depth (AOD) datasets from MODIS C6.1, the Multiangle Imaging SpectroRadiometer (MISR) v23, the Multiangle Implementation of Atmospheric Correction (MAIAC) C6, and the Sea-Viewing Wide Field-of-View Sensor (SeaWiFS) satellite products and AOD simulated by the Goddard Earth Observing System-Chemistry (GEOS-Chem) model. The datasets were subsequently calibrated to global ground- based observations from the World Health Organization using geographically weighted regression (GWR) with an accuracy of R2 = 0.81 and slope = 0.90 at the global scale (Hammer et al., 2020).
(4) Global climate datasets. Monthly mean climate data during 2001-2017, including wind speed and friction velocity, were downloaded from the Copernicus Climate Change Service (C3S) Climate Data Store (CDS, https://cds.climate.copernicus.eu/cdsapp#!/dataset/ reanalysis-era5-land-monthly means?tab=overview). The horizontal 10 m wind speed with a resolution of 0.1° was calculated by combining the northward and eastward components of the wind, which were obtained from the monthly average datasets of the fifth generation European Centre for Medium-Range Weather Forecasts (ECMWF) reanalysis (ERA5). Friction velocity at 0.25° resolution was from the ERA5 monthly average data at single levels. Based on the land component of the ERA5 climate reanalysis, the ERA5-Land reanalysis dataset was produced to provide the evolution of land variables. Previous studies have shown that the ERA5 dataset offers better estimates of climate variables than other state-of-the-art global reanalysis data (Olauson, 2018; Ramon et al., 2019).
Significant changes in aerosol air pollution and corresponding climatic and environmental responses have been reported for the last decade (Mehta et al., 2016; Weber et al., 2016; Feng and Zou, 2019b). Therefore, we selected the study period from 2001 to 2017. Furthermore, all datasets were resampled to a grid resolution of 0.25° by using the nearest neighbor method and analyzed at an annual scale to match the same spatial and temporal scales.

2.2 Methods

To evaluate the global dry deposition of PM2.5 and the vegetation influence, pixelwise deposition was first calculated over land by using an empirical algorithm proposed by Zhang and He (Zhang and He, 2014). Then, the deposition on the leaf surface was estimated to evaluate the impact of vegetation change. The methods that were used include the following.

2.2.1 Estimation of PM2.5 dry deposition

Dry deposition (D) was estimated by using the resistance-in-series parameterization approach. The general formula can be written as the product of PM2.5 concentration (C) and deposition velocity (Vd) (Hicks et al., 1985; Pederson et al., 1995; Wesely, 1989):
D=C·Vd
where Vd is the key parameter for the dry deposition estimation. The universal formulation of Vd refers to a resistance model that accounts for the effects of the aerodynamic (Ra), quasi-laminar boundary layer (Rb) and canopy (Rc) resistances (Pederson et al., 1995):
$V_{d}=\frac{1}{R_{a}+R_{b}+R_{c}}$
Specifically, Ra is usually calculated by using the Monin-Obukhov theory and Rb often follows a standard formulation from micrometeorology and does not vary significantly (Wong et al., 2019). The universal formulation of Eq. (2) excludes the sedimentation component of particles (Gallagher et al., 2002). Zhang and He (2014) took gravity sedimentation into consideration and proposed an improved algorithm of Vd estimation, which was adopted in our study. The results of sensitivity tests revealed that the theoretical uncertainty of Vd is approximately 20% of this algorithm, which is acceptable when compared with other studies.
For example, Wesely and Hicks (2000) compared the performances of various models and concluded that the uncertainties of deposition velocity were at least as large as 30%. Cheng et al. (2013) estimated NO2 dry deposition in eastern China using satellite data with an average relative error of 41.30%. Mathematically, the Vd of Zhang and He’s algorithm is written as follows:
$V_{d}=V_{g}+\frac{1}{R_{a}+R_{s}}$
where Vg is the gravitational settling velocity. Although Vg depends strongly on particle size, it only changes slightly with particle density and ambient temperature. For PM2.5, a constant value of 3.7×10⁻⁵ m·s-1 was adopted in this study based on the study by Zhang and He (2014). Rs is the surface resistance that combines parameters Rb and Rc in Eq. (2) (Rs = Rb + Rc) (Gallagher et al., 2002).
Aerodynamic resistance Ra was calculated by using the formula developed by García De Jalon et al. (2019), and Hicks et al. (1985):
$R_{a}=\frac{u_{z}}{u^{2}_{*}}$
where uz and u* are the wind speed at height z and the friction velocity, respectively. In this study, 10 m was chosen as the reference height z to enhance the comparability with previous studies.
Rs was calculated as the inverse of the surface deposition velocity (Vds), which can be parameterized as a simple linear function of the friction velocity over different land cover types (Zhang and He, 2014):
$R_{s}=\frac{1}{V_{ds}}=\frac{1}{a_{1}·u_{*}}$
where a1 is an empirical constant that depends on land cover types and can be referenced in the study by Zhang and He (2014).

2.2.2 Impact of vegetation change on PM2.5 dry deposition

To evaluate the impact of vegetation change, the amount of PM2.5 dry deposition (Dveg) on vegetation was calculated (García De Jalon et al., 2019; Petroff et al., 2008):
$D_{veg}=D·LAI·fr$
where LAI and fr are the leaf area index and vegetation fraction, respectively.

3 Results and discussion

3.1 Overall change of global vegetation

Due to the combined impacts of natural and anthropogenic influences, the world has experienced significant land use and cover change in recent decades with an overall greening trend (Pielke et al., 2011; Zhu et al., 2016; Song et al., 2018; Chen et al., 2019; Feng and Zou, 2019a). Figure 1 shows similar temporal trends in both global LAI and FVC from 2001 to 2017 over land. Both leaf area and vegetation coverage decreased from 2001 to 2008 and then increased in recent decades, resulting in total increases of 1.21% and 1.37%, respectively. Several researchers have further investigated the driving factors for the greening trends and have indicated that CO2 fertilization effects explain most greening trends in the tropics, whereas climate change is the major factor at high latitudes and on the Tibetan Plateau. On the other hand, anthropogenic land use changes contributed most of the regional greening observed in southeastern China and the eastern United States (Zhu et al., 2016).
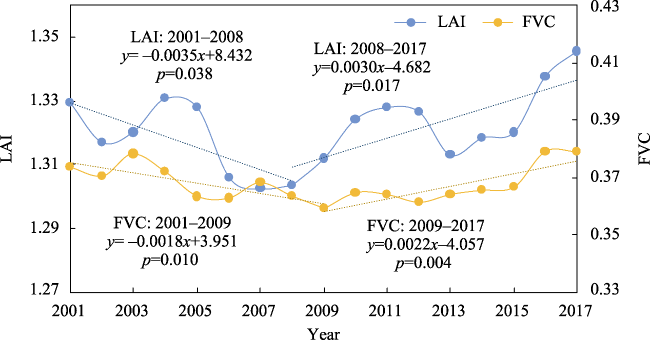
Figure 1 Temporal trends of global LAI and FVC from 2001 to 2017
In addition to the temporal trends, global vegetation also showed significant spatial variability (Figure 2). Specifically, the spatial patterns of global FVC and LAI were ch+aracterized by dense vegetation in the tropics and sparse vegetation in typical desert and cold regions (Figures 2a and 2d). Temporally, there were several hotspots of vegetation change (particularly in China and India) (Figures 2b and 2e), leading to greening through land use management (Chen et al., 2019). We then used theg coefficient of variation (CV), defined as the standard deviation divided by the mean, to account for regions that had a significant change (Figures 2c and 2f). Generally, CVs were relatively low over land, with high CV values only occurring in very small regions. However, slight vegetation changes, particularly in the Amazon, Central Africa and Southeast Asia, have exerted profound influences on regional or global eco-environments and have become important topics in global change research (Huber et al., 2011; Bagley et al., 2014; Pausata et al., 2016; Cohen et al., 2017; Aragão et al., 2018).
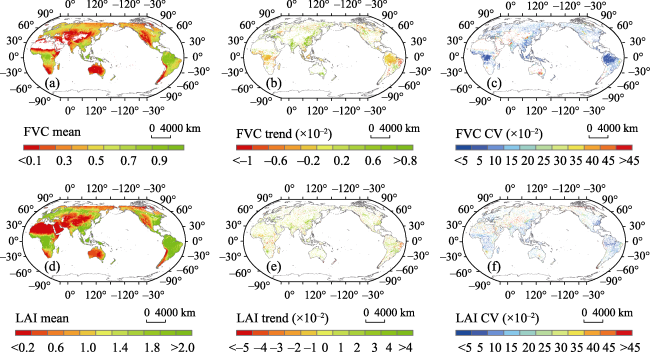
Figure 2 Spatial patterns, temporal trends and coefficient of variation (CV) of global vegetation change of FVC (a-c) and LAI (d-f) from 2001 to 2017. The p value was used as the coefficient of variation test, and only trends that were significant at p < 0.05 are presented.

3.2 Estimation of the global PM2.5 deposition

The dry deposition of air pollution was calculated by utilizing the methods described in Section 2.2. Figure 3 shows the overall trends of global PM2.5 concentration, deposition velocity (Vd) and the corresponding deposition over land. Generally, all variables showed increasing trends. However, there was a declining trend in the PM2.5 concentration after 2012 (Figure 3a). The main reason for this pattern may be attributed to the strict air quality improvement plan in some countries, particularly the strictest-ever Air Pollution Prevention and Control Action Plan (Action Plan) promulgated by the Chinese State Council in 2013, which has strongly mitigated air pollution (Zhang et al., 2019; Zou et al., 2019). Another noteworthy issue is that the trend in dry deposition (Figure 3c) is much more consistent with the PM2.5 concentration (Figure 3a) than with the deposition velocity (Figure 3b). Because of the slight interannual change in deposition velocity, dry deposition variation may mainly depend on the PM2.5 concentration variation.
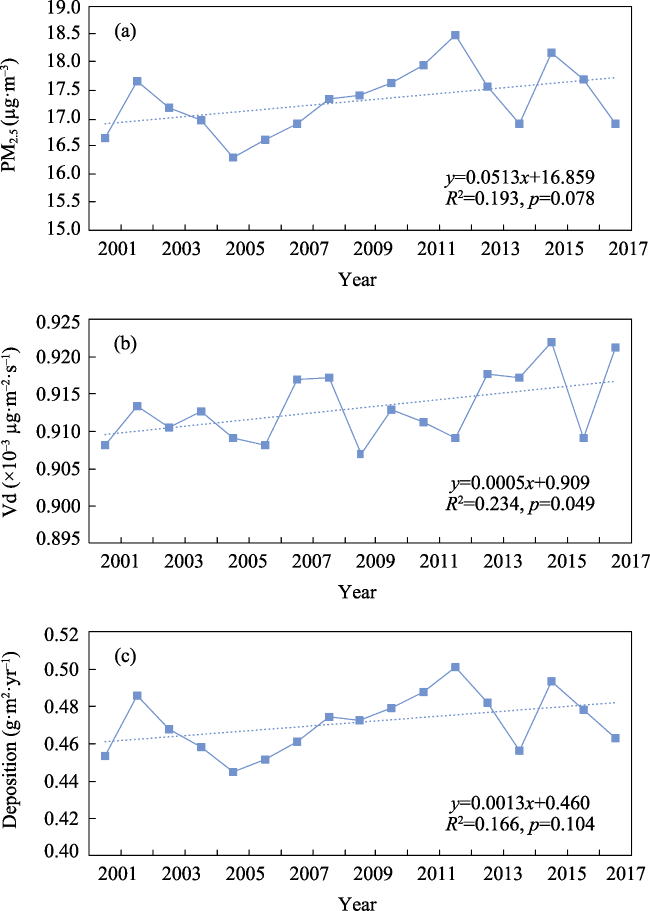
Figure 3 Overall trends of (a) global PM2.5 concentration, (b) deposition velocity and (c) dry deposition over land from 2001 to 2017. The temporal trends were assessed by linear regression.
Figure 4 depicts the spatial patterns of the deposition variables, which showed significant spatial variability. Specifically, global PM2.5 expserienced the paradigm of “Polluting in Polluted and Cleaning in Clean” (PIPCIC), which is consistent with the results of our previous study (Feng et al., 2019). The mean global PM2.5 concentration was 17.32 µg·m-3, with serious air pollution more likely to be observed over East Africa, India and East China (Figure 4a). Temporally, air quality improved in America and western Europe, while it worsened significantly in India, the Middle East and Central Africa (Figure 4b). The great difference between this study and our previous study is the PM2.5 trend in China. As shown in our previous study, northern China experienced a worsening trend of air pollution from 1998 to 2015 (Feng et al., 2019). In this study, however, there was no significant change in air pollution in China from 2001 to 2017. The main reason for this pattern may be attributed to the efforts of air pollution prevention and control, which has attained great achievements in improving air quality and has lessened the worsening trend of air pollution seen in previous years. Zhang et al. (2019) revealed that the national annual mean PM2.5 concentrations decreased from 61.8 to 42.0 µg·m‒3 from 2013 to 2017, with major contributions from anthropogenic emission abatements (accounting for 92% of the total reduction).
The pattern and trend of deposition velocity (Vd) (Figures 4d and 4e) are much more complex than those of PM2.5 concentration. Overall, the mean Vd of PM2.5 was 0.91 × 10‒3 µg·m‒2·s‒1 at the global scale. High velocities mainly occurred in North America, North Africa, Europe and Australia, which were mainly characterized by sparsely vegetated regions. Our results were different from those of several local or regional studies, in which forests were usually correlated with the highest deposition velocity (Matsuda et al., 2010; Dzierzanowski et al., 2011; Shen et al., 2013; García De Jalon et al., 2019). The main reason might be attributed to the scale effect of dry deposition and the corresponding driving factors. Most previous studies were performed at local or regional scales with relatively homogeneous climate and surface conditions. Therefore, the spatial variability of dry deposition mainly depended on the physiological activities of the different vegetation types. At the
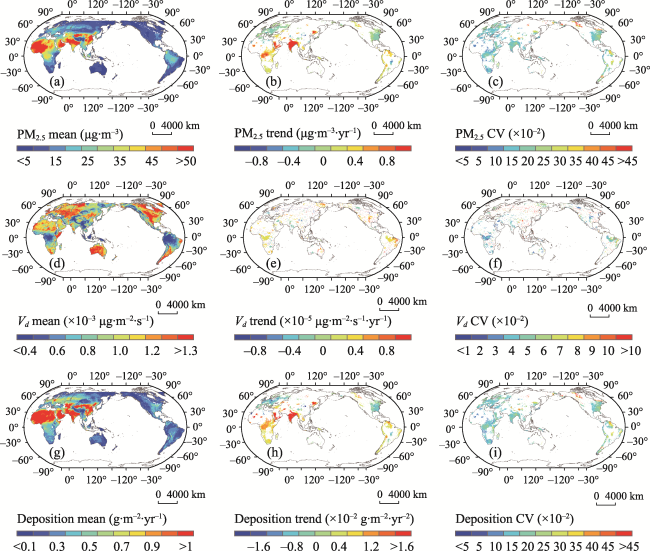
Figure 4 Spatial patterns of the multiyear means, temporal trends and coefficients of variation (CV) of the global PM2.5 concentration (a-c), deposition velocity (d-f) and dry deposition (g-i) in recent decades (2001-2017). The p value was used as the coefficient of variation test, and only trends that were significant at p < 0.05 are presented.
global scale, however, climate (e.g., wind and friction velocity) and surface (e.g., terrain) variables were also spatially heterogeneous, which exerted unavoidable influence on the spatial variability of air pollution deposition (Zheng et al., 2016; Liu et al., 2020). In other words, spatial dry deposition was controlled by the combined effects of vegetation, climate and surface variables at a larger scale rather than by a single factor. We further examined the crucial parameters of Vd estimation and found that the sparsely vegetated regions discussed above were mainly located in flat terrain, which correlated with the high friction velocity (u*). This could further generate a high deposition velocity according to Eqs. (3)-(5). Therefore, the scale effect should be taken into full consideration in research on the evolution of air pollution over different scales (Feng et al., 2017).
Dry deposition was estimated based on the PM2.5 concentration (C) and deposition velocity (Vd) (Figures 4g and 4h). Generally, the multiyear mean global deposition was 0.47 g·m‒2·yr‒1, which is consistent with the magnitude proposed in previous studies over various regions (Matsuda et al., 2010; Du et al., 2019; Yan et al., 2020). Spatially, the deposition was high in North Africa, the Middle East, India and most regions of China, and the spatial pattern was consistent with the distribution of the deposition of particulate matter components, e.g., nitrogen (Lu et al., 2013; Liu et al., 2020) and dust (Zheng et al., 2016). Deposition also presented a significant temporal trend that varied by region (Figure 4h). Specifically, deposition showed a significant decreasing trend over eastern America and western Europe, while deposition showed an increasing trend in Central Africa, a part of the Middle East, and India. Finally, the CV values were relatively low for all variables of PM2.5, Vd and corresponding deposition (Figures 4c, 4f and 4i), suggesting that air pollution and deposition change slightly at the annual scale. However, the study by Cohen et al. (2017) suggested that air pollution and Vd may vary significantly at a finer scale (i.e., the daily or monthly scales), which needs further investigation to capture the variations in detail.

3.3 Impact of vegetation change on global dry deposition

The impact of vegetation change on PM2.5 was then evaluated by using the above method. Statistical results showed that the mean vegetation-related dry deposition was 0.26 g·m‒2·yr‒1, contributing 54.98% of the total deposition at the global scale. In addition, deposition over different land use types was also calculated (Figure 5). The velocity was high over water (1.36 × 10‒3 µg·m‒2·s‒1) and wetlands (1.21 × 10‒3 µg·m‒2·s‒1) and the lowest over evergreen broadleaf forests (0.45 × 10‒3 µg·m‒2·s‒1) in tropical areas. With respect to the dry deposition, the highest values occurred over barren land (1.21 g·m‒2·yr‒1), which might be attributed to the high concentration of air pollution (particularly in the Sahara, Arabian and Thar Deserts) (see Figure 4). In contrast, deposition amounts were relatively low in forests, with the lowest occurring in evergreen needleleaf forests (0.17 g·m‒2·yr‒1). The potential reasons for this pattern are discussed in Section 3.2. Although vegetation has a high capacity for air pollution absorption at the local or regional scale, its influence is disturbed by the spatial variabilities in climate and surface conditions at the global scale. Further examination revealed that most densely vegetated regions were characterized by low friction velocities (u*), which subsequently generated slow deposition velocities.
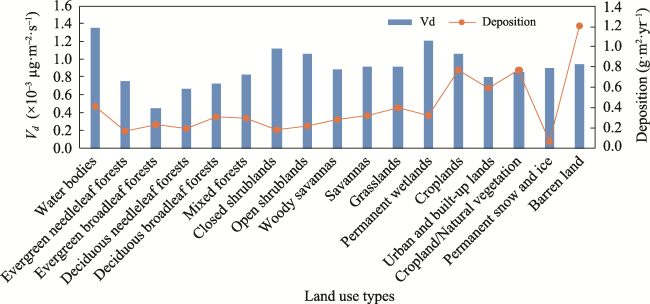
Figure 5 Global deposition velocity and final dry deposition over different land use types
Pixelwise vegetation-related dry deposition and temporal trends are shown in Figure 6. Spatially, the deposition was high in the Amazon, Central Africa and East China (Figure 6a), but the causes may be very different. Although air pollution and deposition velocity were relatively weak in the Amazon, dense vegetation absorbed a large amount of pollution. With respect to Central Africa and East China, both serious air pollution and dense vegetation exerted combined effects on high dry deposition. An exception can be found in India, which has experienced serious air pollution and profound greening trends, while the vegetation-related dry deposition was relatively low. The main reason for this pattern might be that greening in India is mostly from croplands (82%), which were characterized by low leaf area and coverage fraction when compared with forests (Janhäll, 2015; Chen et al., 2019; Xing and Brimblecombe, 2019). Therefore, although dry deposition was high in India (Figure 4g), the low LAI and FVC of croplands weakened the amount of vegetation absorption according to Eq. (6). On the other hand, however, vegetation-related deposition presented a significant increasing trend in India (Figure 6b) due to worsening air pollution and total deposition (Figures 4b and 4f). Other hotspots of increasing deposition occurred in Central Africa, northern South America and northern Asia, which correspond to the combined impacts of air pollution and vegetation change. In contrast, vegetation-related deposition showed a significant decreasing trend over eastern America and western Europe, which was mainly due to cleaner air conditions in recent decades. The combined effects of changing deposition and vegetation generated a complex pattern and trend of vegetation-related dry deposition, which needs further identification of the driving forces.
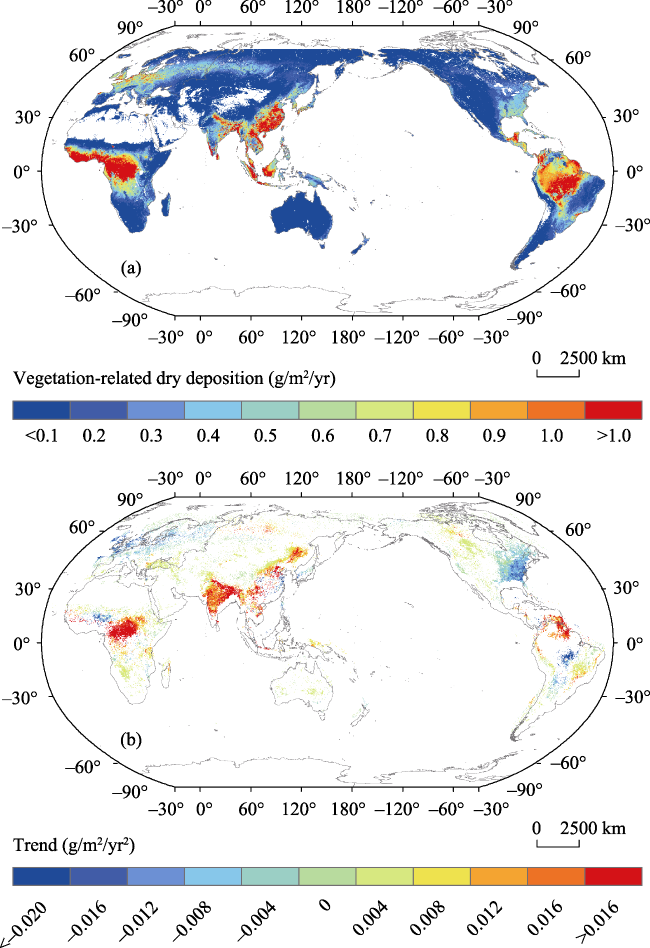
Figure 6 Spatial patterns of (a) the multiyear means and (b) trends of global PM2.5 deposition on vegetation. The p value was used as the coefficient of variation test, and only trends that were significant at p < 0.05 are presented.

4 Conclusions

In this study, we examined the impact of global vegetation change on the dry deposition of PM2.5. To eliminate the uncertainty from data sources, only the trends or correlations that were significant at p < 0.05 were presented for analysis. Several conclusions can be drawn from this study.
The calculation of dry deposition depends on two key parameters: air pollution concentration (C) and deposition velocity (Vd). The main challenge was the estimation of Vd. The algorithm used by Zhang and He (2014) in this study was an effective method with less uncertainty and supported dry deposition estimation at the global scale. Our results demonstrated that global dry deposition of PM2.5 presented a weak increasing trend in the past decade due to the increase in both PM2.5 concentration and Vd. Generally, the temporal trend and spatial pattern of deposition were much more consistent with those of the PM2.5 concentration, suggesting that the concentration may have a major influence. Clarification of the relationship of deposition with concentration and Vd could help to capture the law of deposition change.
Due to the dense vegetation coverage over land, global vegetation absorbed 0.26 g·m‒2·yr‒1 of PM2.5 pollution, contributing 54.98% of the total dry deposition. Specifically, vegetation-related dry deposition was high in the Amazon, Central Africa and East China and increased in Central Africa and India because of worsening air pollution. Large amounts of absorption, Vd and dry deposition were low per unit area in the vegetated regions at the global scale. The reason for this pattern was that heterogeneous global climatic and surface variables (particularly friction velocity) affected the spatial variability of dry deposition. Therefore, scale effects should be taken into consideration when evaluating the impact of vegetation. These results helped to strengthen the understanding of dry deposition and the corresponding driving factors at different scales, which supports related environmental management.
Several issues should be addressed in our future research. First, this study evaluated vegetation by using general indicators of FVC and LAI, which had difficulty capturing the influences of different land-cover types. It is necessary to estimate deposition over different vegetation types for land use planning and management. Second, our study focused on the influence of vegetation at the global scale, in which the sign and magnitude were very different from previous studies performed at the local or regional scale. It is therefore necessary to clarify the correlations of vegetation influences at different scales. Finally, several empirical parameters were used in Zhang and He’s algorithm, particularly for the calculations of gravitational settling velocity (Vg) and surface resistance (Rs). Although major drivers of the two parameters were captured to realize the algorithm, it contained unavoidable uncertainty because of the simplification of other factors. Therefore, physical models of the variables are expected to reduce the uncertainty and to improve the performance of dry deposition estimation. These studies will be highly useful for capturing the physical mechanisms for the evolution of air pollution.
[1]
Aragão L E O C, Anderson L O, Fonseca M G et al., 2018. 21st century drought-related fires counteract the decline of Amazon deforestation carbon emissions. Nature Communications, 9: 536.

DOI PMID

[2]
Bagley J E, Desai A R, Harding K J et al., 2014. Drought and deforestation: Has land cover change influenced recent precipitation extremes in the Amazon? Journal of Climate, 27(1): 345-361.

DOI

[3]
Campos-Taberner M, Javier Garcia-Haro F, Moreno A et al., 2015. Mapping leaf area index with a smartphone and Gaussian processes. IEEE Geoscience and Remote Sensing Letters, 12(12): 2501-2505.

DOI

[4]
Chen C, Park T, Wang X et al., 2019. China and India lead in greening of the world through land-use management. Nature Sustainability, 2(2): 122-129.

DOI PMID

[5]
Cheng M, Jiang H, Guo Z et al., 2013. Estimating NO2 dry deposition using satellite data in eastern China. International Journal of Remote Sensing, 34(7): 2548-2565.

DOI

[6]
Cohen J B, Lecoeur E, Ng D H L, 2017. Decadal-scale relationship between measurements of aerosols, land-use change, and fire over Southeast Asia. Atmospheric Chemistry and Physics, 17(1): 721-743.

[7]
De Jong R, De Bruin S, De Wit A et al., 2011. Analysis of monotonic greening and browning trends from global NDVI time-series. Remote Sensing of Environment, 115(2): 692-702.

DOI

[8]
Du J, Zhang X, Huang T et al., 2019. Removal of PM2.5 and secondary inorganic aerosols in the North China Plain by dry deposition. Science of the Total Environment, 651(2): 2312-2322.

DOI

[9]
Dzierzanowski K, Popek R, Gawronska H et al., 2011. Deposition of particulate matter of different size fractions on leaf surfaces and in waxes of urban forest species. International Journal of Phytoremediation, 13(10): 1037-1046.

PMID

[10]
Fang X, Zou B, Liu X et al., 2016. Satellite-based ground PM2.5 estimation using timely structure adaptive modeling. Remote Sensing of Environment, 186: 152-163.

DOI

[11]
Feldman M S, Howard T, Mcdonald-Buller E et al., 2007. Applications of satellite remote sensing data for estimating dry deposition in eastern Texas. Atmospheric Environment, 41(35): 7562-7576.

DOI

[12]
Feng H, Liu Y, 2014. Trajectory based detection of forest-change impacts on surface soil moisture at a basin scale [Poyang Lake Basin, China]. Journal of Hydrology, 514(June): 337-346.

[13]
Feng H, Liu Y, 2015. Combined effects of precipitation and air temperature on soil moisture in different land covers in a humid basin. Journal of Hydrology, 531(December): 1129-1140.

[14]
Feng H, Zou B, 2019a. A greening world enhances the surface-air temperature difference. Science of the Total Environment, 658: 385-394.

DOI

[15]
Feng H, Zou B, 2019b. Satellite-based estimation of the aerosol forcing contribution to the global land surface temperature in the recent decade. Remote Sensing of Environment, 232: 111299.

DOI

[16]
Feng H, Zou B, 2020. Satellite-based separation of climatic and surface influences on global aerosol change. International Journal of Remote Sensing, 41(14): 5443-5456.

DOI

[17]
Feng H, Zou B, Tang Y, 2017. Scale- and region-dependence in landscape-PM2.5 correlation: Implications for urban planning. Remote Sensing, 9(9): 918.

DOI

[18]
Feng H, Zou B, Wang J et al., 2019. Dominant variables of global air pollution-climate interaction: Geographic insight. Ecological Indicators, 99(April): 251-260.

[19]
Fenger J, 2009. Air pollution in the last 50 years: From local to global. Atmospheric Environment, 43(1): 13-22.

DOI

[20]
Findell K L, Berg A, Gentine P et al., 2017. The impact of anthropogenic land use and land cover change on regional climate extremes. Nature Communications, 8: 989.

DOI

[21]
Friedl M A, Mciver D K, Hodges J C F et al., 2002. Global land cover mapping from MODIS: Algorithms and early results. Remote Sensing of Environment, 83(1/2): 287-302.

DOI

[22]
Friedl M A, Sulla-Menashe D, Tan B et al., 2010. MODIS Collection 5 global land cover: Algorithm refinements and characterization of new datasets. Remote Sensing of Environment, 114(1): 168-182.

DOI

[23]
Fu B, Wang S, Zhang J et al., 2019. Unravelling the complexity in achieving the 17 sustainable-development goals. National Science Review, 6(3): 386-388.

DOI

[24]
Fu Y, Xu W, Wen Z et al., 2020. Enhanced atmospheric nitrogen deposition at a rural site in northwest China from 2011 to 2018. Atmospheric Research, 245(November): 105071.

DOI

[25]
Gallagher M W, Nemitz E, Dorsey J R et al., 2002. Measurements and parameterizations of small aerosol deposition velocities to grassland, arable crops, and forest: Influence of surface roughness length on deposition. Journal of Geophysical Research: Atmospheres, 107(D12): 4154.

DOI

[26]
García De Jalon S, Burgess P J, Curiel Yuste J et al., 2019. Dry deposition of air pollutants on trees at regional scale: A case study in the Basque Country. Agricultural and Forest Meteorology, 278(November): 107648.

DOI

[27]
Gong C, Lei Y, Ma Y et al., 2020. Ozone-vegetation feedback through dry deposition and isoprene emissions in a global chemistry-carbon-climate model. Atmospheric Chemistry and Physics, 20(6): 3841-3857.

[28]
Hammer M S, Van Donkelaar A, Li C et al.,2020. Global estimates and long-term trends of fine particulate matter concentrations (1998-2018). Environmental Science & Technology, 54(13): 7879-7890.

DOI

[29]
Harrison R M, Deaco A R, Jones M R, 1997. Sources and processes affecting concentrations of PM10 and PM2.5 particulate matter in Birmingham (U.K.). Atmospheric Environment, 31(24): 4103-4117.

DOI

[30]
Heald C L, Spracklen D V, 2015. Land use change impacts on air quality and climate. Chemical Reviews, 115(10): 4476-4496.

DOI

[31]
Hicks B B, Baldocchi D D, Hosker R P et al., 1985. On the use of monitored air concentrations to infer dry deposition. NOAA Technical Memorandum ERL ARL-1411985, MD: Silver Springs.

[32]
Howells M, Hermann S, Welsch M et al., 2013. Integrated analysis of climate change, land-use, energy and water strategies. Nature Climate Change, 3(7): 621-626.

DOI

[33]
Huang Y, Shen H, Chen H et al., 2014. Quantification of global primary emissions of PM2.5, PM10, and TSP from combustion and industrial process sources. Environmental Science & Technology, 48(23): 13834-13843.

DOI

[34]
Huber S, Fensholt R, Rasmussen K, 2011. Water availability as the driver of vegetation dynamics in the African Sahel from 1982 to 2007. Global and Planetary Change, 76(3/4): 186-195.

DOI

[35]
Janhäll S, 2015. Review on urban vegetation and particle air pollution: Deposition and dispersion. Atmospheric Environment, 105(March): 130-137.

DOI

[36]
Liu L, Zhang X, Xu W et al., 2020. Global estimates of dry ammonia deposition inferred from space-measurements. Science of the Total Environment, 730(August): 139189.

DOI

[37]
Lu X, Jiang H, Zhang X et al., 2013. Estimated global nitrogen deposition using NO2 column density. International Journal of Remote Sensing, 34(24): 8893-8906.

DOI

[38]
Matsuda K, Fujimura Y, Hayashi K et al., 2010. Deposition velocity of PM2.5 sulfate in the summer above a deciduous forest in central Japan. Atmospheric Environment, 44(36): 4582-4587.

DOI

[39]
Mcdonald A G, Bealey W J, Fowler D et al., 2007. Quantifying the effect of urban tree planting on concentrations and depositions of PM10 in two UK conurbations. Atmospheric Environment, 41(38): 8455-8467.

DOI

[40]
Mehta M, Singh R, Singh A et al., 2016. Recent global aerosol optical depth variations and trends: A comparative study using MODIS and MISR level 3 datasets. Remote Sensing of Environment, 181: 137-150.

DOI

[41]
Mishchenko M I, Geogdzhayev I V, Rossow W B et al., 2007. Long-term satellite record reveals likely recent aerosol trend. Science, 315(5818): 1543-1543.

PMID

[42]
Monticelli D D F, Santos J M, Dourado H O et al., 2020. Assessing particle dry deposition in an urban environment by using dispersion models. Atmospheric Pollution Research, 11(1): 1-10.

[43]
Negrón-Juárez R I, Koven C D, Riley W J et al., 2015. Observed allocations of productivity and biomass, and turnover times in tropical forests are not accurately represented in CMIP5 Earth system models. Environmental Research Letters, 10(6): 064017.

DOI

[44]
Nowak D J, Crane D E, Stevens J C, 2006. Air pollution removal by urban trees and shrubs in the United States. Urban Forestry & Urban Greening, 4(3/4): 115-123.

[45]
Olauson J, 2018. ERA5: The new champion of wind power modelling? Renewable Energy, 126(October): 322-331.

[46]
Pausata F S R, Messori G, Zhang Q, 2016. Impacts of dust reduction on the northward expansion of the African monsoon during the Green Sahara period. Earth and Planetary Science Letters, 434(January): 298-307.

[47]
Pederson J, Massman W, Mahrt L et al., 1995. California ozone deposition experiment: Methods, results, and opportunities. Atmospheric Environment, 29(21): 3115-3132.

DOI

[48]
Petroff A, Mailliat A, Amielh M et al., 2008. Aerosol dry deposition on vegetative canopies. Part I: Review of present knowledge. Atmospheric Environment, 42(16): 3625-3653.

[49]
Pielke Sr R A, Pitman A, Niyogi D et al., 2011. Land use/land cover changes and climate: modeling analysis and observational evidence. Wiley Interdisciplinary Reviews: Climate Change, 2(6): 828-850.

[50]
Ramon J, Lledó L, Torralba V et al., 2019. What global reanalysis best represents near-surface winds? Quarterly Journal of the Royal Meteorological Society, 145(724): 3236-3251.

DOI

[51]
Saylor R D, Baker B D, Lee P et al., 2019. The particle dry deposition component of total deposition from air quality models: right, wrong or uncertain? Tellus B: Chemical and Physical Meteorology, 71(1): 1550324.

DOI

[52]
Shen J, Li Y, Liu X et al., 2013. Atmospheric dry and wet nitrogen deposition on three contrasting land use types of an agricultural catchment in subtropical central China. Atmospheric Environment, 67(March): 415-424.

[53]
Smith W H. Air pollution and forests:interactions between air contaminants and forest ecosystems. Springer Science & Business Media, 2012.

[54]
Song X-P, Hansen M C, Stehman S V et al., 2018. Global land change from 1982 to 2016. Nature, 560(7720): 639.

DOI

[55]
Sterling S M, Ducharne A, Polcher J, 2013. The impact of global land-cover change on the terrestrial water cycle. Nature Climate Change, 3(4): 385-390.

DOI

[56]
Stow D, Petersen A, Hope A et al., 2007. Greenness trends of Arctic tundra vegetation in the 1990s: Comparison of two NDVI data sets from NOAA AVHRR systems. International Journal of Remote Sensing, 28(21): 4807-4822.

DOI

[57]
Sulla-Menashe D, Gray J M, Abercrombie S P et al., 2019. Hierarchical mapping of annual global land cover 2001 to present: The MODIS Collection 6 Land Cover product. Remote Sensing of Environment, 222: 183-194.

DOI

[58]
Sun Y, Jiang Q, Wang Z et al., 2014. Investigation of the sources and evolution processes of severe haze pollution in Beijing in January 2013. Journal of Geophysical Research: Atmospheres, 119(7): 4380-4398.

[59]
Vecchi R, Marcazzan G, Valli G et al., 2004. The role of atmospheric dispersion in the seasonal variation of PM1 and PM2.5 concentration and composition in the urban area of Milan (Italy). Atmospheric Environment, 38(27): 4437-4446.

DOI

[60]
Verburg P H, Crossman N, Ellis E C et al., 2015. Land system science and sustainable development of the earth system: A global land project perspective. Anthropocene, 12(December): 29-41.

DOI

[61]
Verburg P H, Veldkamp A, 2005. Introduction to the special issue on spatial modeling to explore land use dynamics. International Journal of Geographical Information Science, 19(2): 99-102.

DOI

[62]
Wang Y, Liu C, Wang Q et al., 2021. Impacts of natural and socioeconomic factors on PM2.5 from 2014 to 2017. Journal of Environmental Management, 284(April): 112071.

DOI

[63]
Weber R J, Guo H, Russell A G et al., 2016. High aerosol acidity despite declining atmospheric sulfate concentrations over the past 15 years. Nature Geoscience, 9(4): 282.

DOI

[64]
Wesely M L, 1989. Parameterization of surface resistances to gaseous dry deposition in regional-scale numerical models. Atmospheric Environment (1967), 23(6): 1293-1304.

[65]
Wesely M L, Hicks B B, 2000. A review of the current status of knowledge on dry deposition. Atmospheric Environment, 34(12-14): 2261-2282.

DOI

[66]
Wong A Y H, Geddes J A, Tai A P K et al., 2019. Importance of dry deposition parameterization choice in global simulations of surface ozone. Atmospheric Chemistry and Physics, 19(22): 14365-14385.

[67]
Xiao Z, Liang S, Wang J et al., 2016. Long-time-series global land surface satellite leaf area index product derived from MODIS and AVHRR surface reflectance. IEEE Transactions on Geoscience And Remote Sensing, 54(9): 5301-5318.

DOI

[68]
Xing Y, Brimblecombe P, 2019. Role of vegetation in deposition and dispersion of air pollution in urban parks. Atmospheric Environment, 201(March): 73-83.

[69]
Yan F, Wang P, Kang S et al., 2020. High particulate carbon deposition in Lhasa: A typical city in the Himalayan-Tibetan Plateau due to local contributions. Chemosphere, 247(May): 125843.

DOI

[70]
Yang L, Jia K, Liang S et al., 2016. Comparison of four machine learning methods for generating the GLASS fractional vegetation cover product from MODIS data. Remote Sensing, 8(8): 682.

DOI

[71]
Zhang L, He Z, 2014. Technical note: An empirical algorithm estimating dry deposition velocity of fine, coarse and giant particles. Atmospheric Chemistry and Physics, 14(7): 3729-3737.

[72]
Zhang Q, Zheng Y, Tong D et al., 2019. Drivers of improved PM2.5 air quality in China from 2013 to 2017. Proceedings of The National Academy of Sciences of the United States of America, 116(49): 24463-24469.

[73]
Zheng Y, Zhao T, Che H et al., 2016. A 20-year simulated climatology of global dust aerosol deposition. Science of the Total Environment, 557(July): 861-868.

[74]
Zhu Z, Piao S, Myneni R B et al., 2016. Greening of the Earth and its drivers. Nature Climate Change, 6(8): 791.

DOI

[75]
Zivin J G, Neidell M, 2018. Air pollution’s hidden impacts. Science, 359(6371): 39-40.

DOI

[76]
Zou B, You J, Lin Y et al., 2019. Air pollution intervention and life-saving effect in China. Environment International, 125(April): 529-541.

Outlines

/