Research Articles

Multi-scale analysis of trade-off/synergistic effects of forest ecosystem services in the Funiu Mountain Region, China

  • ZHANG Jingjing ,
  • ZHU Wenbo ,
  • ZHU Lianqi , * ,
  • LI Yanhong
Expand
  • College of Geography and Environmental Science, Henan University, Kaifeng 475004, Henan, China
* Zhu Lianqi (1963-), Professor, specialized in mountain environment and regional development.E-mail:

Zhang Jingjing (1991-), PhD Candidate, specialized in development and utilization of natural resources in mountainous areas. E-mail:

Received date: 2021-12-20

  Accepted date: 2022-02-21

  Online published: 2022-07-25

Supported by

National Natural Science Foundation of China(41671090)

National Basic Research Program (973 Program)(2015CB452702)

Abstract

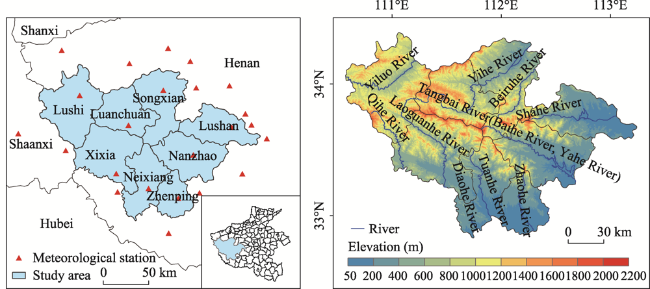
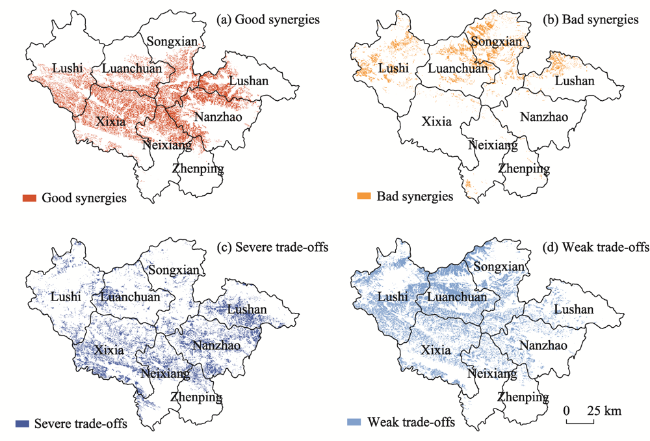
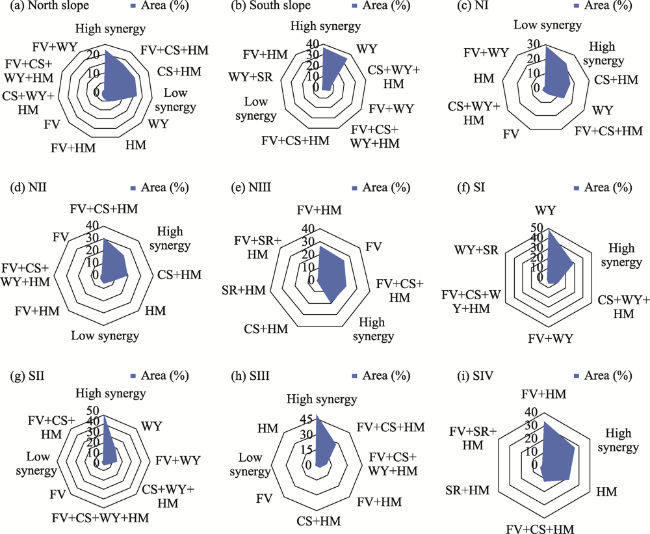
The trade-offs and synergies of forest ecosystem service are important research topics for several disciplines. The multi-scale analysis of service trade-offs and synergies assists in the implementation of more effective forest resource management. Based on multi-source data including forest distribution, topography, NDVI, meteorology and soil conditions, key forest ecosystem services, including total forest volume, carbon storage, water yield, soil retention and habitat quality were mapped and evaluated for the Funiu Mountain Region through integrated deployment of the CASA model, the InVEST3.2 model and the ArcGIS10.2 software. The characteristics of trade-offs and synergies among different ecosystem services were then mapped and considered across multiple spatial scales (i.e., by region, north and south slopes, vertical belt) using the spatial overlay analysis method. The main results are as follows: (1) Mean forest volume is 49.26 m3/ha, carbon density is 156.94 t/ha, water yield depth is 494.46 mm, the unit amount of soil retention is 955.4 t/ha, and the habitat quality index is 0.79. (2) The area of forests with good synergy is 28.79%, and the area of forests with poor synergy is 10.15%, while about 61.06% of forests show severe trade-offs and weak trade-offs. The overall benefits of forest ecosystem services in the study area are still low. In the future, bad synergy and severe trade-off areas should be the focus of forest resource management and efficiency regulation. (3) Synergy between ecosystem services is better for forest on south slope than that on north slope. Deciduous broad-leaved forest belt at moderate elevations on south slope in the mountains (SIII) has the highest synergies, while that at low elevations on north slope (NI) exhibits the lowest synergy levels.

Cite this article

ZHANG Jingjing , ZHU Wenbo , ZHU Lianqi , LI Yanhong . Multi-scale analysis of trade-off/synergistic effects of forest ecosystem services in the Funiu Mountain Region, China[J]. Journal of Geographical Sciences, 2022 , 32(5) : 981 -999 . DOI: 10.1007/s11442-022-1981-x

1 Introduction

Terrestrial ecosystems provide a variety of products and services for human society, thus playing a vital role in the formation and maintenance of environmental conditions and material basis for human survival and development (Li et al., 2012; Hou et al., 2018). The utilization and management of natural resources by different methods leads to pronounced changes in ecosystem functions, which drives the formation of trade-offs with contrasting shifts or synergies with mutual gains between ecosystem services, such as material production, water yield, soil retention, and carbon storage (Asadolahi et al., 2018; Qian et al., 2018). According to the Millennium Ecosystem Assessment, the level of utilization of certain ecosystem services by humans is increasing rapidly, which results in a continuous decline in the supply capacity of some key types of services, especially regulating services and cultural services. This situation seriously influences human well-being and even directly threatens the regional and global ecological security (Millennium Ecosystem Assessment, 2005). In order to reduce the negative effects of the interrelations between ecosystem services, service trade-off studies have emerged and become a major topic in the current research on ecosystem services (Dai et al., 2015).
So far, many researchers have explored the trade-offs between ecosystem services on national, regional, and watershed scales (Su et al., 2013; Jopke et al., 2015; Xue et al., 2015; Sun et al., 2016; Liu et al., 2017; Wang et al., 2017; Asadolahi et al., 2018; Qian et al., 2018; Xu et al., 2018), finding that the trade-off and synergy between the same pair of services vary across different research scales or regions. For example, evidence suggests that synergy is prevalent between water conservation and carbon sequestration/oxygen release services on a large spatial scale (Jopke et al., 2015; Xue et al., 2015), while trade-off appears predominantly between this pair of services over small and medium scales (Su et al., 2013; Sun et al., 2016). Such difference is mainly attributable to the unintegration of natural conditions and ecological processes across different scales, or spatial mismatching between the supply and demand of ecosystem services (Peng et al., 2017). Within different spatial scales, the interest groups each has specific focus on the products and services provided by various ecosystems, such as timber production and water conservation that primarily serve on a regional scale, and biodiversity and carbon sequestration/oxygen release that serve on a global scale (Li et al., 2012). This discrepancy will inevitably lead to differences in the importance attached to various types of ecosystem services by different stakeholders and trade-offs between the management strategies (Peng et al., 2017). Therefore, research on ecosystem service trade-offs must go beyond a single scale. It is necessary to give full consideration to the actual needs of stakeholders across different spatial scales and carry out multi-scale studies of multi-service trade-offs. The purpose is to clarify the trade-offs or synergies between multiple services, their scale dependence, and spatial differentiation, in order to determine the priority and focus of service trade-off management and thereby implement ecosystem service management more effectively (Liu et al., 2017; Peng et al., 2017; Xu et al., 2018).
Forests as a major part of the terrestrial ecosystem provide various types of services and well-being across different scaled regions (Cademus et al., 2014; Wang et al., 2016; Strand et al., 2018). A scientific understanding of trade-offs and synergies between forest ecosystem services is the premise of realizing multi-objective operation and management of forest ecosystems (Dai et al., 2017; Zhu et al., 2018). Many researchers have conducted in-depth studies on forest ecosystem services with regard to their spatial patterns, interactive relationships, and compensation payments for service beneficiaries (Cademus et al., 2014; Jonah et al., 2015; Strand et al., 2018; Thompson et al., 2019). The relationships between forest ecosystem services are explored: there are prevalent trade-offs between provisioning services (Chisholm et al., 2010; Gou et al., 2019); trade-offs occur predominantly between provisioning services and regulating, supporting, and cultural services (Delphin et al., 2016; Kang et al., 2016; Dai et al., 2017), while synergies appear in a few cases (Dai et al., 2017; Gou et al., 2019); trade-offs are generally prevalent between provisioning services and supporting services (Kang et al., 2016; Vangansbeke et al., 2017; Gou et al., 2019), with synergies occurring in a few cases (Eak et al., 2017); there are mainly synergies between regulating services (Gou et al., 2019); both trade-offs (Eak et al., 2017; Gou et al., 2019) and synergies (He et al., 2013; Wang et al., 2013) occur between regulating and supporting services; synergies are prevalent between supporting services (Liang et al., 2016). These findings indicate that synergies are commonly prevalent between services of the same type (except for supplying services), while the trade-off/synergistic relationship between two services of different types shows prominent scale dependence and spatial differentiation. These characteristics will lead to certain one-sidedness in the understanding of ecosystem service trade-offs, making it unable to correctly guide the formulation of rational management measures by decision-makers for an overall improvement of regional ecosystem services. Generally, forest ecosystems are located in mountainous areas, and their unique topographical features result in the complex spatial heterogeneity of interactions between ecosystem services. However, most studies have ignored the influence of topography, and thus hardly provide more accurate information for decision-making. Therefore, a comprehensive discussion on the trade-off/synergistic relationships of ecosystem services across multiple spatial scales is an imperative issue to be solved in the current research on forest ecosystem services and sustainable operation.
Funiu Mountain is located in a transition zone from the northern subtropical to the southern warm temperate climate zone in China. It is also a transition zone between the Qinling Mountains and the Huang-Huai-Hai Plain, which possesses advantageous natural environmental conditions and forms a major ecological functional region in China. However, the Funiu Mountain Region is faced with relatively severe ecological and environmental problems (Zhang et al., 2011) as a result of competition between different ecosystem services under the influence of human activities or natural factors. Therefore, it is crucial to further explore trade-offs and synergies between forest ecosystem services in the Funiu Mountain Region, in order to enable the production of better economic benefits without reducing ecological and social benefits. Previous studies on forest ecosystem services in this region were mainly concentrated in local areas, such as the Baotianman Nature Reserve and Xixia County, or only explored a particular type of forest ecosystems, such as Quercus forest and Q. aliena var. acuteserrata forest ecosystems (Yang et al., 2011; Guo et al., 2012; Yu et al., 2017). As no studies have been carried out from a comprehensive and holistic perspective, the research results appear to be localized and fragmented. Particularly, the relationships between ecosystem services are less studied, making it difficult to provide managers with systematic schemes for sustainable operation of forest ecosystems.
Therefore, in this study, we conducted a comprehensive assessment of forest ecosystem services in the Funiu Mountain Region based on the analysis of multi-source data (including forest type distribution, normalized difference vegetation index [NDVI], meteorology, and soil conditions) using the CASA model, the InVEST 3.2 model, and the ArcGIS 10.2 software. Spatial overlay analysis was used to explore ecosystem service trade-offs and synergies across different spatial scales (by region, north-south slope, and vertical belt). The results will facilitate the formulation of region- and type-specific management planning of forest resources, and thereby provide theoretical guidance and decision-making support for the sustainable operation and management of forests in the Funiu Mountain Region.

2 Data sources and methods

2.1 Study area

Funiu Mountain is located in the western part of Henan Province, China. It is a major range of the Qinling Mountains, running from northwest to southeast. This mountain range borders Henan and Shaanxi provinces to the west, reaches the northern part of Fangcheng to the east, connects with Xiong’er and Waifang mountains to the north, and borders Nanyang Basin to the south. The study area comprises eight complete county units, covering an area of roughly 20,000 km2. Lushi, Luanchuan, Songxian, and Lushan are on the north slope of the Funiu Mountain, while Neixiang, Xixia, Zhenping, and Nanzhao are on the south slope (Figure 1). The terrain descends gradually from the west to the east, with elevation ranging from 50 to 2200 m above sea level. This area has a complex topography and high topographic relief. The vegetation is classified as a transition type from northern-subtropical evergreen and deciduous broad-leaved mixed forest to warm-temperate deciduous broad-leaved forest. The vegetation and climate characteristics show remarkable vertical differentiation (Zhu et al., 2019).
Figure 1 Location and the elevation map of the Funiu Mountain Region, China

2.2 Data sources and processing

The following basic data were used in this study: (1) Forest type map. Thirty-five scenes of GF-1 images acquired in June to October 2016-2017 were selected. After the fusion of 2-m panchromatic and 8-m multispectral images, a multi-spectral image of the study area with a resolution of 2 m was obtained by mosaicing and cropping. On this basis, visual interpretation of forest types in the study area was performed to generate the distribution map of forest types according to the 1:100,000 land cover map and the 1:1,000,000 vegetation type map of 2015 (Figure 2). The dominant tree species in the forest ecosystem of Funiu Mountain mainly include: Q. variabilis, Q. glandulifera var. brevipetiolata, Q. aliena var. acuteserrata, broad-leaved mixed species, Pinus tabulaeformis, P. massoniana, P. armandi, and P. armandi-Q. aliena var. acuteserrata (hereinafter referred to as coniferous and broad-leaved mixed forest) (Song, 1994). A hundred and seventy-nine sets of field survey data were used for accuracy test, and the interpretation accuracy was 82.39%. (2) Digital elevation model (DEM) data. ASTER GDEM data with a spatial resolution of 30 m were derived from the Geospatial Data Cloud (http://www.gscloud.cn). (3) NDVI data. MODIS NDVI data (2016-2017) with a spatial resolution of 250 m were downloaded from http://ladsweb.nascom.nasa.gov/data/. (4) Meteorological data. Daily mean temperature, maximum temperature, minimum temperature, mean relative humidity, precipitation, wind speed, sunshine hours, and mean air pressure recorded at 24 meteorological stations in the study area and the surroundings during 2016-2017 were derived from Henan Meteorological Bureau and Meteorological Data Service Center (http://data.cma.cn/). (5) Soil attribute data. Soil texture, organic matter, and depth data at scale 1:1,000,000 were collected from the Resource and Environmental Science and Data Center, Chinese Academy of Sciences (http://www.resdc.cn).
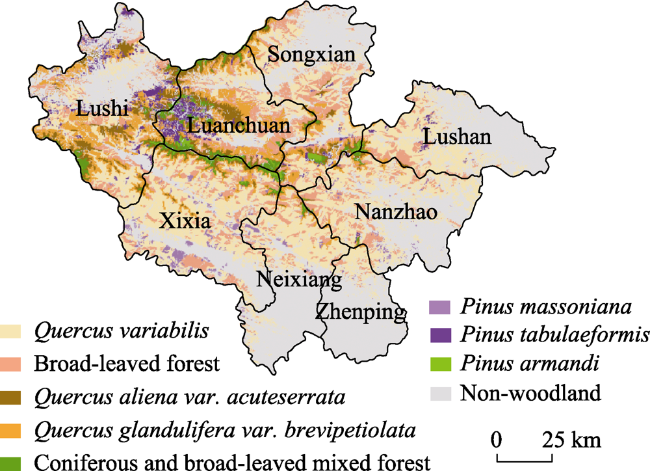
Figure 2 Spatial distribution of forest types in the Funiu Mountain Region
Because the image used for the interpretation of forest type map was from a mosaic of images acquired in 2016 and 2017, both the NDVI and meteorological data were two-year averages of 2016-2017.
The forest type map and DEM data were used to analyze the range of elevations at which the major forest types are distributed on the south and north slopes of Funiu Mountain, and vertical zonation on each slope was classified accordingly. The vertical zonation on the south slope is more complex than on the north slope. The south slope consists of four vertical belts: deciduous broad-leaved forest belt at low elevations (SI, <800 m), coniferous and broad-leaved mixed forest belt containing evergreen species (SII, 800-1200 m), deciduous broad-leaved forest belt at middle elevations (SIII, 1200-1600 m), and coniferous and broad-leaved mixed forest belt at middle elevations (SIV, >1600 m). The north slope consists of three vertical belts: deciduous broad-leaved forest belt at low elevations (NI, <1000 d), deciduous broad-leaved forest belt at middle elevations (NII, 1000-1500 m), and coniferous and broad-leaved mixed forest belt at middle elevations (NIII, >1500 m).

2.3 Assessment of ecosystem services

The CASA model (Zhang et al., 2014), the InVEST model (Sharp et al., 2014), and ArcGIS 10.2 (ArcGIS, ESRI Inc., Redlands, CA, USA) were used to quantitatively assess the spatial patterns of five ecosystem services (forest volume, carbon storage, water yield, soil retention, and habitat quality) in the study. The computation procedures of model parameters are summarized in Table 1.
Table 1 Computational methods of model parameters used in ecosystem service assessment
Service type Computation model or idea Major parameters and processing
Forest
volume
The net primary productivity (NPP) of forest vegetation was computed using the CASA model (Zhang et al., 2014), and the conversion formula of NPP and forest volume for different types of forests in the Funiu Mountain Region was determined according to the literature (Fang et al., 1996; Guang et al., 2006). Finally, the spatial data of forest volume were obtained. The vegetation index was MODIS NDVI. Air temperature, precipitation, and solar radiation were acquired by spatial interpolation using ANUSPLIN. Solar radiation was estimated from sunshine hours (Allen et al., 1998).
Carbon storage Carbon storage module of the InVEST model (Sharp et al., 2014). Carbon density was obtained mainly according to previous studies (Cui et al., 2015; Hu et al., 2017). The above- and below-ground carbon density was estimated based on the root-to-shoot ratio of different tree species (Zhu et al., 2019).
Water
yield
Water yield module of the InVEST model (Sharp et al., 2014). Potential evapotranspiration was calculated using the Penman-Monteith formula on a daily scale (Zhang et al., 2014) and interpolated using ANUSPLIN. Soil depth was obtained by rasterization of soil data. Vegetation available water content was calculated using a nonlinear fitting estimation model of soil available water content (Zhou et al., 2005). Watershed and sub-watershed maps were extracted using the Hydrology toolset in ArcGIS 10.2 based on DEM data.
Soil
retention
Soil retention module of the InVEST model (Sharp et al., 2014). Rainfall erosivity factor was obtained using Wischmeier’s formula on a monthly scale (Wischmeier et al., 1965). Soil erodibility factor was determined using an estimation model of soil erodibility (Williams et al., 1997). Engineering measure factor was assigned 1 in all cases, indicating no implementation of soil and water conservation measures. Vegetation cover and management factor was calculated using the previously reported computation method of forest vegetation management factor (Jiang et al., 1996).
Habitat quality Habitat quality module of the InVEST model (Sharp et al., 2014). Habitat threat sources, including paddy fields, dryland, rural settlements, urban construction land, industrial and mining land, and transportation land, were extracted from a 1:100,000 land cover map (2015) and converted to 30-m raster data. The list of habitat threat sources and sensitivity is available in the literature (Yao, 2017), with values assigned based on the actual situation in the study area. To obtain legal accessibility vectors, the boundary of Funiu National Nature Reserve was extracted using the vegetation map of the reserve and classified according to the level of the reserve, with values assigned of the accessibility in the attribute table.

Note: Raster data of meteorology, soil, and vegetation were saved in Grid format, with a spatial resolution of 250 m. The WGS_1984_Albers geographic coordinate system was used for all data processing.

2.4 Analysis of trade-off/synergistic effects between ecosystem services

Spatial overlay analysis was used to identify the type and region of trade-offs or synergies between forest ecosystem services (Cademus et al., 2014). This method can visually illustrate the spatial differentiation of trade-offs or synergies between multiple services, which will facilitate the effective implementation of management decisions on ecosystem service trade-offs in specific spatial location. The computation procedures are as follows:
(1) Classification of service capacities Due to different units of their physical quantity, various types of services cannot be correlated and compared on the same scale. Therefore, the ecosystem services were first subjected to normalization (Mao et al., 2019), and the supply capacities of various services were then classified into low, medium, and high levels (denoted as 1, 2, and 3, respectively) using the Jenks Natural Breaks method (Table 2).
Table 2 Classification of ecosystem services capacity
Service type Low Medium High
Forest volume 0-0.224 0.224-0.329 0.329-1
Carbon storage 0-0.293 0.293-0.619 0.619-1
Water yield 0-0.325 0.325-0.569 0.569-1
Soil retention 0-0.184 0.184-0.541 0.541-1
Habitat quality 0-0.111 0.111-0.362 0.362-1
(2) Spatial overlay of services After normalization and classification, the raster data of the five ecosystem services were overlaid as follows:
CODE=FV×10000+CS×1000+WY×100+SR×10+HQ
where FV, CS, WY, SR, and HQ represent forest volume, carbon storage, water yield, soil retention, and habitat quality services, respectively. CODE is a five-digit code, and each code sequence contains raster values from any combinations of 1, 2, and 3, representing the supply capacity of the corresponding service type.
(3) Classification criteria of service trade-offs or synergies The trade-off/synergy classification criteria (Table 3) were developed according to the overlap results of the five ecosystem services and the definitions of trade-off and synergy (Li et al., 2012). Trade-offs is divided into strong and weak trade-offs. A strong tradeoff is a state of the ecosystem with high capacity to supply one service and low capacity to supply the other services; a weak tradeoff is a state of the ecosystem with high capacity to supply two, three, or four services and low capacity to supply the other services. Synergies are divided into high and low synergies. A high synergy means that the supply capacities of all the five services are high, which is the most synergistic state and the ultimate goal of ecosystem management; a low synergy means that the supply capacities of all the five services are low, which is the most unsatisfactory state.
Table 3 Classification criteria and statistics of tradeoffs and synergies among the five ecosystem services
Service
relationship
Ratio of
area (%)
Sub-class Ratio of
area (%)
Supply capacity mix Ratio of area (%) Samples
Tradeoffs 61.06 Strong trade-off 24.56 1 high, 4 low 1.45 11311, 11113
1 high, 1 medium and 3 low 2.07 11321, 12113
1 high, 2 medium and 2 low 7.37 12312, 12321
1 high, 3 medium and 1 low 13.67 22312, 32212
Weak trade-off 36.5 2 high, 3 low 1.89 11133, 11313
2 high, 1 medium and 2 low 4.72 23113, 31123
2 high, 2 medium and 1 low 10.78 23213, 23123
3 high, 2 low 3.99 33113, 23313
3 high, 1 medium and 1 low 12.41 33213, 33133
4 high, 1 low 2.72 33313, 33133
Synergy 38.94 High synergy 28.79 5 high 0.83 33333
4 high, 1 medium 4.52 33233, 23333
3 high, 2 medium 7.82 33223, 32332
2 high, 3 medium 7.83 22332, 32322
1 high, 4 medium 6.54 22322, 22232
5 medium 1.24 22222
Low synergy 10.15 1 medium, 4 low 0.25 11211, 12111
2 medium, 3 low 2.11 12112, 12211
3 medium, 2 low 3.6 12212, 22112
4 high, 1 low 4.2 22212, 22122
5 low 0 11111

3 Results

3.1 Quantitative assessment of total forest ecosystem services

Based on the averages across 2016-2017, the total forest volume of the forest ecosystem in the study area is 6.18×10⁷ m3, and the forest volume per unit area is 49.26 m3/ha. The total carbon storage reaches 1.97×10⁸ t, with the carbon density of 156.94 t/ha. The total water yield and water yield depth are 6.06×10⁹ m3 and 494.46 mm, respectively. The total soil retention is 1.16×10⁹ t, and the soil retention per unit area is 955.4 t/ha. The habitat quality index is ~0.79 (Table 4).
Table 4 Total amount and proportion of various ecosystem services of different forest types
Forest type Forest volume Carbon storage Water provision Soil protection Habitat quality
Total
(106 m3)
Ratio
(%)
Total
(106 t)
Ratio
(%)
Total
(108 m3)
Ratio
(%)
Total
(107 t)
Ratio
(%)
Q. variabilis 27.37 44.29 92.15 46.82 31.95 52.70 54.79 47.27 0.71954
Broad-leaved mixed forest 12.25 19.83 43.97 22.34 12.31 20.31 26.18 22.59 0.79984
Q.glandulifera var. brevipetiolata 10.12 16.38 29.63 15.05 7.45 12.28 16.18 13.96 0.88991
Q. aliena var. acuteserrata 6.00 9.71 16.67 8.47 3.56 5.88 7.29 6.29 0.97995
P. tabulaeformis 2.33 3.78 5.15 2.62 1.82 3.00 3.63 3.13 0.81979
Coniferous and broad-leaved mixed forest 2.41 3.90 5.63 2.86 1.69 2.78 4.31 3.72 099998
P. massoniana 0.78 1.26 2.39 1.21 1.45 2.40 2.15 1.86 0.70949
P. armandi 0.53 0.86 1.24 0.63 0.40 0.66 1.37 1.18 0.99798
Total/Average 61.78 100 196.83 100 60.64 100 115.9 100 0.7934
The trends of changes in the total services of various forest types are generally consistent with their area sizes (Table 4). Q. variabilis forest accounts for the largest area proportion (49.03%), and the proportions of total services provided by this type of forest are also the highest, 44%-53%; especially, it contributes the most to water yield, exceeding 50%. Broad-leaved mixed forest ranks the second (20.12%) and accounts for ~20% of the total services; this type of forest makes its greatest contribution to soil retention (22.59%) and carbon sequestration (22.34%). Q. glandulifera var. brevipetiolata forest and Q. aliena var. acuteserrata forest rank the third (13.83%) and fourth (7.25%), amounting to 12%-17% and 5%-10% of the total services, respectively; their contribution to forest volume is especially the greatest, 16.38% and 9.71%, respectively. P. tabulaeformis forest (3.72%) and coniferous and broad-leaved mixed forest (3.31%) account for comparable area proportions, and their contribution to ecosystem services is also close, within the range of 2.6%-4%; compared to P. tabulaeformis forest, coniferous and broad-leaved mixed forest makes a greater contribution to forest volume, carbon sequestration, and soil retention, with the exception of water yield. P. massoniana forest and P. armandi forest with low area proportions (1.96% and 0.78%, respectively) make little contribution to total services, no more than 2.5% each; P. massoniana forest makes it greatest contribution to water yield (2.4%), while P. armandi forest contributes the most to soil retention (1.18%). In short, zonal broad-leaved forests, including Q. variabilis, broad-leaved mixed tree species, Q. glandulifera var. brevipetiolata, and Q. aliena var. acuteserrata, are the major contributors to the total forest ecosystem services in the study area.
There are considerable differences in the habitat quality of various forest types (Table 4). Among them, coniferous and broad-leaved mixed forest, P. armandi forest, and Q. aliena var. acuteserrata forest show the highest habitat quality (all >0.97), followed by Q. glandulifera var. brevipetiolata forest (~0.89). P. tabulaeformis forest and broad-leaved mixed forest are comparable in terms of their habitat quality (~0.8), while Q. variabilis forest and P. massoniana forest have the lowest habitat quality (~0.7). These results indicate that the habitat quality of coniferous and broad-leaved mixed forest, Q. aliena var. acuteserrata forest, and P. armandi forest dominated by natural forests is markedly higher than the habitat quality of Q. variabilis forest and P. massoniana forest dominated by natural secondary forests or artificial plantations.

3.2 Spatial distribution and statistical analysis of service capacity levels

There are remarkable differences in the areas with differing levels of supply capacities of ecosystem services in terms of the spatial distribution (Figure 3), forest area proportion (Figure 4), total service quantity, and service quantity per unit area (Figure 5).
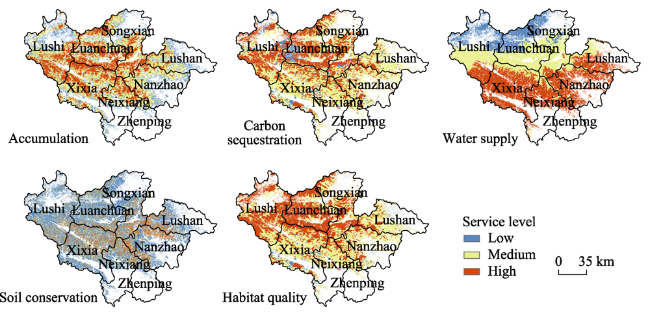
Figure 3 Spatial pattern of the five ecosystem services based on the providing capacity classification in the Funiu Mountain Region
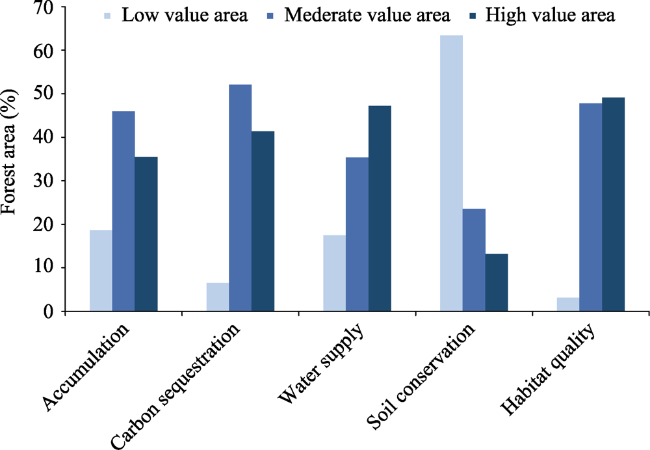
Figure 4 Forest area in different areas of the five ecosystem services in the Funiu Mountain Region
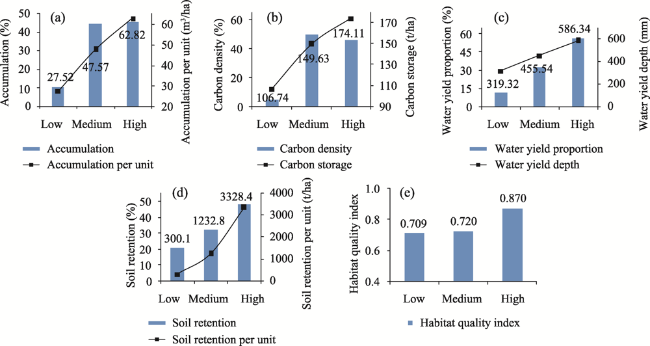
Figure 5 Total amount and unit amount of different areas for various ecosystem services in the Funiu Mountain Region
With regard to forest volume (Figures 3, 4 and 5a), the high value area comprises 35.51% of the forest area, which is mainly distributed at mid-high elevations (>1500 m). In this area, the forest volume per unit area reaches its highest level (62.82 m3/ha), which amounts to 45.29% of the total forest volume. The medium value area comprises the largest proportion of the forest area (45.9%), yet its total forest volume (44.33%) is slightly lower than in the high value area. In this area, the forest volume per unit area is 47.57 m3/ha, and it is mainly located at the middle elevations surrounding the high value area. The low value area comprises the lowest proportion of the forest area (18.58%) and mainly appears at low elevations (<1000 m) and in the piedmont. It has the forest volume per unit area (27.52 m3/ha) and only amounts to 10.38% of the total forest volume.
Considering carbon storage service (Figures 3, 4 and 5b), the high value area comprises 41.34% of the forest area, which has the highest carbon density (174.11 t/ha) and accounts for 45.86% of the carbon storage. Such area is mainly distributed at mid-high elevations in Lushi and Luanchuan on the north slope of Funiu Mountain. The medium value area comprises more than half of the forest area (52.1%) and also accounts for nearly half of total carbon storage (49.68%) in the study area, with the carbon density of 149.63 t/ha. This area mainly occurs at mid-low elevations on the south slope and in Lushan on the north slope. The low value area comprises 6.56% of the forest area, with the carbon density of 106.74 t/ha and only accounting for 4.46% of the carbon storage. This area is mainly found in P. massoniana forest on the south slope and P. tabulaeformis forest on the north slope. In summary, the forest volume and carbon sequestration services are generally above the medium level, but the proportion of medium value area is relatively high. In the future, improving forest quality in the mid-low value areas will raise the overall level of these two services more evidently.
As for water yield service (Figures 3, 4 and 5c), the high value area ranks the first for the proportion of the forest area (47.2%), the proportion of water yield (56.08%), and the depth of water yield (586.34 mm). It provides more than half of the water yield in the study area, and is mainly distributed on the south slope and in Lushi and Lushan on the north slope of Funiu Mountain associated with abundant precipitation. The medium value area comprises 35.34% of the forest area, with the water yield depth of 455.54 mm and accounting for 32.62% of the water yield. This area occurs at mid-high elevations with a high aridity index. The low value area comprises the lowest proportion of the forest area (17.46%), with the water yield depth of 319.32 mm and accounting for 11.3% of the water yield. This area is mainly distributed in the northern part of Lushi, Luanchuan, and Songxian on the north slope associated with low precipitation and high evaporation. These results indicate that on the whole, the water yield service is above the medium level, yet there is prominent spatial differentiation. In the northern part of the study area, the water yield capacity is low and the situation of water resource security is relatively severe.
With respect of soil retention (Figures 3, 4 and 5d), the medium and high value areas comprise 23.52% and 13.14% of the forest area and account for 31.61% and 47.67% of the soil retention, with the soil retention per unit area of 1232.81 and 3328.4 t/ha, respectively. The high value area is mainly distributed at the junction of the counties in the east, while the middle value area is primarily distributed in the northern part of Xixia and at its junction with Neixiang, Luanchuan, and Songxian. The low value area comprises the largest proportion of the forest area (63.34%), while it only accounts for 20.72% of the soil retention, with the lowest soil retention per unit area (only 300.08 t/ha). The low value area is mainly distributed at low elevations (<1000 m) on the south slope and mid-low elevations (<1200 m) on the north slope. The soil retention per unit area in the high value area is approximately 3- and 10-fold that in the medium and low value areas, respectively. According to the results, more than half of the forests in the study area provide the soil retention service at a relatively low level, and there is still great potential for this service. In the future, soil and water conservation work should be strengthened at low elevations on the south slope and mid-low elevations on the north slope of Funiu Mountain, in order to improve the ecological environment and raise the overall service level of soil retention in the study area.
In terms of habitat quality (Figures 3, 4 and 5e), the medium and high value areas comprise similar proportions of the forest area (47.75% and 49.13%, respectively), with the habitat quality indices of 0.72 and 0.87, respectively. The medium value area is mainly distributed in at mid-low elevations on the south slope and in Lushan on the north slope, while the high value area is mainly located at the major ridge of Funiu Mountain and mid-high elevations in Lushi, Luanchuan, and Songxian on the north slope. The low value area comprises a low proportion of the forest area (3.13%) with the lowest habitat quality index (0.709), which is mainly distributed in the artificial plantation and secondary forest areas of P. massoniana and Q. variabilis on the south slope of Funiu Mountain. Overall, the forests in the study area maintain the habitat quality at a relatively high level. However, the habitat quality of artificial plantations and secondary forests in the piedmont is still poor, and there is an urgent need of strengthened management and ecological restoration to improve the overall service level of habitat maintenance.

3.3 Multi-scale analysis of trade-off/synergistic effects of ecosystem services

3.3.1 Trade-off/synergistic effects of ecosystem services on the regional scale

There are high synergistic effects between the ecosystem services in 28.79% of the forest area (Table 3 and Figure 6a), mainly at the major ridge of Funiu Mountain, mid-high elevations (>1000 m) on the south slope, and high elevations (>1500 m) on the north slope. Only 0.83% of the forest area shows high synergies among all the five ecosystem services, while the best synergistic state is not reached among the five services in large areas of forests. In addition, there are low synergistic effect between ecosystem services in 10.15% of the forest area (Table 3 and Figure 6b), with low values among all the five services. Such area mainly occurs innashih the piedmont of the north slope subjected to serious human interference.
Figure 6 Spatial distribution of trade-offs (severe or weak) and synergies (good or bad) among ecosystem services in the Funiu Mountain Region
This area is dominated by artificial plantations and secondary forests, characterized by relatively young tree age and low service levels of forest volume, carbon storage, soil retention, and habitat maintenance. Meanwhile, this area receives low precipitation, resulting in a low service capacity of water yield. Therefore, it is imperative to strengthen the protection of forest resources by implementing the restoration and optimized management of environmental conditions and forest resources in a timely manner.
There are strong trade-off effects between ecosystem services in 24.56% of the forest area (Table 3 and Figure 6c); that is, only one service has high capacity, with fierce competition between different various services, resulting in remarkable benefit conflicts. Part of this area is distributed at mid-low elevations of the south slope and the southern part of Mount Lu, where water yield is predominant. The remaining area is scattered in Luanchuan, Songxian, and Lushi on the north slope, mainly including P. tabulaeformis plantation and aerial seeding forest areas, with high elevations, weak human interference, and high habitat quality, but low capacities of other services. A relatively high proportion of the forest area shows weak trade-offs between ecosystem services (36.5%; Table 3 and Figure 6d); that is, at least two services are provided at high levels, but at least one service is provided at low levels. One part of this area occurs at high elevations on the north slope, which has relatively high service capacities of forest volume and carbon sequestration, but its water yield capacity is weak due to low precipitation and high aridity index. The remaining area is scattered at mid-low elevations on the south slope, with high service capacities of water yield and forest volume but low service capacities of habitat maintenance and soil retention.
In short, there exist high synergistic effects between ecosystem services in 28.79% of the forest area in the study area, while the relationships among the five services are still unsatisfactory in the remaining 71.21% of the forest area. Thus, the overall benefits of the ecosystem services are still low in the study area. Therefore, low synergy and strong trade-off areas should be considered as key objects for forest resource management and benefit regulation in the future.

3.3.2 Trade-off/synergistic effects of ecosystem services on the scale of south-north slope

The trade-off and synergistic effects between forest ecosystem services show certain differences on the north and south slopes of Funiu Mountain (Figures 7a and 7b). In both cases, the high synergy area accounts for the largest area proportion, but this proportion is markedly higher on the south slope (37.09%) than on the north slope (22.32%). Conversely, the low synergy area accounts for a considerably higher proportion on the north slope (17.06%) than on the south slope (1.24%). These results indicate that the forest ecosystem services achieve better synergies on the south slope compared with the north slope of Funiu Mountain. Moreover, on the north slope, 17.51% and 17.39% of the area is dominated by synergies of three services (FV+CS+HM) and two services (CS+HM), respectively, while the remaining services show weak trade-offs with each other. In contrast, on the south slope, the single service of water yield is dominant in a large proportion of the area (34.6%), with strong trade-offs between ecosystem services.

3.3.3 Trade-off/synergistic effects of ecosystem services on the scale of vertical belt

There are also substantial differences in the trade-off and synergic effects between forest ecosystem services across different vertical belts (Figures 7c-7i). In the deciduous broad-leaved forest belt at low elevations on the north slope (NI; Figure 7c), 28.95% of the area shows low synergies between ecosystem services, and 22.05% of the area shows high synergies. Carbon sequestration + habitat maintenance services are synergistically dominant in 17.27% of the area, while the single service of water yield is dominant 14.45% of the area. In the deciduous broad-leaved forest belt on the north slope (NII; Figure 7d), 30.58%, 22.94%, and 19.31% of the area shows synergistic dominance of forest volume + carbon sequestration + habitat maintenance services, high synergies of ecosystem services, and synergistic dominance of carbon sequestration + habitat maintenance services, respectively. It can be seen that a large proportion of the area is synergistically dominated by two or more services, indicating the good synergistic relationship of forest ecosystem services in this vertical belt. In the coniferous and broad-leaved mixed forest belt at middle elevations on the north slope (NIII; Figure 7e), 26.71%, 24.31%, and 21.24% of the area is dominated by synergy of forest volume + habitat maintenance services, single service of forest volume, and synergy of forest volume + carbon sequestration + habitat maintenance services, respectively. The proportion of high synergy area in NIII is 19.58%, which is slightly smaller than in the other two vertical belts (NI and NII). Therefore, the best synergies are achieved among forest ecosystem services in NII. Considering the large proportion of low synergy area in NI, there is an urgent need for low-benefit forest transformation and optimized management; meanwhile, the improvement of forest volume and soil retention services should be taken into account. In NIII, attention must be paid to improving water yield and soil retention services.
Figure 7 Ecosystem service trade-off and synergy on the north and south slopes and on the vertical belt scale in the Funiu Mountain Region
In the deciduous broad-leaved forest belt at low elevations on the south slope (SI; Figure 7f), the area dominated by the single service of water yield accounts for the largest proportion (48.95%), followed by high synergy area (28.98%). In addition, 10.63% of the area is dominated by synergy of carbon sequestration + water yield + habitat maintenance services. In the coniferous and broad-leaved mixed forest belt containing evergreen species (SII) and the deciduous broad-leaved forest belt at middle elevations on the south slope (SIII, Figure 7h), the proportions of high synergy area are comparable (~50%). In SII, 32.17% of the area is dominated by the single service of water yield and the synergy of forest volume + water yield services, while in SIII, 37.71% of the area is dominated by synergies of three (FV+CS+HM) and four (FV+CS+WY+HM) services. This result indicates that the synergies of forest ecosystem service in SIII are better than in SII. In the coniferous and broad-leaved mixed forest belt at middle elevations on the south slope (SIV; Figure 7i), the area dominated by synergy of forest volume + habitat maintenance services accounts for the largest proportion (33.52%), followed by high synergy area (26.74%). In addition, 21.61% and 12.24% of area is dominated by the single service of habitat maintenance and synergy of forest volume + carbon sequestration + habitat maintenance services, respectively. These results indicate that the forest ecosystem services achieve their best synergies in SIII, followed by those in SII. Forest volume and soil retention services should be improved in SI, while water yield and soil retention services should be improved in SIV.
In summary, the best synergies of forest ecosystem services are achieved in the mid-mountain deciduous broad-leaved forest belt on the south slope (SIII), while the worst synergies occur in the deciduous broad-leaved forest belt at low elevations on the north slope (NI).

4 Conclusions and discussion

4.1 Conclusions

(1) The forest ecosystem in the study area has the mean forest volume of 49.26 m3/ha, carbon density of 156.94 t/ha, water yield depth of 494.46 mm, soil retention of 955.4 t/ha, and habitat quality index of 0.79.
(2) The supply capacities of forest ecosystem services show certain differences across the areas with different service capacity levels. The soil retention service shows considerable changes, which is approximately 3- and 10-fold in the high value area compared with the medium and low value areas, respectively. The other four services have relatively small changes, which are approximately 1-2.5-fold in the high value area compared with the low value area. Therefore, it is imperative to strengthen stand transformation in the mid-low value area of soil retention, or take engineering measures to improve soil retention service, in order to give full play to the potential of forest ecosystem for soil retention service in the study area.
(3) On a regional scale, there are high synergies between ecosystem services in 28.79% of the forest area, while low synergies occur in 10.15% of the forest area. Meanwhile, strong and weak trade-offs exist in 61.06% of the forest area. Hence, the overall benefits of forest ecosystem services are still low and the relationships between services are unsatisfactory in the study area. Low synergy and strong trade-off areas should be taken as the key targets for forest resources management and benefit regulation in the future.
(4) On the scale of north-south slope, the synergies between forest ecosystem services are better on the south slope than the north slope of Funiu Mountain. On the scale of vertical belt, the best service synergies are achieved in SIII, while the worst service synergies occur in NI.

4.2 Discussion

In this study, spatial overlay analysis was used to identify the trade-offs and synergies between five services of forest ecosystems across three spatial scales (region, north-south slope, and vertical belt). This method can identify the specific area where trade-offs occur between multiple services (Cademus et al., 2014), and the results will facilitate the trade-off management decision to correspond to a specific spatial location, thereby implementing forest resource management more effectively. The current study shows that the relationships of the five ecosystem services are still unsatisfactory in 71.21% of the forest area in the Funiu Mountain Region. There exist different degrees and types of benefit conflicts across various spatial scales, which require region- and type-specific management of trade-offs.
On the scale of north-south slope, there are better synergies between forest ecosystem services on the south slope than the north slope. On the north slope, low water yield capacity is the primary cause leading to the occurrence of ecosystem service trade-offs, while on the south slope, there is a prevailing dominance of single water yield service. Therefore, when transforming low-benefit forests, scientific management schemes or engineering measures should be adopted to improve water yield service on the north slope by taking into account the climate background and site conditions, while the influence of forest structure changes on water yield service needs to be monitored on the south slope. Considering the scale of vertical belt, the worst synergies of forest ecosystem services appear in the deciduous broad-leaved forest belt at low elevations on the north slope (NI), which requires optimized management. The low synergy area is distributed in the piedmont of the north slope, where the supply capacities of all the five services are relatively low. Therefore, it is suggested that the protection of forest resources be strengthened and the deforestation be prohibited in this area. One strategy is to improve the service levels of forest volume, carbon sequestration, and habitat maintenance by increasing the proportion of mature and near-mature forests. The other strategy is to improve water yield and soil retention services through engineering measures based on climate background and site conditions.
In addition, strong trade-offs between forest ecosystem services are prevailing in the deciduous broad-leaved forest belt at low elevations on the south slope (SI), which also requires optimized management. Specifically, there is abundant precipitation in SI, most of which is located in the middle and lower river reaches, with low elevation and high catchment. Therefore, the water yield capacity is maximized in SI. However, due to relatively gentle topographic relief and frequent human activity, the forest stands in SI have poor quality, mainly consisting of secondary forests and artificial plantations of young ages, such as Q. variabilis forest, broad-leaved mixed forest, and P. massoniana forest. Therefore, the supply capacities of the remaining four services are relatively low, resulting in prominent strong trade-offs between forest ecosystem services. In such area, firstly, it is recommended to strength management of secondary forests and artificial plantations, promote coniferous and broad-leaved mixed forests to replace pure forests, and improve the capacities of forest ecosystems to supply forest volume, carbon sequestration, soil retention, and habitat maintenance services, thereby attenuating the strong trade-offs between ecosystem services. Secondly, it is suggested to introduce ecological compensation measures based on the needs of local economic development, or assist in the transformation of extensive agricultural production methods in this area, and engage in the maintenance and supervision of forest resources, thereby improving the overall benefits of forest ecosystem services.
In the above section, the trade-off management strategies are discussed by region and type for forest resources in the Funiu Mountain Region. However, those strategies are mostly macro-scale recommendations, which are useful to provide guidance and scientific reference for the management objectives of forest resources across different spatial scales. Future management of forest resources also needs to combine the knowledge of forest ecology, takes into account local environmental conditions, and formulate management schemes based on local conditions. Moreover, the mechanisms that drive the trade-offs between forest ecosystem services are not explored quantitatively in this study. Clarifying the mechanisms by which natural processes and social economic development processes drive ecosystem service trade-offs is useful to the development of scientific and efficient management schemes (Dai et al., 2015). Therefore, future studies should be carried out to quantitatively explore the influence of natural environmental factors, socio-economic factors, and forest resource management behaviors on ecosystem service trade-offs and the associated differences, and clarity the major driving factors of ecosystem service trade-offs. On this basis, the optimal natural environmental factors, socio-economic factors, and forest resource management behaviors can be selected, in order to improve the method of forest resource management and promote the sustainable supply of multiple services by forest ecosystems in the study area, thereby achieving the sustainable operation and management of forest resources.
[1]
Allen R G, Pereira L S, Raes D et al., 1998. Crop evapotranspiration: Guidelines for computing crop water requirements: FAO Irrigation and Drainage Paper 56, FAO, Land and Water Development Division. Rome: Food and Agriculture Organization of the United Nations.

[2]
Asadolahi Z, Salmanmahiny A, Sakieh Y et al., 2018. Dynamic trade-off analysis of multiple ecosystem services under land use change scenarios: Towards putting ecosystem services into planning in Iran. Ecological Complexity, 36: 250-260.

DOI

[3]
Cademus R, Escobedo F J, Mclaughlin D et al., 2014. Analyzing trade-offs, synergies, and drivers among timber production, carbon sequestration, and water yield in Pinus elliotii forests in southeastern USA. Forests, 5(6): 1409-1431.

DOI

[4]
Chisholm R A, 2010. Trade-offs between ecosystem services: Water and carbon in a biodiversity hotspot. Ecological Economics, 69(10): 1973-1987.

DOI

[5]
Cui Gaoyang, Chen Yunming, Cao Yang et al., 2015. Analysis on carbon stock distribution patterns of forest ecosystems in Shaanxi Province. Chinese Journal of Plant Ecology, 39(4): 333-342. (in Chinese)

DOI

[6]
Dai Erfu, Wang Xiaoli, Zhu Jianjia et al., 2015. Progress and perspective on ecosystem services trade-offs. Advances in Earth Science, 30(11): 1250-1259. (in Chinese)

[7]
Dai E, Wang X, Zhu J et al., 2017. Quantifying ecosystem service trade-offs for plantation forest management to benefit provisioning and regulating services. Ecology and Evolution, 7(19): 7807-7821.

DOI

[8]
Delphin S, Escobedo F J, Abd-Elrahman A et al., 2016. Urbanization as a land use change driver of forest ecosystem services. Land Use Policy, 54: 188-199.

DOI

[9]
Eak R, Rik T, Gary L, 2017. Trade-offs and synergies between carbon, forest diversity and forest products in Nepal community forests. Environmental Conservation, 44(1): 5-13.

DOI

[10]
Fang Jingyun, Liu Guohua, Xu Songling, 1996. Biomass and net production of forest vegetation in China. Acta Ecologica Sinica, 16(5): 497-508. (in Chinese)

[11]
Gou Mengmeng, 2017. Trade-off and synergy analysis of ecosystem services of subtropical secondary forests in southern China[D]. Changsha: Central South University of Forestry and Technology. (in Chinese)

[12]
Guang Zengyun, 2006. Study on forest biomass and productivity in Henan. Journal of Henan Agricultural University, 40(5): 493-497. (in Chinese)

[13]
Guo Jianrong, 2012. Studies on technologies of ecosystem service monitor and regulation and control of Quercus aliena var. acuterserrata forests of Baotianman[D]. Zhengzhou: Henan Agricultural University. (in Chinese)

[14]
He Y, Qin L, Li Z et al., 2013 Carbon storage capacity of monoculture and mixed-species plantations in subtropical China. Forest Ecology & Management, 295(5): 193-198.

[15]
Hou Wenjuan, Gao Jiangbo, Dai Erfu et al., 2018. The runoff generation simulation and its spatial variation analysis in Sanchahe basin as the south source of Wujiang. Acta Geographica Sinica, 73(7): 1268-1282. (in Chinese)

DOI

[16]
Hu Wenjie, Wang Xiaorong, Cui Hongxia et al., 2017. Comparison of ecosystem carbon density between Quercus aliena var. acuteserrata and Quercus variabilis forest. Journal of Forest and Environment, 37(1): 8-15. (in Chinese)

[17]
Jiang Zhongshan, Wang Zhiqiang, Liu Zhi, 1996. Quantitative study on spatial variation of soil erosion in a small watershed in the loess hilly region. Journal of Soil Erosion and Soil Conservation, 2(1): 1-9. (in Chinese)

[18]
Jopke C, Kreyling J, Maes J et al., 2015. Interactions among ecosystem services across Europe: Bagplots and cumulative correlation coefficients reveal synergies, trade-offs, and regional patterns. Ecological Indicators, 49: 46-52.

DOI

[19]
Jonah B, Kalifi F G, Jens E et al., 2015. Reductions in emissions from deforestation from Indonesia’s moratorium on new oil palm, timber, and logging concessions. Proceedings of the National Academy of Sciences, 112(5): 1328-1333.

DOI

[20]
Kang H, Seely B, Wang G et al., 2016. Evaluating management tradeoffs between economic fiber production and other ecosystem services in a Chinese-fir dominated forest plantation in Fujian Province. Science of the Total Environment, 557/558: 80-90.

DOI

[21]
Li Peng, Jiang Luguang, Feng Zhiming et al., 2012. Research progress on trade-offs and synergies of ecosystem services: An overview. Acta Ecologica Sinica, 32(16): 5219-5229. (in Chinese)

DOI

[22]
Liang J, Crowther T W, Picard N et al., 2016. Positive biodiversity-productivity relationship predominant in global forests. Science, 354(6309): aaf8957. doi: 10.1126/science.aaf8957.

DOI

[23]
Liu Y, Bi J, Lv J et al., 2017. Spatial multi-scale relationships of ecosystem services: A case study using a geostatistical methodology. Scientific Reports, 7(1): 1-12.

DOI

[24]
Mao Qi, Peng Jian, Liu Yanxu et al., 2019. An ecological function zoning approach coupling SOFM and SVM: A case study in Ordos. Acta Geographica Sinica, 74(3): 460-474. (in Chinese)

[25]
Millennium Ecosystem Assessment (MEA), 2005. Ecosystems and Human Well-Being. Washington, DC: Island Press.

[26]
Peng Jian, Hu Xiaoxu, Zhao Mingyue et al., 2017. Research progress on ecosystem service trade-offs: From cognition to decision-making. Acta Geographica Sinica, 72(6): 960-973. (in Chinese)

DOI

[27]
Qian Caiyun, Gong Jie, Zhang Jinxi et al., 2018. Change and tradeoffs-synergies analysis on watershed ecosystem services: A case study of Bailongjiang Watershed, Gansu. Acta Geographica Sinica, 73(5): 868-879. (in Chinese)

DOI

[28]
Sharp R, Tallis H T, Ricketts T et al., 2014. InVEST User’s Guide. Stanford: The Natural Capital Project.

[29]
Song Chaoshu, 1994. Scientific Survey of the Funiu Mountain Nature Reserve. Beijing: China Forestry Publishing House. (in Chinese)

[30]
Strand J, Soares-Filho B, Costa M H et al., 2018. Spatially explicit valuation of the Brazilian Amazon forest’s ecosystem services. Nature Sustainability, 1(11): 657-664.

DOI

[31]
Su C, Fu B, 2013. Evolution of ecosystem services in the Chinese Loess Plateau under climatic and land use changes. Global and Planetary Change, 101: 119-128.

DOI

[32]
Sun Zexiang, Liu Zhifeng, He Chunyang et al., 2016. Multi-scale analysis of ecosystem service trade-offs in urbanizing drylands of China: A case study in the Hohhot-Baotou-Ordos-Yulin region. Acta Ecologica Sinica, 36(15): 4881-4891. (in Chinese)

[33]
Thompson B S, Friess D A, 2019. Stakeholder preferences for payments for ecosystem services (PES) versus other environmental management approaches for mangrove forests. Journal of Environmental Management, 233: 636-648.

DOI

[34]
Turner K G, Odgaard M V, Bøcher P K et al., 2014. Bundling ecosystem services in Denmark: Trade-offs and synergies in a cultural landscape. Landscape & Urban Planning, 125(10): 89-104.

[35]
Vangansbeke P, Blondeel H, Landuyt D et al, 2017. Spatially combining wood production and recreation with biodiversity conservation. Biodiversity and Conservation, 26(13): 3213-3239.

DOI

[36]
Wang H, Liu S, Wang J et al., 2013. Effects of tree species mixture on soil organic carbon stocks and greenhouse gas fluxes in subtropical plantations in China. Forest Ecology & Management, 300(4): 4-13.

[37]
Wang Pengtao, Zhang Liwei, Li Yingjie et al., 2017. Spatio-temporal characteristics of the trade-off and synergy relationships among multiple ecosystem services in the upper reaches of Hanjiang River Basin. Acta Geographica Sinica, 72(11): 2064-2078. (in Chinese)

DOI

[38]
Wang X, Dai E, Zhu J, 2016. Spatial patterns of forest ecosystem services and influencing factors in the Ganjiang River Basin. Journal of Resources and Ecology, 7(6): 439-452.

DOI

[39]
Williams J R, Arnold J G, 1997. A system of erosion: Sediment yield models. Soil Technology, 11(1): 43-55.

DOI

[40]
Wischmeier W H, Smith D D, 1965. Predicting rainfall-erosion losses from cropland east of the Rocky Mountains: Guide for selection of practices for soil and water conservation. Washington: US Department of Agriculture.

[41]
Xu X, Yang G, Tan Y et al., 2018. Ecosystem services trade-offs and determinants in China’s Yangtze River Economic Belt from 2000 to 2015. Science of the Total Environment, 634: 1601-1614.

DOI

[42]
Xue H, Li S, Chang J, 2015. Combining ecosystem service relationships and DPSIR framework to manage multiple ecosystem services. Environmental Monitoring and Assessment, 187(3): 1-15.

DOI

[43]
Yang Hongxia, 2016. Study on community structure and biomass, carbon storage of oak natural secondary forest in the Funiu Mountains of Henan Province[D]. Zhengzhou: Henan Agricultural University. (in Chinese)

[44]
Yao Yunchang, 2017. Evaluation and dynamics analysis of habitat quality based on InVEST model in the Sanjiang Plain[D]. Changchun: Northeast Institute of Geography and Agroecology, Chinese Academy of Sciences. (in Chinese)

[45]
Yu Chao, Song Liyi, Li Mingyang et al., 2017. Spatio-temporal dynamics of forest aboveground biomass in Xixia County, Henan Province, China. Journal of Nanjing Forestry University (Natural Sciences Edition), 41(6): 93-101. (in Chinese)

[46]
Zhang Y, Qi W, Zhou C et al., 2014. Spatial and temporal variability in the net primary production of alpine grassland on the Tibetan Plateau since 1982. Journal of Geographical Sciences, 24(2): 269-287.

DOI

[47]
Zhang Yamei, Guo Fang, 2011. Ecological carrying capacity of vegetation landscape at Baotianman Nature Reserve in Funiu Mountain. Journal of Northwest Forestry University, 26(5): 224-228. (in Chinese)

[48]
Zhou W, Liu G, Pan J et al., 2005. Distribution of available soil water capacity in China. Journal of Geographical Sciences, 15(1): 3-12.

DOI

[49]
Zhu Jianjia, Dai Erfu, Zheng Du et al., 2018. Characteristic of tradeoffs between timber production and carbon storage for plantation under harvesting impact: A case study of Huitong National Research Station of Forest Ecosystem. Journal of Geographical Sciences, 28(8): 1085-1098. (in Chinese)

DOI

[50]
Zhu W, Zhang X, Zhang J et al., 2019. A comprehensive analysis of phenological changes in forest vegetation of the Funiu Mountains, China. Journal of Geographical Sciences, 29(1): 131-145.

DOI

Outlines

/