Research Articles

Structure and evolution of the submarine cable network of Chinese mainland

  • XIE Yongshun , 1, 2 ,
  • WANG Chengjin , 1, 2, * ,
  • HUANG Jie 1, 2
Expand
  • 1. Institute of Geographic Sciences and Natural Resources Research, CAS, Beijing 100101, China
  • 2. College of Resources and Environment, University of Chinese Academy of Sciences, Beijing 100049, China
* Wang Chengjin (1973-), PhD and Professor, specialized in transportation geography and regional development. E-mail:

Xie Yongshun (1994-), PhD Candidate, specialized in transportation geography and regional development. E-mail:

Received date: 2021-05-25

  Accepted date: 2021-12-07

  Online published: 2022-07-25

Supported by

National Natural Science Foundation of China(42071151)

Strategic Priority Research Program of the Chinese Academy of Sciences(XDA20010101)

Abstract

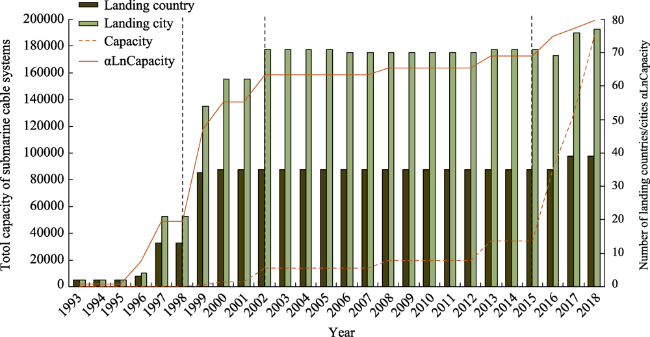
Submarine cable network is one of the most important connectivity infrastructures in the digital era. In the past 20 years, the submarine cable network of Chinese mainland has formed a complex connectivity structure. This paper focuses on exploring the structure and evolution of the submarine cable network of Chinese mainland. The results show that the evolution can be divided into four stages: an initial stage (1993-1998), a developmental stage (1999-2002), a stagnation stage (2003-2015) and an accelerated stage (2016-2018). The connectivity structure can be analyzed at micro, meso and macro scales. Statistically, the connectivity increased significantly overall, but showed significant differences in space. For the microscale, the landing cities were characterized by “extensive but low, exclusive and high”; for the mesoscale, the connectivity of countries or regions was characterized by “distance attenuation” as a whole, but, in part, by a “regional identity”; for the macroscale, intercontinental connectivity differences have been declining. The hierarchy has been upgraded from a “3 system” to a “2 + 3 system”. Finally, this paper discusses the interaction between submarine cable network construction and international relations, and puts forward policy suggestions for China’s submarine cable construction.

Cite this article

XIE Yongshun , WANG Chengjin , HUANG Jie . Structure and evolution of the submarine cable network of Chinese mainland[J]. Journal of Geographical Sciences, 2022 , 32(5) : 932 -956 . DOI: 10.1007/s11442-022-1979-4

1 Introduction

The Internet is neither located in “clouds,” nor does it rely on the increasing number of satellites placed into orbit. On the contrary, the functioning of the Internet and all transoceanic digital communications is based on fiber-optic cables lying at the bottom of the oceans and seas. The global submarine cable network, consisting of approximately 450 submarine cable systems, 1.2 million kilometers of submarine cable, and handling 99 percent of international data traffic, is the backbone of the physical infrastructure of the global Internet, as well as the most important information transmission medium in the world, currently and for the foreseeable future (Nakamoto et al., 2009). Therefore, an understanding of the connectivity and spatial structure of the submarine cable network is conducive to analyzing the carrying, pulling or restricting role of information resources flow among countries.
As for China, the construction of the submarine cable is driven by demand and policies1(1 China’s Digital Silk Road Initiative, China’s Belt and Road Initiative (BRI), Marine Potestatem Strategy, and the 13th Five-Year Plan (FYP) on China’s National Informatization (2016-2020) all put forward specific requirements for planning and constructing intercontinental submarine optical cable project and improving the level of international communication interconnection.) (Ye et al., 2018). On the one hand, the construction of submarine cable is affected by government policies. Before 1875, China’s government strongly opposed the telecommunication technology such as submarine cable because of the great fear of being affected by foreign countries (Headrick, 1991). But now, a series of national strategies and policies have been put forward, such as the Digital Silk Road Strategy and the Marine Potestatem Strategy, to encourage and promote the construction and development of international submarine optical cable network. On the other hand, the rapid development of ICTs industry puts forward higher requirements for submarine cable network construction. In recent years, cloud computing, Internet of things, big data, mobile Internet and other services show an explosive growth trend, driving the explosive growth of data and broadband, which requires the support of submarine cable network with larger capacity and faster transmission (Saunavaara and Salminen, 2020). The role played by submarine cable is becoming more and more important in China. It has become the cornerstone of national economic development and has been attached great importance by the government and investors.
The first international submarine cable system, invested in by China, was completed and came into use in December 1993. In the subsequent 25 years, the number of submarine cable systems worldwide has been increasing, the capacity of submarine cable systems has been improving, the number of connected countries and cities has been increasing, and undersea communications capacity has reached a new height (Ye et al., 2018). An international submarine cable network has been established, which consists of multiple submarine cable systems, multiple landing stations and multiple operators.
Against a background of the submarine cable network of China becoming more and more mature and complex, what kind of connectivity pattern, what kind of system structure, and what kind of evolution characteristics does Chinese mainland present in the world? This aspect needs to be addressed scientifically from the perspective of academic transformation. Although plenty of researches have paid attentions to the design of submarine cable system, the researches on the structure of the submarine cable network, especially about China, cannot be provided. To fill this gap, this paper constructs a submarine cable network of Chinese mainland, and analyzes its structure and evolution characteristics.
The remainder of this paper is organized as follows. In Section 2, literature review is presented. Section 3 introduces the data and methodology. Section 4 presents the evolution stages of the submarine cable network. Section 5 presents the spatial distribution of the submarine cable network from two aspects: submarine cable lines and landing stations. Section 6 presents the connectivity structure of the submarine cable network, which is carried out from three scales: micro, meso and macro. Section 7 abstracts and refines the system patterns of the submarine cable network. Section 8 concludes, and puts forward some suggestions for the planning and construction of China’s submarine cable network.

2 Literature review

At present, research on the submarine cable network focuses mainly on the field of communication engineering, such as the design of submarine cable networks (Audo et al., 2011; Garrett, 2018) and the transmission efficiency of submarine cable networks (Downie, 2018; Tamura and Sakuma, 2018). Based on an understanding of the structure of the submarine cable system and networks, a large number of researchers have begun to view the submarine cable network as a topological network for research purposes, and have raised concerns about its survivability (Cao et al., 2013), reliability (Fan et al., 2014) and vulnerability (Cao, 2012); also the optimization of submarine cable routes has been examined (Msongaleli et al., 2016). These studies usually take advantage of complex network theory and methods to consider changes in the network topology in the event of disasters or deliberate attacks and usually include verification of the changes through simulation.
However, the submarine cable network is not only a topological network given that, spatiality is a key property (Malecki and Wei, 2009; Furlong, 2021). In terms of space, the submarine cable network is an important carrier and channel for information transmission between different regions. It is a large-scale connectivity infrastructure with clear geographic elements, characteristics and issues (Matthew, 2007; Saunavaara and Salminen, 2020). In the mid-1990s, the submarine intercontinental cable network is rapidly taking root and expanding, which is regarded as a new and invisible infrastructure (Blum, 2012). By the beginning of the 2000s, the submarine optical cable is regarded as a kind of widely distributed infrastructure, and it is paid attention to as much as railway and electricity (Edwards et al., 2009). With the rapid growth of submarine cable in the past decades, the imbalance of its spatial distribution has recently received attention (Furlong, 2021).
American geographer Rodrigue (2020) divides transportation modes into six categories: road transportation, rail transportation and pipelines, maritime transportation, air transportation, intermodal transportation, and telecommunication. Among them, submarine cable is the main carrier of communication transmission. Rodrigue (2020) regards the submarine cable as a new type of transportation content produced in the post Fordism era. He also criticizes the view that telecommunication transmission does not have physical characteristics. Malecki and Wei (2009) also believe that the submarine cable not only has the characteristics of communication, but also has the characteristics of transportation. Therefore, the submarine cable network fits well into the discipline of transport geography, and also represents a new field for development of transport geography.
Therefore, we can also broaden the research perspective to the field of transportation. We can find that in the field of transportation geography, the research on the spatial pattern of large-scale connectivity infrastructure network has been relatively mature and formed a certain paradigm. The main research in this field involves highways (Weber, 2012; Weber, 2017), railways (Jiao et al., 2017; Xu et al., 2018; Hu et al., 2019) and distribution pipelines (Chedida and Kobroslya, 2007; Tavana et al., 2012), which share similar characteristics with submarine cable networks. Moreover, the national telecommunication backbone network has gradually become valued by geographers (Grubesic et al., 2003; Murray et al., 2007; Kim, 2012), but to date, few researchers have studied the submarine cable network from the geography perspective.
Given that the submarine cable network connects the world as a whole, the human social system and economic structures have been reorganized as a result of the informatization technology revolution (Graham and Marvin, 1996; Baris and Lu, 2000). Therefore, the virtual network of information flow, rather than the physical network of facilities, has become a priority issue for some geographers. From the perspective of information element flow, Graham (1999) and Malecki (2002) have explored successively the relationships between international information exchange and world urban system, and in so doing, have laid a foundation for the development of information geography. Since then, with the advent of the era of big data, the availability of data on information flow on the Internet has resulted in unprecedentedly improvements. Geographical research on the network information space has been highly productive, including the spatial form, the spatial effect and even tourism information flow (Lin et al., 2007; Zhen et al., 2009; Chen et al., 2012; Wang et al., 2016). Castells (1996) proposed the concept of “space of flows” and believed that the infrastructure, which can integrate the world’s electronic communications networks, is the primary requirement for constituting the “space of flows”. Although recent studies have often emphasized the importance of connectivity infrastructure such as the Internet (Abramson, 2000; Townsend, 2001; Wang and Ning, 2004), few studies have been based on such “connectivity infrastructure” issues. Submarine cable network constitutes the most important information flow carrier and infrastructure in the digital era, especially for intercontinental flows. Therefore, it is necessary for research in information geography to address the physical nature of the network and explore the pattern of the submarine cable network.
To sum up, scholars in the field of communication engineering prefer to explore the specific technology of submarine optical cable, and scholars in the field of geography prefer information geography under the “digital turn”, few literatures regarding submarine cable network as infrastructure and studying its spatial structure. However, as an interdisciplinary field of communication and transportation, the spatial analysis of submarine optical cable network can refer to some theories and methods of infrastructure network.

3 Data and methodology

3.1 Data

We set out to assemble a database of submarine cables. The data are mainly from the reports and maps of TeleGeography. Our main purpose is to construct a submarine cable network and measure its connectivity. Considering these requirements, we collect data mainly from landing points, landing lines and system capacity (potential/total full capacity is considered).
It should be stated that the submarine cable network of Chinese mainland is not a complete submarine cable network, but part of the global submarine cable network, consisting of all the submarine cable systems arriving in Chinese mainland. Based on this situation, 13 international submarine cable systems were selected as the research object (Figure 1 and Table 1), the landing stations being at Qingdao, Shantou, Chongming, Nanhui and Ngwe Saung, respectively. Although the AAE-1 system landed first in Ngwe Saung, Myanmar, it directly connects with China through the China-Myanmar international fiber optic cable system (CMI project), and the service object is still Chinese mainland. This system is also the first overseas submarine cable system built by China Unicom and having its own landing station, so the AAE-1 system belongs to the research consortium of the submarine cable network of Chinese mainland. Accordingly, the research scope of this paper involves 39 landing countries or regions (including Hong Kong, China; Macao, China; and Taiwan, China) and 78 landing cities. Besides, these are divided into 8 regions, namely, East Asia, Southeast Asia, South Asia, West Asia, Africa, West Europe, North America and Oceania (Table 2). When analyzing the evolution stages of the submarine cable network, to fully demonstrate the development characteristics of the submarine cable in Chinese mainland, a long-term time series from 1993-2018 was selected. Also by comparing the evolution characteristics of the submarine cable network and from consideration of the scale and differences of the network, the cross-section analyses of the networks in 2008 and 2018 were selected for comparative purposes.
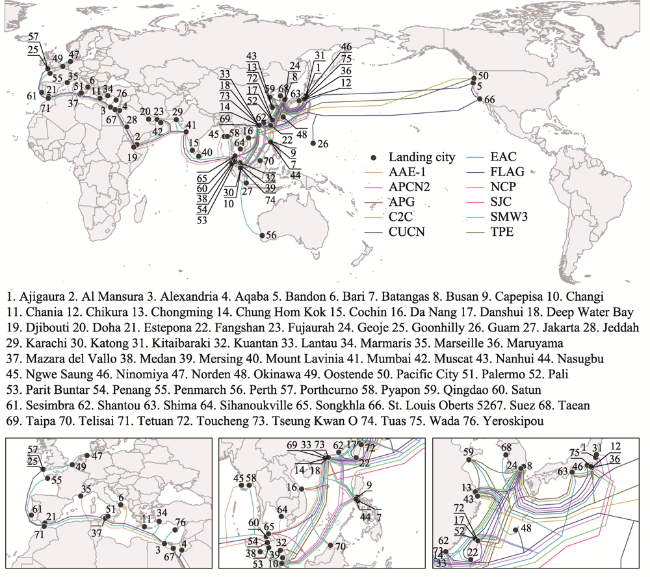
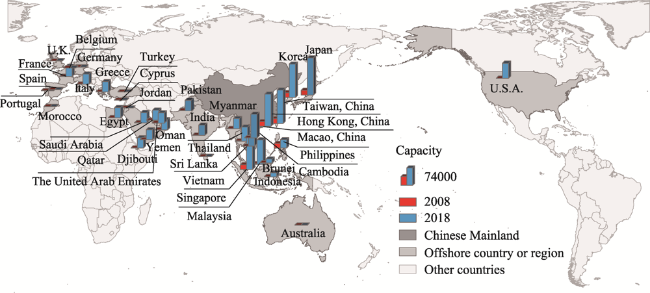
Figure 1 Spatial distribution of submarine cable systems landing in Chinese mainland
Table 1 Major international submarine cable systems landing in Chinese mainland
No. System Code Bandwidth capacity Length
(km)
Completed time Remarks
1 China-Japan Fiber-Optic Submarine Cable System C-J 560 Mbps 1,252 Dec-1993 Abandoned in 2006
2 China-Korea Fiber-Optic Submarine Cable System C-K 1120 Mbps 549 Feb-1996 Abandoned in 2005
3 FLAG Europe Asia FLAG 10 Gbps 27,000 Sep-1997 In service
4 South-East Asia-Middle East-West Europe 3 SMW3 960 Gbps 39,000 1999 In service
5 China-US Cable Network CUCN 80 Gbps 30,800 Jan-2000 Abandoned in 2016
6 Asia Pacific Cable Network 2 APCN2 2.56 Tbps 19,000 Dec-2000 In service
7 East Asia Crossing EAC 2.56 Tbps 19,850 Jan-2002 In service
8 City-to-City Cable System C2C 7.68 Tbps 17,000 Aug-2002 In service
9 Trans-Pacific Express TPE 5.12 Tbps 17,700 Sep-2008 In service
10 South-East Asia Japan Cable System SJC 15 Tbps 10,700 Feb-2013 In service
11 Asia Pacific Gateway APG 54 Tbps 10,400 2016 In service
12 Asia-Africa-Europe-1 Cable System AAE-1 40 Tbps 25,000 2017 In service
13 New Crossing-Pacific Cable System NCP 60 Tbps 13,618 2018 In service
Table 2 Countries and cities in this research
Region Countries or regions Cities
East Asia Hong Kong, Macao, Taiwan, Japan, Korea Chung Hom Kok, Tseung Kwan O, Lantau, Deep Water Bay, Taipa, Fangshan, Toucheng, Danshui, Pali, Chikura, Shima, Okinawa, Ajigaura, Kitaibaraki, Wada, Ninomiya, Maruyama, Busan, Geoje, Taean
Southeast Asia Cambodia, Brunei, Indonesia, Myanmar, Malaysia, Philippines, Singapore, Vietnam, Thailand Sihanoukville, Jakarta, Telisai, Tungku, Kuantan, Medan, Pyapon, Da Nang, Batangas, Parit Buntar, Mersing, Nasugbu, Capepisa, Changi, Tuas, Mumbai, Satun, Songkhla, Katong, Penang, Ngwe Saung
South Asia Sri Lanka, Pakistan, India Mount Lavinia, Karachi, Cochin
West Asia Jordan, Cyprus, Qatar, Turkey, Yemen, Oman, The United Arab Emirates, Saudi Arabia Aqaba, Yeroskipou, Doha, Muscat, Marmaris, Fujaurah, Jeddah, Fujairah, Al Mansura
Africa Djibouti, Egypt Djibouti, Alexandria, Suez
Europe Spain, Belgium, Germany, Morocco, Portugal, UK, France, Greece, Italy Chania, Bari, Estepona, Goonhilly, Marseille, Penmarch, Mazara del Vallo, Palermo, Norden, Oostende, Porthcurno, Sesimbra, Tetuan
North America United States Bandon, Guam, Pacific City, St.Louis Oberts
Oceania Australia Perth

3.2 Analytical framework

This study adopts a typical empirical methodology, focusing on induction, summary and explanation. Therefore, we write on the basis of “process-structure-pattern-mechanism”, and build the following analytical framework (Figure 2). Firstly, we set up the submarine cable attribute database of Chinese mainland, and analyze the evolution process. Secondly, we analyze the network structure characteristics of submarine cable network, in order of microscale, mesoscale and macroscale. Thirdly, we summarize the organization pattern of submarine cable network. Finally, we explore the correlation mechanism of the submarine cable network, and put forward some concrete policy recommendations for the construction of submarine cable network of Chinese mainland.
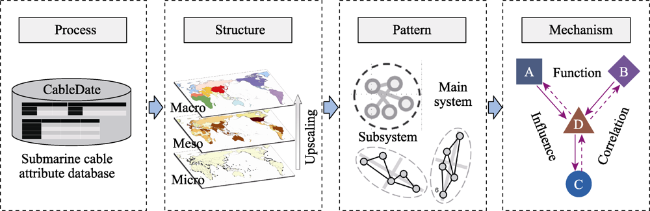
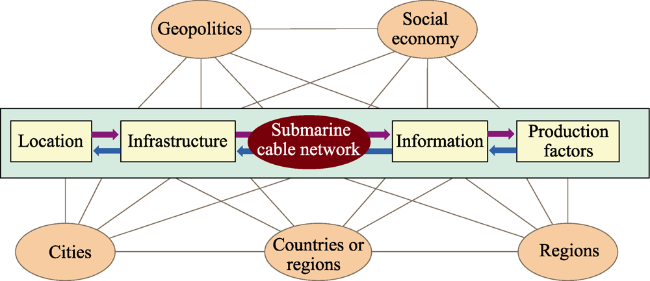
Figure 2 Analytical framework

3.3 Methods

3.3.1 Construction of the submarine cable network

The construction of submarine cable network refers to the graph theory, and methods of other transportation network’s construction. We abstract the submarine cable network as a topological network composed of nodes and edges. The node set (V= {vi: i =1, 2, …, n}) is defined as the landing stations (vi); the edge set (E= {ei: i =1, 2, …, m}) is the node-pairs with optical cable lines directly between nodes (ei); the weight of each edge (W= {wij: i =1, 2, …, n}) is determined by the capacity (potential capacity) of the submarine cable system. Given that this paper is concerned with the submarine cable network of Chinese mainland, the connections between overseas landing stations may be only part of their actual connection. Therefore, only the network connections between the landing stations in Chinese mainland and the overseas landing stations are explored. On this basis, an undirected direct adjacency matrix A between cities was constructed, where i represents the number of landing cities in Chinese mainland, with a maximum of 5 and j represents the number of landing cities overseas, with a maximum of 73. In particular, except for the two landing stations of Chongming and Nanhui in Shanghai, more landing stations than one in one city are considered as one node, and they are combined to provide one entry for each city. In other words, each node in this study represents a city rather than a landing station.
$A=\left[ \begin{matrix} {{a}_{11}} & {{a}_{12}} & \cdots & {{a}_{1j}} \\ {{a}_{21}} & {{a}_{22}} & \cdots & {{a}_{2j}} \\ \vdots & \vdots & \vdots & \vdots \\ {{a}_{i1}} & {{a}_{i2}} & \cdots & {{a}_{ij}} \\\end{matrix} \right]$

3.3.2 Network connectivity

Connectivity is an important index to evaluate the transportation network. Evaluation of the connectivity of a submarine cable network can effectively reflect the accessibility of the information transmission networks between countries or regions. The connectivity of a submarine cable network is determined by the total full capacity of the submarine cable system. The larger the capacity, the stronger is the connectivity between nodes. If there are n submarine cable systems connecting city i and city j, then the connectivity between the landing city i in Chinese mainland and the overseas landing city j (${{a}_{ij}}$) can be written as follows:
${{a}_{ij}}={{C}_{1}}+{{C}_{2}}+\cdots +{{C}_{n}}$
where C is the capacity of submarine cable system.
Similarly, the connectivity of the submarine cable network between Chinese mainland and overseas countries or regions (${{b}_{j}}$) can be written as follows:
${{b}_{j}}={{C}_{1}}+{{C}_{2}}+\cdots +{{C}_{n}}$
If Ai is the connectivity index of city i, Aj is the connectivity index of city j, and Bj is the connectivity index of country or region j, then:
${{A}_{i}}=\sum\limits_{j=1}^{n}{{{a}_{ij}},(\text{i}=1,2,\cdots,\text{n})}$
${{A}_{j}}=\sum\limits_{i=1}^{n}{{{a}_{ij}},(\text{j}=1,2,\cdots,\text{n})}$
${{B}_{j}}={{b}_{j}}$

4 Evolution stages of the submarine cable network

In 1993, Chinese mainland’s first submarine cable was officially opened. Since then, the number of connected cities, countries or regions and the total capacity of the submarine cable system have shown increasing trends. However, the evolution of the different variables presents different upward trajectories (Figure 3). Among them, the growth rate of the numbers of connected cities and countries or regions was at first fast and then slowed down. The number of connected cities is about twice the number of connected countries or regions, and the number of connected cities is more volatile. The reason for this phenomenon was that multiple cities within a single country or region may simultaneously have become landing stations for a certain submarine cable system. Therefore, once a submarine cable system is added or fails, the impact on the number of cities will be greater.
Figure 3 Development of the submarine cable systems landing in Chinese mainland
According to the growth trend of the total capacity of submarine cable system, an exponential growth was shown. The growth rate of the total capacity of submarine cable system is fast first and then slows down. However, it would be a mistake to conclude that the development speed of capacity in the early stage lags behind that in the later stage. The reason is that this kind of growth trend follows what is known as “Keck’s Law” (Hecht, 2016). Like “Moore’s Law” for semiconductors, Keck’s Law predicts the capacity of optical fibers over time and shows an exponential growth as the technologies used for transmission evolve. Therefore, we show a log scale for capacity in Figure 3, where the base number of logarithmic function is set as e, the antilogarithm is set as the total capacity, and the coefficient is set as α=6.2. We find that the change of the αLnCapacity follows the logarithmic trend, which proves Keck’s Law. It is indicated that we need to combine the development of optical fiber technology to estimate the total landing capacity of Chinese mainland. On this basis, according to the specific evolution process, the development of the submarine cable network of Chinese mainland can be divided into four stages.

4.1 Initial stage

The period from 1993 to 1998 is regarded as the initial stage in the evolution of the submarine cable network of Chinese mainland. Generally speaking, the breadth and depth of the connectivity have developed to a certain extent. The main reason behind this is the policy2(In 1988, Li Peng, then Premier of the State Council of China, put forward the policy of “vigorously promoting the application of optical fiber communication in China”.) demand of China’s urgent participation in global communication network connection.
Specifically, during this period, the submarine cable network of Chinese mainland commenced and a total of three submarine cable systems were established. The connecting cities and countries or regions have evolved from zero to many. By 1998, there were 20 overseas cities and 12 countries or regions directly connected with the Chinese mainland, with growth rates of 3.33 per year and 2 per year, respectively, and connecting 6 regions including East Asia, South Asia, Southeast Asia, West Asia, Africa and Europe. From the overall evolution of capacity development, the capacity growth in this stage is very insignificant, being only at the Gbps level. Although the total capacity is poor from the current level, according to the above mentioned Keck’s Law, the connectivity depth has been well developed under the technology at that time. In fact, significant progress was made in optical fiber technology during this period, including the application of synchronous digital transmission system (SDH), erbium-doped fiber amplifier (EDFA), and G.653 dispersion shifted fiber (DSF), which promoted the rapid development of submarine cable technology (Ye, 2006). Therefore, the total capacity conforms the expected rise driven by technology.

4.2 Developmental stage

The period from 1999 to 2002 is regarded as the developmental stage in the evolution of the submarine cable network of Chinese mainland. The breadth and depth of the connectivity were still developing rapidly. The main reason behind this is the emergence of global demand for data traffic, and the rapid improvement of optical fiber technology.
Specifically, during this period, five new submarine cable systems were landed in Chinese mainland, and by the end of 2002, eight submarine cable systems were used simultaneously. The number of connected cities and countries or regions increased rapidly. A total of 50 new overseas cities and 22 new countries or regions were added, with growth rates of 12.5 per year and 5.5 per year, respectively. Meanwhile, North America and Oceania were newly connected, realizing the direct connection of 8 regions. In terms of connectivity capacity, the total capacity at the end of this stage is close to 20,000 Gbps. Nevertheless, it is still negligible in the overall trend of capacity evolution. From the logarithmic curve change of the capacity, however, it presents a sharp rise. It is indicated that the submarine optical cable transmission technology has made significant progress in this stage. Specifically, in this stage, with the application of dense wavelength division multiplexing (DWDM), G.655 non-zero dispersion fiber, and forward error correction (FEC) (Ye, 2006), the capacity of the submarine cable system in Chinese mainland developed rapidly to the TBPs level after a short period at the 100 Gbps level.

4.3 Stagnation stage

The period from 2003 to 2015 is regarded as the stagnation stage in the evolution of the submarine cable network of Chinese mainland. The expansion of the connectivity breadth stalled, and the improvement of connectivity depth was slow. The main reason behind this is the stagnation of the submarine cable construction and the stagnation of technological innovation. Chinese mainland has basically integrated into the global submarine communication network through the construction of the previous submarine cable, which has reduced the urgency of the new system construction. Meanwhile, the excessive construction in the early stage has produced lots of redundant broadband, which needs to be gradually digested at this stage, resulting in the reduction of the demand for the growth of submarine cable capacity.
Specifically, during this period, only two new submarine cable systems were landed in Chinese mainland. Meanwhile, the two earliest submarine cable systems were abandoned. The number of connected countries or regions did not change, and the number of connected overseas cities remained stable after a small fluctuation; overall, the spatial expansion of the connectivity breadth was at a stagnation stage. In terms of connectivity capacity, the capacity of the abandoned submarine cable systems was only at the Mbps level, while the capacity of the new submarine cable systems was not extensively developed, being still at the Tbps level, so the total capacity increased but not significantly. From the logarithmic curve change of capacity, we can also find that the growth trend in this period has slowed down significantly.

4.4 Accelerated stage

The period from 2016 to 2018 is regarded as the accelerated stage in the evolution of the submarine cable network of Chinese mainland. Generally speaking, renewal and acceleration were the themes. On the one hand, some old submarine cable systems are out of service, and some new systems are involved in the network, which leads to a small fluctuation in the connectivity breadth. The reason for this phenomenon is the service life of submarine optical cables: given a typical lifespan for a submarine cable system of 17-20 years, the submarine cable systems constructed before 2000 were gradually approaching the end of service life, therefore, replacement of the old systems with new ones was necessary. On the other hand, the connectivity depth experienced a rapid increase. This is because the rapid development of ICTs industry in recent years put forward a higher demand for large-broadband and large-capacity of the Internet, promoting the submarine cable capacity to upgrade again.
Specifically, during this period, three new submarine cable systems were landed in Chinese mainland, and one old submarine cable system was abandoned. By the end of 2018, ten submarine cable systems were used simultaneously. The connectivity breadth expanded slightly, six new overseas cities and four new countries or regions added to the network; the growth rates were 2 per year and 1.33 per year, respectively. In terms of connectivity capacity, the capacity of new submarine cable system was upgraded to dozens of Tbps. By the end of 2018, the total capacity has exceeded 180,000 Gbps. The logarithm of capacity also showed a significant upward trend, indicating that the technology has risen to a new level at this stage.

5 Connectivity structure of the submarine cable network

Connectivity is an important index for evaluation of a transportation network. The evaluation of a submarine cable network can effectively reflect the capacity of information transmission between regions. Research on the connectivity structure of the submarine cable network of Chinese mainland needs to be carried out on three different scales of connectivity, namely, connectivity between landing cities at the microscale, connectivity between landing countries or regions at the mesoscale and connectivity between regions at the macroscale.

5.1 Microscale: cities

The 78 landing cities mentioned above are the research samples. In accord with equations (2) and (4), the connectivity between overseas landing cities and the landing cities in Chinese mainland in 2008 and 2018, as well as the connectivity index of each landing city, have been calculated respectively. From the results obtained, on the whole, the connectivity had increased exponentially, whereas the internal differences were more significant. Specifically, in 2008, the maximum connectivity value was 7,680, the minimum value was 10, and the average value was 1799, of which 42 pairs of connections were higher than the average value, accounting for 31.82% of the total (132). Moreover, the coefficient of variation was 1.12. By 2018, the maximum connectivity value was 121,690, more than 15 times that of 2008, the minimum value was still 10, and the average value was 15,730, more than 8 times that of 2008, of which 47 pairs of connections were higher than the average value, accounting for 29.75% of the total (158). Moreover, the coefficient of variation increased to 1.62.
In terms of space, the connectivity preferences of landing cities in Chinese mainland were different, revealing the characteristics of “extensive but low, exclusive and high” (Figure 4). Specifically, in 2008, Chongming and Shantou had the largest number of connected cities, with 49 and 47 cities, respectively, covering all 8 regions; Nanhui connected 25 cities, covering 6 regions; Qingdao connected 11 cities, only involving 3 regions. However, in terms of the average connectivity with overseas landing cities, Qingdao was the highest, reaching 3491; Nanhui was second with 2464; Chongming and Shantou were the lowest with only 1611 and 1244, both lower than the overall average. These findings indicated the connectivity features of “extensive but low, exclusive and high” for the period 2008: Chongming and Shantou had the most extensive connections with overseas landing cities and areas, whereas the connectivity was the lowest; Nanhui was the main landing city connecting South Asia, West Asia, Africa and Europe with high connectivity; Qingdao’s main function was to connect just one region, namely, North America, but its connectivity was the highest. By 2018, Chongming and Shantou still had the largest number of connected cities, with 49 and 48 cities, respectively; Nanhui connected 30 cities, increasing the connection with North American cities; Ngwe Saung, the new landing city, connected 20 cities, mainly in South Asia, West Asia, Africa and Europe; and the connectivity for Qingdao did not change. However, in terms of the average connectivity with overseas landing cities, the connectivity structure did change significantly. Qingdao and Shantou were the lowest, representing only 22.19% and 21.59% of the overall average, respectively; Chongming was 15,314, but still lower than the overall average; Nanhui was higher at 24,454, nearly 10 times that of 2008, but still in the second place; Ngwe Saung was the highest, with an average of 40,000. This indicated that the relative characteristics of “extensive but low, exclusive and high” still existed in this period, but due to the differences of development, this feature was manifested in two different hierarchies: the first hierarchy consisted of Ngwe Saung, Nanhui and Chongming. Although Nanhui and Chongming had the most extensive connections with overseas landing cities and areas, the connectivity was not particularly high. On the contrary, as the main landing cities in South Asia, West Asia, Africa and Europe in the new era, Ngwe Saung had the highest connectivity. The second hierarchy consisted of Qingdao and Shantou. Although Shantou was still one of the most connected landing cities, its average connectivity had also increased, but was still lower than Qingdao. In addition, it is worth mentioning that although the main function of Qingdao was still to connect North American cities, in the overall network, the key city in Chinese mainland for connection to North American cities became Shanghai Nanhui.
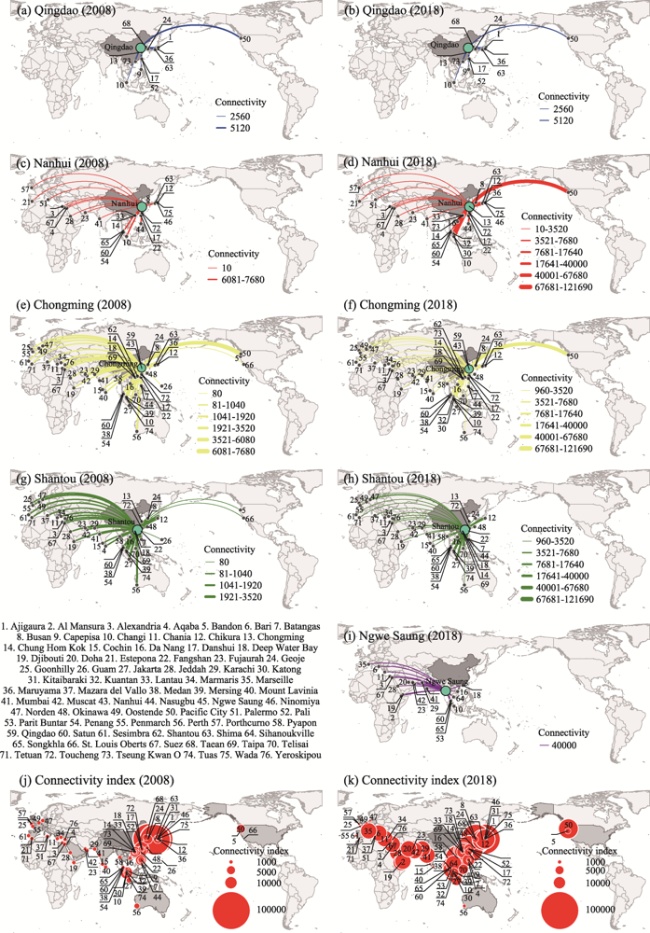
Figure 4 Connectivity structure of landing cities
As for the connectivity index, the connectivity index increased significantly overall, while the internal differences decreased. Specifically, in 2008, the maximum value of the connectivity index was 64,330, the minimum value was 10 and the average was 4931. Only 11 cities had values higher than the average value, accounting for 16.92% of the total (65). Moreover, the coefficient of variation was 2.70, showing that the internal differences in connectivity were significant. By 2018, the maximum connectivity index was 139,240, about twice that of 2008, while the average increased to 25,689, more than 5 times that of 2008, of which 29 cities were higher than the average value, accounting for 41.43 % of the total (70). Moreover, the coefficient of variation decreased to 1.23, indicating that the differences in the connectivity indexed among landing cities decreased, and the degree of dispersion was reduced relative to 2008.
From the perspective of space, in 2008, the cities with a high connectivity index were concentrated mainly in East Asia, with 8 of the top 10 cities being in East Asia, among which Busan in South Korea, Chikura and Shima in Japan were the most prominent. The connectivity indexed of landing cities in South Asia, West Asia, Africa, Europe and Oceania were very low, while the connectivity indexed of landing cities in Southeast Asia and North America were slightly higher. By 2018, most of the landing cities in East Asia, Southeast Asia and North America had a high connectivity index, and the polarization phenomenon of some cities had disappeared. At the same time, the connectivity indexes of some cities in West Asia, Africa and Europe had increased significantly, narrowing the gap with East Asia. However, the connectivity indexes of many landing cities remained almost unchanged, especially in Europe and Oceania.

5.2 Mesoscale: countries or regions

The ultimate purpose of connectivity between sites is to realize the connectivity between countries. Through integration of multiple landing cities in the same country or region, the connectivity and connectivity index between each landing country or region and Chinese mainland have been calculated.
In Figure 5, it can be seen that the level of connectivity varies greatly in space. Only a few countries or regions in East Asia and Southeast Asia have a high level of connectivity, and the growth rate of each country or region is significantly different between 2008 and 2018, reflecting a clear “Matthew effect”. To further explore the internal laws governing connectivity, the connectivity between each landing country or region and Chinese mainland has been ranked, and the rank-size distribution diagram is presented in Figure 6. From observation of the fitting effect, due to the existence of clear bifurcations and turning points, it is difficult to fit the connectivity rank-size scatter diagram to a straight line or curve; however, each line segment divided by the turning points shows a high degree of fitting (R2 > 0.95). This indicates that there are multiple non-scale areas with the rank-size distribution between the landing countries or regions and Chinese mainland, which show multi-fractal structure and hierarchical phenomena. Specifically, for 2008, there was a two-fractal structure with 2 non-scale areas. The first non-scale area was composed of 6 countries or regions, including Taiwan (China), Japan, South Korea, Hong Kong (China) and Singapore, accounting for 80% of the total, with a fitting coefficient of 13.48. This indicates that the connectivity capacity of the submarine cable network of Chinese mainland was highly concentrated in these countries or regions. The second non-scale area consisted of 28 countries or regions, however, its only accounted for 20% of the total, mainly consisting of countries in South Asia, West Asia, Africa and Europe. For 2018, there was a three-fractal structure with 3 non- scale areas. The first non-scale area was composed of 7 countries or regions, including Japan, South Korea, Taiwan (China), Hong Kong (China), Singapore, Malaysia and Vietnam, accounting for 54% of the total, with a fitting coefficient of 7.61. This finding indicated that the connectivity capacity of the submarine cable network of Chinese mainland was still concentrated in those few countries or regions, but compared with 2008, the concentration decreased significantly. The second non-scale area consisted of 16 countries or regions, consisting mainly of some countries in South Asia, West Asia, Africa, Europe and North America, accounting for 53% of the total, significantly higher than that in 2008. The fitting coefficient of the third non-scale area was only 0.05, and this area consisted of 13 countries or regions, most of which were connected before 2008, and the connectivity did not improve in more recent times.
Figure 5 Connectivity structure of landing countries or regions
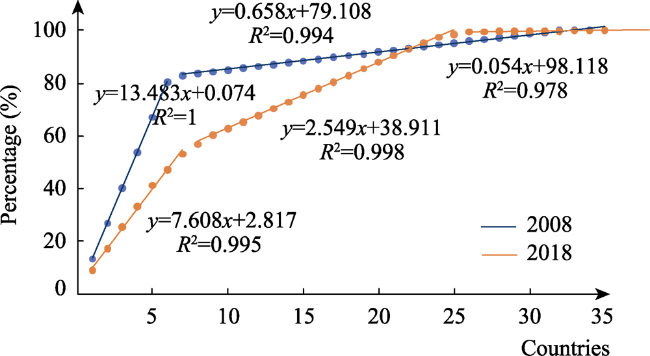
Figure 6 Connectivity rank-size distribution of each country or region with Chinese mainland
The connectivity of landing countries or regions is related to the distance factor. According to the route and the length of the submarine cable, the connecting distance of the submarine cable from overseas landing countries or regions to Chinese mainland has been calculated. Next, the average connectivity within successive distance intervals of 1,000 km was calculated to allow a plot of connectivity versus connectivity distance as shown in Figure 7. It can be seen that the connectivity decreases with the increase of the connection distance, and remains unchanged for a certain distance. According to the above-mentioned connectivity structure diagram and the multi-fractal structure of rank-size, it can be concluded that the connectivity of countries or regions can be described, on the whole, by the feature of “distance attenuation”, and in part by “regional identity”. Specifically, in 2008, the average connectivity of each country or region gradually decreased for the range 0-6000 km, and this corresponded to the first non-scale area of the rank-size distribution. For example, East Asia and Southeast Asia in Figure 5 showed the feature of “distance attenuation”; the average connectivity for the range 6000-7000 km was reduced to the lowest level, and there has been little change since then, this corresponded to the second non-scale area, and with West Asia, Europe and other regions in the Figure 5 showed the feature of “regional identity”. In 2018, the average connectivity in the range 0-6000 km was similar to that in 2008, but the reduction is larger, indicating that the “distance attenuation” feature was more significant; for the range 6000-15,000 km, the average connectivity was maintained at about 40,000, which corresponded to the second non-scale area of the rank-size distribution. It can be found from Figure 5 that this is manifested by the feature of “regional identity” in South Asia, West Asia, Africa and European landing countries; the average connectivity for 15,000-16,000 km has been reduced to the lowest level, and there has been little change since then; this range corresponded to the third non-scale area.
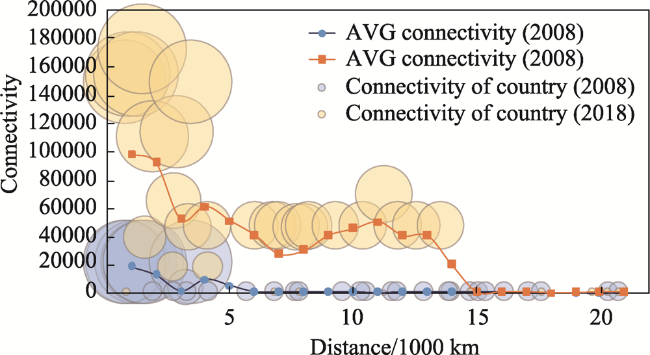
Figure 7 The relationship between connectivity level and distance of each country or region

5.3 Macroscale: regions

From the mesoscale analysis, it was found that the connectivity between neighboring countries or regions displayed the characteristics of “regional identity”. Therefore, it was necessary to further explore the network connectivity structure among regions. Table 3 shows that the overall connectivity structure of 8 regions has not changed significantly from 2008 to 2018. East Asia has the highest connectivity, followed by Southeast Asia; North America ranks third and Oceania has the lowest connectivity. The connectivity of South Asia, West Asia, Africa and Europe has remained relatively constant, which further supports the conclusion of “regional identity” mentioned above. In terms of the increased range, the average connectivity increased from 5348 in 2008 to 67,578 in 2018, with an increase of 1164%. Among the regions, South Asia, West Asia, Africa and Europe saw the largest increase, with a growth rate of 4124%. North America was second, with an increase of 1152%. The growth rates for East Asia and Southeast Asia were relatively low, being 890% and 792%, respectively. This shows that the regions with lower connectivity were more significant with respect to the extent of improvement, and the results may lead to a reduction of internal differences between these regions. Therefore, we further analyzed the coefficient of variation, and found that the value decreased from 1.24 in 2008 to 0.82 in 2018, indicating that the connectivity difference of the submarine cable network on the macroscale had decreased. In addition, it is worth noting that the connectivity in Oceania has not improved, the region having a growth rate of zero. South America is still not connected at the global level, and this may be a consideration for improving and complementing the submarine cable network of Chinese mainland in the future.
Table 3 Regional connectivity of the submarine cable network of Chinese mainland
2008 2018 Growth rate/*100%
East Asia 18,970 187,890 8.90
Southeast Asia 13,770 122,770 7.92
South Asia 970 40,970 41.24
West Asia 970 40,970 41.24
Africa 970 40,970 41.24
Europe 970 40,970 41.24
North America 5200 65,120 11.52
Oceania 960 960 0
AVG 5348 67,578 11.64
SD 6637 55,674
C.V 1.24 0.82

6 System patterns of the submarine cable network

The spatial distribution of the network reflects the layout of the submarine cable lines and stations, while the network connectivity structure reflects the connectivity level at the different scales. To better understand the organizational model of the network, it is necessary to further condense the system pattern of the submarine cable network of Chinese mainland. A conceptual description of the submarine cable network of Chinese mainland is illustrated in Figure 8. It can be seen that the pattern of the submarine cable network system changed significantly between 2008 and 2018.
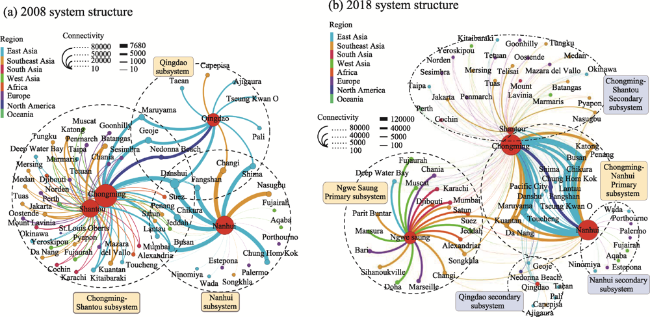
Figure 8 The system pattern of the submarine cable network of Chinese mainland
In 2008, the submarine cable network may be regarded as having a “3 system” pattern consisting of the “Chongming-Shantou subsystem”, the “Nanhui subsystem” and the “Qingdao subsystem”. Among these, the “Chongming-Shantou subsystem” was the main system connecting Europe, Africa, West Asia, South Asia and North America. Chongming and Shantou serve as the dual-core of the system. The connectivity objects and the connectivity level of the dual-core are very similar, and together drive the network connection of 44 overseas landing cities, presenting a “binary star” structure in the subsystem. The “Nanhui subsystem” is the main system connecting Southeast Asia, and the Nanhui landing station is the core, driving the network connection of 25 overseas landing cities. The “Qingdao subsystem” is the main system connecting North America, and the Qingdao landing station is the core, driving the network connection of 11 overseas landing cities. The three subsystems are not separated from each other but intersect each other and are closely related. The overlapping parts of the three subsystems consist mainly of landing sites in East Asia. The Danshui landing station in Taiwan is the most typical one, having a strong connection with the three subsystems.
By 2018, the submarine cable network system pattern underwent generation, differentiation, integration and decline, revealing a “2 + 3 system” pattern consisting of the “Chongming-Nanhui primary subsystem”, the “Ngwe Saung primary subsystem”, the “Chongming-Shantou secondary subsystem”, the “Nanhui secondary subsystem” and the “Qingdao secondary subsystem”. Among them, the “Chongming-Nanhui primary subsystem” was further integrated and developed based on the intersection of the former “Chongming-Shantou subsystem” and the “Nanhui subsystem”. The “Chongming-Nanhui primary subsystem” has become the most important system connecting East Asia, Southeast Asia and North America. Chongming and Nanhui remain the dual-core of the system. The connectivity objects and connectivity level of the dual-core are very similar, the two centers jointly driving the network connection of 19 overseas landing cities, presenting a “symmetrical” structure in the subsystem. The “Ngwe Saung primary subsystem” is the main system connecting Europe, Africa, West Asia and South Asia in the new era. Ngwe Saung in Myanmar is the core of the “Ngwe Saung primary subsystem”. Most of the 20 overseas landing cities driven by this subsystem are mostly differentiated from the former “Chongming-Shantou subsystem”. The “Chongming-Shantou secondary subsystem” is the part left over from the decline of the former “Chongming-Shantou subsystem” and drives the network connection of 24 overseas landing cities. It is a supplementary system connecting Europe, Africa, West Asia and South Asia in the whole submarine cable network. The “Nanhui secondary subsystem” is the part left by the integration of the former “Nanhui subsystem”, driving the network connection of 8 overseas landing cities. It is a supplementary system connecting Europe and West Asia to the whole submarine cable network. The “Qingdao secondary subsystem” is the part left over from the decline of the former “Qingdao subsystem” and drives the network connection of 6 overseas landing cities. It is a supplementary system connecting North America and East Asia to the whole submarine cable network.

7 Correlation mechanism of the submarine cable network

The growth and structural evolution of the submarine cable network of Chinese mainland has complicated relationships with international relations, including socio-economic and geopolitical relations. In order to reveal the complex international relations behind these changes, the correlation mechanism of submarine optical cable network is further discussed in this part.
As shown in Figure 9, on the one hand, the essence of submarine cable network is a large connectivity infrastructure, the spatial layout and connectivity structure are deeply affected by geographical location. On the other hand, the submarine cable network promotes the exchange of information, which further forms close relationships with the flow of various production factors. The chain composed by space-network-flow is reflected on three scales: cities, countries or regions, regions, interacting with international geopolitical and socio- economic ties. These two aspects are discussed as follows.
Figure 9 The correlation mechanism model of submarine cable network

7.1 International communication and the flow of production factors

The process of globalization has shown signs of slowing down in recent years, but the trend of globalization will not change. China is actively promoting a new round of globalization and accelerating exchanges and integration with countries around the world.
In terms of personnel mobility: the number of Chinese mainland entry and exit was 22.3 million in 2008, and the top 10 were Hong Kong (China), Macao (China), Japan, Vietnam, South Korea, Russia, the United States, Singapore, Thailand and Malaysia. By 2018, the number of Chinese mainland entry and exit reached 340 million, 15 times that of 2008, and the top 10 were Hong Kong (China), Macao (China), Thailand, Japan, Vietnam, South Korea, the United States, Taiwan (China), Malaysia and Singapore3(3Annual Report on China’s Inbound and Outbound Tourism Development, 2009, 2019), with little change except Taiwan (China).
In terms of foreign investment: the stock of foreign direct investment in Chinese mainland was 184 billion USD at the end of 2008, and the top 10 were Hong Kong (China), South Africa, British Virgin Islands, Australia, Singapore, Cayman Islands, Macao (China), Kazakhstan, the United States and Russia, Chinese mainland. By 2018, the stock of foreign direct investment in Chinese mainland had reached 1.98 trillion USD, more than 10 times that at the end of 2008. China’s influence in global FDI has been expanding. By the end of 2018, 4,400 Chinese domestic investors had established 37,200 foreign direct investment enterprises abroad, distributed in 190 countries or regions around the world. The concentration of China’s foreign direct investment in countries or regions is still high, mainly flowing to Hong Kong (China), the United States, the Cayman Islands, the British Virgin Islands, Australia, Singapore, Canada, Germany and other countries or regions44Statistical Bulletin of China’s Foreign Direct Investment, 2009, 2019).
In terms of international trade: the total value of imports and exports of Chinese mainland was 2.56 trillion yuan in 2008, and the top 10 countries and regions in the total bilateral trade volume were the European Union, the United States, Japan, ASEAN, Hong Kong (China), South Korea, Taiwan (China), Australia, Russia and India. By 2018, the total value of imports and exports of Chinese mainland was 30 trillion and 510 billion yuan, and it has been ranked first in the world for many years. The European Union, the United States, Japan, South Korea, Taiwan (China), Germany, Australia, Vietnam, Brazil and Malaysia all occupied the seats in the top 10 with a scale of 100 billion dollars5(5 General Administration of Customs of the PRC, 2009, 2019).
From three aspects, personnel, capital and goods, we can see that China’s international exchanges are increasing frequently, and it is closely related to Hong Kong (China), Macao (China), Taiwan (China), the United States, Europe, Japan, South Korea, Southeast Asia and other countries and regions. This is consistent with the changes and development of the Chinese mainland’s submarine cable network’s interconnection level and structure. It can reflect that international exchanges and the flow of production factors affect the development of submarine cable network, and the development of submarine cable network can also promote international exchanges and the flow of production factors. In the coming period, China’s participation in globalization will not change. The flow of production factors will continue to drive the growth of transnational information flow and promote interconnection and the construction of international submarine cable.

7.2 China’s geopolitical advantages and changes in the world geopolitical situation

Submarine cable is an important infrastructure to ensure national information security, which is of great strategic significance. The construction and development of submarine cable network in Chinese mainland is closely related to its own geographical advantages and the geopolitical situation of the world. Chinese mainland has unique geographical advantages in the layout of the world’s submarine cable. This geographical advantage is conducive to China’s participation in the construction of the global submarine cable network. In turn, the deepening and development of the connectivity structure of the submarine cable network in Chinese mainland has also profoundly affected Chinese mainland’s geopolitical structure in the world. Theoretically, this interaction can be explained by Mahan’s thought of sea power. Specifically, China is located at the eastern end of the Eurasian continent, bordering the hinterland of the Eurasian continent in the West and the Pacific Ocean in the East. It has a total of 23 sea and land neighbors, the largest number of neighbors in the world, and has established cross-border land cables (As a way of international communication between land neighbors or landlocked countries, land optical cable is a supplement to submarine optical cable) with 12 land bordering countries in the South, West and North. Meanwhile, a number of large capacity submarine cables connecting Asia Pacific, North America and Europe and Africa have landed on 4 landing stations in Chinese mainland. With the built and future marine and land resources, Chinese mainland can make full use of geographical advantages and create a Eurasian information hub linking the East and West Eurasia. It is estimated that Middle East countries reach the Asia Pacific region through China, which reduces the transit delay by more than 10 times compared with through the United States (CAICT, 2018). All these fully reflect the two-way feedback of the Chinese mainland’s submarine network and the geopolitical structure. The instability of world geopolitical situation and the penetration of national interest game will restrict the construction of submarine cable network of Chinese mainland. In recent years, the United States has deliberately provoked competition topics in many fields such as economy, trade, diplomacy, science and technology. At present, the struggle has been extended to the field of submarine optical cables. For example, the Pacific Light Cable Network (PLCN) originally planned to directly connect Hong Kong (China) and the United States, but the United States repeatedly blocked the connection and operation application of submarine cable under the pretext of national security. Finally, PLCN, which should have landed in Hong Kong (China), became a victim of the geopolitical game. This phenomenon shows that the construction of submarine cable network largely reflects the geographical relations between countries, tense and unstable international geographical relations will restrict the connectivity of submarine cable network. It enlightens us that the future development of submarine cable network in Chinese mainland should emphasize improving China’s geopolitical strategic position.

8 Conclusions and discussions

In the context of globalization, the submarine cable network is an extremely important connectivity infrastructure element, being seen as the “central nerve” of the ocean. It plays an important role in the fields of national defense, telecommunications, the social economy and even energy. There is much literature on the analysis of the spatial structure of similar large-scale connectivity infrastructure networks (Tavana et al., 2012; Hu et al., 2019), yet the literature on the submarine cable network, concerning the connectivity and structure, is limited. Against the backdrop of the “the Belt and Road Initiatives” and the construction of the “Digital Silk Road” (Huang, 2019; Lou, 2019), China is striving to become one of the most important international submarine cable communication centers in the world (Ye et al., 2018). Based on this, our study explored the evolution stages, the connectivity structure, the system pattern and the correlation mechanism of the submarine cable network of Chinese mainland.
There are four main conclusions from this study. Firstly, the submarine cable network has evolved from two dimensions of connectivity breadth and connectivity depth. Priority has been given to expanding the connectivity breadth, enabling Chinese mainland to establish ties with more regions. Also the connectivity depth of the submarine cable has continued to expand, with connections on existing system constantly being improved. According to specific evolution processes, the evolution of the submarine cable network of Chinese mainland can be divided into four stages: an initial stage (1993-1998), a developmental stage (1999-2002), a stagnation stage (2003-2015) and an accelerated stage (2016-2018). Secondly, the connectivity structure can be analyzed at three scales: the micro, the meso and the macro scales. Statistically, the connectivity increased significantly overall, but showed significant differences in space. For the microscale, the landing cities showed different connectivity preferences and were characterized as being “extensive but low, exclusive and high”; for the mesoscale, the connectivity of countries or regions was characterized by “distance attenuation” as a whole, but, in part, by a “regional identity”; for the macroscale, intercontinental connectivity differences have been declining. Thirdly, the hierarchy of the submarine cable network of Chinese mainland has been enhanced, from a “3 system” to a “2 + 3 system”. In the new era, the “Chongming-Nanhui primary subsystem” dominates the connections to East Asia, South Asia and North America, and the “Ngwe Saung primary subsystem” dominates the connections to Europe, Africa, West Asia and South Asia. Lastly, the submarine cable network of Chinese mainland has complicated relationships with socio-economy and geopolitics. The evolution of submarine cable network structure interacts with the development of international socio-economic structure. The superior geographical advantage is conducive to China’s dominant position in the submarine cable network, but we should also be vigilant against the negative impact of international geopolitical fluctuations on the submarine cable construction.
The results have important implications for understanding the connectivity of the submarine cable network of Chinese mainland. Our study suggests that the submarine cable network of Chinese mainland has evolved to a considerable extent, forming a specific organizational pattern, after years of construction and consolidation. However, there are still many blind areas and deficiencies all over the world, such as the lack of connection with South America, and the connectivity of Oceania has not been improved for a long term. Statistically, only 44 of the nearly 200 countries in the world are not able to rely directly on the international submarine cable for communications because they have no coastline. Further, our study shows that, except from Hong Kong, Macao and Taiwan, China connects with only 35 countries, if we do not consider the submarine optical cable system which does not land in Chinese mainland. By the beginning of 2019, there were about 378 submarine cable systems in operation in the world, among which, the number owned by the United States, Japan, the United Kingdom and Singapore was 8, 2, 5 and 2 times that of Chinese mainland, respectively, and the per capita bandwidth was 20, 10, 73 and 265 times, respectively (CAICT, 2018). It can be seen that there is still a large gap between China’s submarine cable network and that of other maritime nations. Meanwhile, given that China’s submarine cable network construction cannot match the exponential boom in digital data within the telecommunications industry, there is still much scope for further developments in the future. To conclude, it can be predicted that, the submarine cable network of Chinese mainland will usher in new rounds of progressive upgrading of the connectivity breadth and connectivity depth, resulting in an upward spiral trend. However, in the following planning and construction of submarine optical cable, the following issues should be paid attention:
i) Continue to give full play to Hong Kong’s submarine cable landing advantages. In our study, Hong Kong is an important node in the submarine cable network of Chinese mainland. In fact, the links between some international companies and Chinese mainland have been restricted for a long time, such as Facebook and Google, and Hong Kong is the transit point for these links. Although there are obstacles in the construction, operation and service of submarine cables in Hong Kong and Chinese mainland, the Hong Kong SAR belongs to the People’s Republic of China and has an inseparable connection with Chinese mainland (CAICT, 2018). In the future, Chinese mainland should take an active part in the construction of submarine cable in Hong Kong, strengthen network connectivity, and optimize communication policy environment, so as to continue to give full play to Hong Kong’s opening-up advantages.
ii) Plan for new submarine cable landing stations. At present, there are only four international landing stations in Chinese mainland, far less than the big powers such as UK, United States and Japan. In the long run, the existing submarine cable landing stations in Chinese mainland cannot meet the needs of the development of Internet business (Liu et al., 2019). It is suggested that the feasible resources of submarine cable landing stations should be demonstrated in advance to form a reserve of submarine cable landing station sites and reserve international submarine cable routing channels. Considering the network resilience, the location of the newly planned landing stations should exclude Shanghai, Qingdao and Shantou, that will help to reduce the risk of network collapse caused by the failure of the landing stations.
iii) Cooperate and co-construct with the important fulcrum countries. In terms of geographical location, Chinese mainland connect with only 35 countries, if we do not consider submarine cable system that does not land in Chinese mainland, which we discussed above. Chinese mainland is far away from many countries or regions, so it is difficult to construct submarine cables (Liu et al., 2019). Therefore, in order to promote the convenience of submarine cable network organization, it is necessary to strengthen cooperation with key countries to jointly build the international submarine cable transfer station. In the direction of European continent, China should strengthen cooperation with Thailand, Myanmar, Pakistan, and UAE, on the basis of consolidating cooperation with Singapore; in the direction of Africa, China should strengthen cooperation with Djibouti, Kenya, Tanzania, and South Africa; in the direction of South America, transit through the United States is still the main way in the near future. However, in the long run, cooperation with Chile and Brazil can be considered to realize direct connection to South American countries.
iv) Explore the intermodal transportation of submarine cable and land cable. The Ngwe Saung landing station in Myanmar provides a new platform for the construction of China’s submarine cable network. While shortening the laying distance of submarine cable lines and significantly improving connectivity, it can bypass the Malacca Strait, which is an easy restricted sea passage (Xie and Wang, 2021). Such a mode of intermodal transport (CAICT, 2018) provides new ideas for the construction of submarine cable network of Chinese mainland. China has a good advantage in geographical relationship. Cooperation with Myanmar and Pakistan in the joint operation of land cable and submarine cable can open China’s westward information channel.
Our study can provide guidance and a reference for the planning and construction of submarine cable networks of China and elsewhere, yet it has some limitations. Traditionally, research on transport networks usually analyzes the relationship between nodes in the whole network. However, in the present study only the relationship between Chinese mainland and other regions has been explored, so the conclusions are relatively limited. Thus, research on the global submarine cable network will be a goal for future work.
[1]
Abramson B D, 2000. Internet globalization indicators. Telecommunications Policy, 24(1): 69-74.

DOI

[2]
Audo F, Guegan M, Quintard V et al., 2011. Quasi-all-optical network extension for submarine cabled observatories. Optical Engineering, 4(50): 045001.

[3]
Baris H, Lu Z, 2000. The change from the geographical space to geocyberspace: Review on the Western scholars on regional effort by telecommunication. Acta Geographica Sinica, 55(1): 104-110. (in Chinese)

[4]
Blum A, 2012. Tubes:A Journey to the Center of the Internet. New York: Ecco Press.

[5]
Cao C, Zukerman M, Wu W et al., 2013. Survivable topology design of submarine networks. Journal of Lightwave Technology, 31(5): 715-730.

DOI

[6]
Cao Z, 2012. The vulnerability analysis and optimization on power cable transmission network based on complex networks. Dissertation, Tianjin University. (in Chinese)

[7]
Castells M, 1996. The Rise of the Network Society. Cambridge: Blackwell Publishers.

[8]
Chedida M R, Kobroslya R G, 2007. A supply model for crude oil and natural gas in the Middle East. Energy Policy, 35(4): 2096-2109.

DOI

[9]
Chen S S, Peng P, Lu F et al., 2019. Influence of the main channels on global container ship network. Geographical Research, 38(9): 2273-2287. (in Chinese)

[10]
Chen Y X, Zhen F, Wang B et al., 2012. A study of Internet information asymmetry relations among Chinese cities based on the micro-blog platform. Advances in Earth Sciences, 27(12): 34-43. (in Chinese)

[11]
China Academy of Information and Communications Technology (CAICT), 2018. White Paper on China International Optical Cable Interconnection. (in Chinese)

[12]
Downie J D, 2018. Maximum capacities in submarine cables with fixed power constraints for C-Band, C+L-Band, and multicore fiber systems. Journal of Lightwave Technol, 36(18): 4025-4032.

DOI

[13]
Edwards P N, Bowker G C, Jackson S J et al., 2009. Introduction: An agenda for infrastructure studies. Journal of the Association for Information Systems, 10(5): 364-374.

DOI

[14]
Fan C, Zhou X, Wang X, 2014. System reliability modeling and analysis of seafloor observatory network. Journal of Naval University of Engineering, 26(4): 92-95. (in Chinese)

[15]
Furlong K, 2021. Geographies of infrastructure II: Concrete, cloud and layered (in)visibilities. Progress in Human Geography, 45(1): 190-198.

DOI

[16]
Garrett L D, 2018. Design of global submarine networks. Journal of Optical Communications and Networking, 10(2): A185.

DOI

[17]
Graham S, 1999. Global grids of glass: On global cities, telecommunications, and planetary urban networks. Urban Studies, 36(5/6): 929-949.

DOI

[18]
Graham S, Marvin S, 1996. Telecommunications and the City:Electronic Spaces. London and New York: Routledge Press.

[19]
Grubesic T H, Morton E O, Murray A T, 2003. A geographic perspective on commercial Internet survivability. Telematics and Informatics, 20(1): 51-69.

DOI

[20]
Headrick D R, 1991. The Invisible Weapon:Telecommunications and International Politics 1851-1945. New York: Oxford University Press.

[21]
Hecht J, 2016. Great leaps of light. IEEE Spectrum, 53(2): 28-53.

[22]
Hu X L, Huang J, Shi F, 2019. Circuity in China’s high-speed-rail network. Journal of Transport Geography, 80: 1-13.

[23]
Huang Y P, 2019. China-Africa joint endeavor on the Digital Silk Road: Opportunities, challenges and approaches. China International Studies, (5): 13-28, 2. (in Chinese)

[24]
Jiao J J, Wang J E, Jin F J, 2017. Impacts of high-speed rail lines on the city network in China. Journal of Transport Geography, 60: 257-266.

DOI

[25]
Kim H, 2012. P-hub protection models for survivable hub network design. Journal of Geographical Systems, 14(4): 437-461.

DOI

[26]
Lin L, Kang Z L, Gan M Y et al., 2007. An analysis of the spatial field effects of tourist flow of Taiwanese visiting mainland of China based on airports. Geographical Research, 26(2): 403-413. (in Chinese)

[27]
Liu T, Wang W Y, Wang Y, 2019. Opportunities and challenges of China’s international submarine cable construction under the background of “Belt and Road”[N]. Ren Min You Dian, 2019-01-07 (003). (in Chinese)

[28]
Lou X F, 2019. Building China-Latin America Digital Silk Road: Challenges and roadmap. China International Studies, (4): 48-63, 2.

[29]
Malecki E J, 2002. The economic geography of the Internet’s infrastructure. Economic Geography, 78(4): 399-424.

[30]
Malecki E J, Wei H, 2009. A wired world: The evolving geography of submarine cables and the shift to Asia. Annals of the Association of American Geographers, 99(2), 360-382.

DOI

[31]
Matthew A Z, 2007. The geographies of the Internet. Annual Review of Information Science and Technology, 40(1): 53-78

DOI

[32]
Msongaleli D L, Dikbiyik F, Zukerman M et al., 2016. Disaster-aware submarine fiber-optic cable deployment for mesh networks. Journal of Lightwave Technology, 34(18): 4293-4303.

DOI

[33]
Murray A T, Matisziw T C, Grubesic, T H, 2007. Critical network infrastructure analysis: Interdiction and system flow. Journal of Geographical Systems, 9(2): 103-117.

DOI

[34]
Nakamoto H, Sugiyama A, Utsumi A, 2009. Submarine optical communications system providing global communications network. Fujitsu Scientific and Technical Journal, 45(4): 386-391.

[35]
Rodrigue J P, 2020. The Geography of Transport Systems. 5th ed. London and New York: Routledge Press.

[36]
Saunavaara J, Salminen M, 2020. Geography of the global submarine fiber-optic cable network: The case for Arctic Ocean solutions. Geographical Review, doi: 10.1080/00167428.2020.1773266

DOI

[37]
Tamura Y, Sakuma H, Morita K et al., 2018. The first 0.14-dB/km loss optical fiber and its impact on submarine transmission. Journal of Lightwave Technology, 36(1): 44-49.

DOI

[38]
Tavana M, Pirdashti M, Dennis T K et al., 2012. A hybrid Delphi-SWOT paradigm for oil and gas pipeline strategic planning in Caspian Sea basin. Energy Policy, 40(1): 345-360.

DOI

[39]
Townsend A M, 2001. The Internet and the rise of the new network cities, 1969-1999. Environment and Planning B: Planning and Design, 28(1): 39-58.

DOI

[40]
Wang M F, Ning Y M, 2004. The Internet and the rise of information network cities in China. Acta Geographica Sinica, 59(3): 446-454. (in Chinese)

[41]
Wang N N, Chen Y, Zhao Y, 2016. Analysis of the provincial information space network basted on the Internet information flow. Geographical Research, 35(1): 137-147. (in Chinese)

[42]
Weber J, 2012. The evolving interstate highway system and the changing geography of the United States. Journal of Transport Geography, 25: 70-86.

DOI

[43]
Weber J, 2017. Continuity and change in American urban freeway networks. Journal of Transport Geography, 58: 31-39.

DOI

[44]
Xie Y S, Wang C J, 2021. Vulnerability of submarine cable network of mainland of China: Comparison of vulnerability between before and after construction of Trans-Arctic cable system. Complexity, 2021, Article ID 6662232, 14 pages, 2021. https://doi.org/10.1155/2021/6662232.

[45]
Xu W T, Zhou J P, Qiu G, 2018. China’s high-speed rail network construction and planning over time: A network analysis. Journal of Transport Geography, 70: 40-54.

DOI

[46]
Ye Y, Jiang X, Pan G et al., 2018. Submarine Optical Cable Engineering. Pittsburgh: Academic Press.

[47]
Ye Yincan, 2006. Development of submarine optic cable engineering in the past twenty years. Journal of Marine Sciences, (3): 1-10. (in Chinese)

[48]
Zhen F, Wei Z C, Yang S et al., 2009. The impact of information technology on the characteristics of urban resident travel: Case of Nanjing. Geographical Research, 28(5): 1307-1317. (in Chinese)

Outlines

/