Research Articles

How do GPM and TRMM precipitation products perform in alpine regions? A case study in northwestern China’s Qilian Mountains

  • SUN Weijun , 1 ,
  • CHEN Rensheng 2 ,
  • WANG Lei , 1, 2, * ,
  • WANG Yingshan 1 ,
  • HAN Chuntan 2 ,
  • HUAI Baojuan 1
Expand
  • 1. College of Geography and Environment, Shandong Normal University, Jinan 250358, China
  • 2. Qilian Alpine Ecology & Hydrology Research Station, Key Laboratory of Ecohydrology of Inland River Basin, Northwest Institute of Eco-Environment and Resources, CAS, Lanzhou 730000, China
* Wang Lei, PhD and Lecturer, E-mail:

Sun Weijun, PhD and Associate Professor, specialized in climate change and glacial mass balance. E-mail:

Received date: 2021-06-13

  Accepted date: 2021-10-20

  Online published: 2022-07-25

Supported by

National Key R&D Program of China(2019YFC1510500)

National Natural Science Foundation of China(42101120)

National Natural Science Foundation of China(41971041)

National Natural Science Foundation of China(41971073)

National Natural Science Foundation of Shandong Province(ZR2021QD138)

Abstract

Satellite technologies provide valuable areal precipitation datasets in alpine mountains. However, coarse resolution still limits the use of satellite precipitation datasets in hydrological and meteorological research. We evaluated different time scales and precipitation magnitudes of Tropical Rainfall Measurement Mission 3B43 V7 (TRMM) and Global Precipitation Measurement (GPM) products for alpine regions using ground precipitation datasets from January 2015 to June 2019 obtained from 25 national meteorological stations and 11 sets of T-200B weighing precipitation gauges in the Qilian Mountains. The results indicated that GPM outperformed TRMM at all temporal scales at an elevation <3500 m with a higher probability of detection (POD), false alarm ratio (FAR), and frequency bias index (FBI) and performed best at 3000 m; TRMM performed better than GPM at an elevation >3500 m, with the best performance at 4000 m. GPM and TRMM had the best estimation accuracy in areas with monthly precipitation of 30 mm and 40 mm, respectively. Both TRMM and GPM products underestimated mid to large daily precipitation and overestimated light daily precipitation averaging <2 mm/d. This research not only emphasizes the superiority of GPM/TRMM in different regions but also indicates the limitations of precipitation algorithms.

Cite this article

SUN Weijun , CHEN Rensheng , WANG Lei , WANG Yingshan , HAN Chuntan , HUAI Baojuan . How do GPM and TRMM precipitation products perform in alpine regions? A case study in northwestern China’s Qilian Mountains[J]. Journal of Geographical Sciences, 2022 , 32(5) : 913 -931 . DOI: 10.1007/s11442-022-1978-5

1 Introduction

Areal precipitation datasets are key meteorological parameters for global and regional climate models, and accurate areal precipitation datasets with high spatiotemporal resolution are important for climate prediction and projection (Sorooshian et al., 2005; Yong et al., 2010; Darand et al., 2017). However, the lack of accurate areal precipitation datasets with high spatiotemporal resolution limits the development of many disciplines, including glaciology, hydrology, and climatology, especially in mountain regions. Therefore, the ability to obtain accurate distribution characteristics of precipitation datasets with high spatiotemporal resolution is an urgent scientific problem (Han et al., 2018; Wang et al., 2019a).
Ground-based measurements using precipitation gauges are the most accurate and simple methods to obtain precipitation datasets. Precipitation gauge-derived datasets are commonly used to verify and calibrate precipitation datasets obtained from remote sensing inversion and model simulation. However, most national meteorological stations are located in lower regions in mountain regions and are installed to meet the practical needs of national meteorological services rather than specific research requirements (Sevruk, 1997; Zhang et al., 2019; Hou et al., 2020). Furthermore, the national meteorological stations in alpine mountains with higher elevations are uneven or sparse, and field observations are hindered by harsh living conditions and insufficient funds. Therefore, sparse meteorological stations cannot accurately express the spatiotemporal heterogeneity of precipitation in alpine regions (Bhatt et al., 2005). Obviously, it is still a difficult challenge to obtain accurate areal precipitation datasets in alpine regions that have no or sparse precipitation gauges (Yuan et al., 2017).
The development of sensor technologies and data assimilation methods has proven promising in the inversion of gridded precipitation products (GPM, TRMM and ERA-Interim), especially for alpine mountains where national meteorological stations are sparse and spatial interpolation methods perform worse (Xu et al., 2017; Su et al., 2019; Wang et al., 2019a). However, these satellite gridded precipitation product estimation errors have resulted from many multiple influencing factors and have remained too significant to recommend a universal product. In particular, fewer ground-based precipitation gauges in mountain regions limit the ability to correct the gridded precipitation datasets from satellite inversion and enlarge the estimation errors of the precipitation datasets. In recent years, many researchers have evaluated the performance of these gridded precipitation products by comparing precipitation estimates (on daily, monthly and annual scales) from satellite inversion with observed precipitation datasets in different mountain regions, including the Himalayas (Xu et al., 2017), Qilian Mountains (Wang et al., 2019c), Tianshan Mountains (Lu et al., 2018), Alps (Speirs et al., 2017), and Andes (Manz et al., 2016; Palomino-Ángel et al., 2019). Satellite gridded precipitation products perform better in middle-low latitude mountains than in middle-high latitude mountains and perform better on lower elevation plains than in higher elevation mountains (Sun et al., 2016; Su et al., 2019; Chen et al., 2020). Again, limited by the placement of precipitation gauges, these above studies could not effectively evaluate the applicability of different satellite precipitation datasets at any spatial or temporal resolution in alpine regions, especially in mountains above 4000 m (Chen et al., 2014; Wang et al., 2019c). In addition, short-term heavy precipitation often occurs in alpine regions, resulting in high variability in the spatial distribution of precipitation and leading to potentially inaccurate evaluations at yearly or monthly resolutions (Liu et al., 2017; Wang et al., 2018). Therefore, the evaluation of gridded precipitation datasets on different time scales and precipitation magnitudes is significant for assessing the applicability of satellite products in alpine regions. In particular, the TRMM and GPM satellite datasets have been widely used in large-scale mountains with scarce observed precipitation gauges. However, the accuracy of these gridded precipitation datasets in alpine areas needs to be discussed. To overcome the shortcomings of previous research, we used the Qilian Mountains as the study area and added observed datasets in alpine regions from previous research to evaluate TRMM and GPM at different temporal resolutions (from hourly to monthly) and precipitation magnitudes (from 0.1 mm/day).

2 Study area

The Qilian Mountains (Figure 1) are located in northwestern China, mainly covering Qinghai and Gansu provinces, and they are the dividing line between the Tibetan Plateau and Tengger Desert. The Qilian Mountains have a wide altitudinal gradient from 1450 m to 5800 m and hinder the flow of water vapour. Therefore, there is plenty of precipitation in the Qilian Mountains, even in arid areas. The average annual temperature from 2006 to 2015 in the Qilian Mountains was -2.38℃ (measurement datasets; Wang et al., 2019a). The Qilian Mountains are mainly affected by three atmospheric circulation patterns: westerly circulation, the East Asian monsoon, and the plateau monsoon (Zhang et al., 2008; Xu et al., 2010; Chen et al., 2018a). The annual precipitation was 272.78 mm from 1960 to 2018 (datasets from CMA), and more than 80% of the precipitation was mainly concentrated in the wet season (May to September, 2006 to 2015).
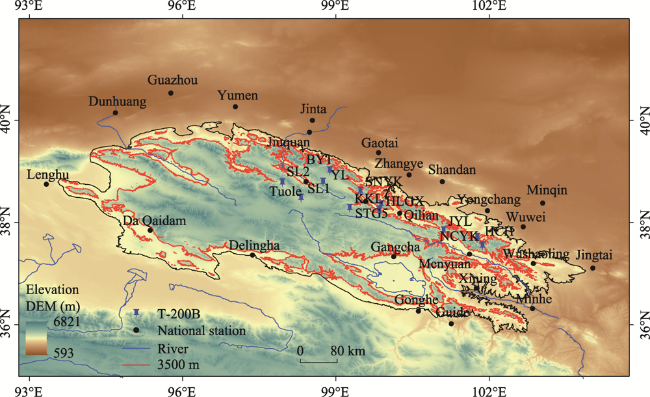
Figure 1 Location of the Qilian Mountains and the distribution of the national meteorological stations and T-200B weighing precipitation gauges
Three rivers originate from the entire drainage area on the northern margin of the Qilian Mountains, namely, the Shule River, Heihe River, and Shiyang River, and form the Hexi Corridor, which is one of the most important human habitats in Gansu Province (Bao et al., 2007). However, precipitation observation networks in the Qilian Mountains are scarce and unevenly distributed because of the harsh environment. In the Qilian Mountains and surrounding regions, all national meteorological stations are installed in regions below 3500 m. The lack of observed datasets in the alpine mountains has seriously hindered the development of climate prediction and projection in northwestern China. Therefore, we used 25 national meteorological stations and 11 sets of T-200B weighing precipitation gauges installed in alpine regions (>3500 m) to discuss the accuracy of gridded precipitation products (TRMM and GPM) in the Qilian Mountains and to further provide high spatiotemporal resolution datasets to support algorithm improvement and application in mountainous regions.

3 Datasets and methods

3.1 Ground-based precipitation datasets

In this paper, 25 national meteorological stations (daily time scale, below 3500 m) were used to discuss the applicability and accuracy of satellite gridded precipitation products in the Qilian Mountains and surrounding areas (Figure 1 and Table 1). All national meteorological stations are equipped with a Chinese standard precipitation gauge (CSPG) with a measuring height of 70 cm. To ensure dataset quality, all precipitation datasets underwent standard strict quality control and homogeneity assessment by the China Meteorological Administration (CMA). The daily precipitation datasets were downloaded from CMA (http://data. cma.cn). The monthly and annual precipitation datasets were obtained from daily datasets in the Qilian Mountains from January 2015 to December 2018.
Table 1 Introduction of national stations and T-200B in the Qilian Mountains
Precipitation gauges Longitude (°E) Latitude (°N) Elevation (m) Average of annual gauge precipitation (mm) Average of annual TRMM precipitation (mm) Average of annual GPM precipitation (mm)
Dunhuang 94.68 40.15 1139.0 48.42 51.93 71.88
Guazhou 95.77 40.53 1170.9 52.21 59.62 91.43
Jinta 98.54 40.00 1270.0 79.48 136.25 183.19
Gaotai 99.83 39.37 1332.2 125.98 159.06 242.48
Minqin 103.05 38.38 1367.5 129.60 147.85 232.40
Jiuquan 98.48 39.77 1477.2 110.52 133.39 189.42
Zhangye 100.43 38.93 1482.7 139.98 298.20 321.77
Yumen 97.03 40.27 1526.0 93.17 90.04 120.74
Wuwei 102.67 37.92 1531.5 181.84 270.40 381.44
Jingtai 104.03 37.11 1630.9 206.90 243.17 322.11
Shandan 101.08 38.80 1764.6 228.00 204.22 275.02
Minhe 102.85 36.32 1813.9 350.72 402.04 434.91
Yongchang 101.97 38.23 1976.9 228.83 318.55 294.82
Guide 101.26 36.02 2237.1 284.33 406.86 411.78
Xining 101.75 36.72 2295.2 429.31 404.10 427.97
Lenghu 93.33 38.75 2770.0 20.70 42.07 44.75
Qilian 100.25 38.18 2787.4 450.29 490.04 397.90
Gonghe 100.62 36.27 2835.0 358.99 352.60 387.85
Menyuan 101.62 37.38 2850.0 543.25 568.46 430.09
Delingha 97.37 37.37 2981.5 249.48 195.40 191.11
Wushaoling 102.87 37.20 3045.1 446.61 437.80 424.92
Da Qaidam 95.37 37.85 3173.2 113.90 119.48 111.90
Gangcha 100.13 37.33 3301.5 454.98 385.77 393.23
Yeniugou 99.58 38.42 3320.0 485.22 481.78 342.65
Tuole 98.42 38.80 3367.0 353.75 308.53 241.54
JYL 101.11 37.84 3846.0 564.30 553.17 743.18
STG5 99.89 38.35 4399.0 740.60 518.58 571.12
YL 98.75 38.79 4156.0 488.00 361.07 328.17
BY1 98.88 39.01 4650.0 744.60 357.32 651.59
SL1 98.32 38.47 3890.0 367.59 362.32 412.85
SL2 97.96 38.77 3636.0 275.80 373.26 433.07
NCYK 101.87 37.54 4048.0 961.00 739.27 1040.90
KKL 99.27 38.28 4162.0 532.70 505.10 489.90
SNYK 99.48 38.61 4203.0 554.60 481.14 510.33
HLGX 99.85 38.23 4314.0 939.10 521.16 538.95
HCH 101.76 37.71 3564.0 715.00 739.27 823.24
Hourly precipitation datasets from June 2018 to July 2019 were obtained from 11 sets of automatic meteorological stations installed at high elevations (half-hourly time scale, above 3500 m) in the Qilian Mountains. Each automatic meteorological station is equipped with a single-Alter-shielded Geonor T-200B (1000-mm capacity, Norway) weighing precipitation gauge (measuring height 1.75 m), as well as the recording device for wind speed (05103-45, R. M. Young), temperature and humidity (HMP155A, Vaisala) (Figure 1 and Table 1). To ensure precipitation dataset accuracy, the observation error of the weighing precipitation gauges was corrected, and the related corrected equations were reported in previous research for the Hulu catchment and Bayi glaciers in the Qilian Mountains (Kochendorfer et al., 2017; Zheng et al., 2018; Zhao et al., 2021).

3.2 TRMM precipitation products

TRMM began in November 1997, and one of its aims was to obtain satellite gridded precipitation datasets in tropical and subtropical regions between 50°N and 50°S (Huffman et al., 2007). In this study, the gridded precipitation products we used were TRMM 3B43 V7 products with a 3-hourly time scale and a 0.25°×0.25° spatial resolution (January 2015 to July 2019), and TRMM provided the precipitation datasets. The TRMM precipitation products can be obtained from the National Aeronautic and Space Administration Precipitation Measurement Mission website: https://pmm.nasa.gov/data-access.

3.3 GPM precipitation products

GPM IMERG V06 is the latest satellite gridded precipitation product and began to provide global gridded precipitation products after April 2014, providing half-hourly satellite precipitation datasets at a 0.1°×0.1° spatial resolution (Huffman et al., 2015; Hou et al., 2014). Based on TRMM’s successful rain-sensing package, the GPM satellite sensor mainly focuses on minor and solid precipitation over tropical and subtropical regions (Yi et al., 2018). Consequently, the key improvement in GPM is the extended capability to measure trace rainfall events (< 0.5 mm/hour), solid precipitation, and microphysical properties of precipitating particles. The GPM precipitation products from January 2015 to July 2019 were also obtained from https://pmm.nasa.gov/data-access.
Note that the time range of both TRMM and GPM satellite products for daily observations is from 0:00 to 24:00 UTC. However, the time range of daily point-observed datasets obtained from CMA is from 20:00 of the previous day to 20:00 of the present day, Beijing time (Fang et al., 2019). Therefore, before calculating the half-hourly or 3-hour datasets, both satellite precipitation products were first converted from UTC time into Beijing time in the study areas (Cai et al., 2016).

3.4 Methodology

Evaluation of TRMM and GPM precipitation datasets was performed by comparing them with ground observations. Four evaluation indices were used to evaluate the estimation errors of two satellite gridded precipitation products, including bias, root mean square error (RMSE), Nash-Sutcliffe efficiency coefficient (NSE) and R2. These statistical metrics were shown as follows:
(1) Bias, expressed as:
$Bias=~\frac{1}{n}\underset{i}{\overset{n}{\mathop \sum }}\,\left[ {{S}_{i}}-{{O}_{i}} \right]$
(2) The root mean square error (RMSE), expressed as:
$RMSE=\sqrt{\left( \frac{\mathop{\sum }_{i}^{n}{{\left( {{S}_{i}}-{{O}_{i}} \right)}^{2}}}{n} \right)}$
(3) The Nash-Sutcliffe efficiency coefficient (NSE), expressed as:
$NSE=1-\frac{\mathop{\sum }_{i}^{n}{{\left( {{O}_{i}}-{{S}_{i}} \right)}^{2}}}{\mathop{\sum }_{i}^{n}{{\left( {{O}_{i}}-{{{\bar{O}}}_{i}} \right)}^{2}}}$
where Si and Oi are satellite precipitation and point-observed precipitation at the same time scales, and ${{\bar{O}}_{i}}$ is the average point-observed precipitation.
To further assess the precipitation event detection capability of both satellite precipitation products, three other statistical metrics were calculated. The frequency bias index (FBI) is the ratio of the number of satellite rain events to the number of precipitation gauge-observed events. If the FBI is larger than 1, the satellite products overestimate the number of “true” precipitation events in the study period; if the FBI is less than 1, the satellite products underestimate the number of “true” precipitation events in the study period. The false alarm ratio (FAR) is the ratio of precipitation events only detected by satellite sensors to the total number of precipitation events observed by precipitation gauges. The probability of detection (POD) is the ratio of precipitation events detected by both satellite sensors and precipitation gauges to the total number of precipitation gauge-detected events. These above three statistical metrics are calculated and given in Figure 2 (Scheel et al., 2011).
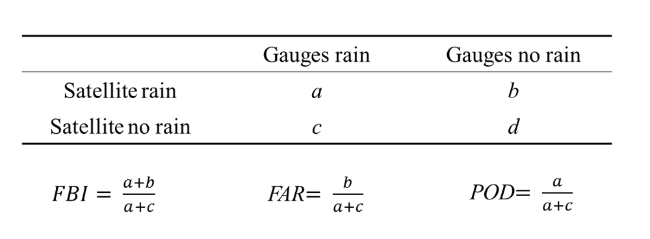
Figure 2 Statistical metric definitions and computational formulas

4 Results and discussion

4.1 Accuracy assessment of TRMM and GPM

Figure 3 shows the average monthly precipitation of national stations and T-200B in the analysed area versus TRMM and GPM at monthly time scales. Precipitation in the Qilian Mountains varied seasonally, and precipitation in the wet season (May to September) accounted for more than 80% of the total precipitation. Both TRMM and GPM precipitation products effectively captured temporal variability in monthly precipitation (Figure 3). However, the two precipitation products overestimated precipitation from May to November compared with national stations at lower elevations; furthermore, the GPM precipitation products overestimated precipitation from June to November, and the TRMM precipitation products underestimated monthly precipitation compared with T-200B gauges at high elevations. However, TRMM was closer to the observed datasets in alpine regions. Therefore, the TRMM precipitation products performed better in the high mountains than GPM (Figures 3-4 and Table 2). Although these results differed from those for tropical high mountains (Palomino-Ángel et al., 2019), they were similar to those of other studies in mid- to high-latitude mountains (Li et al., 2018).
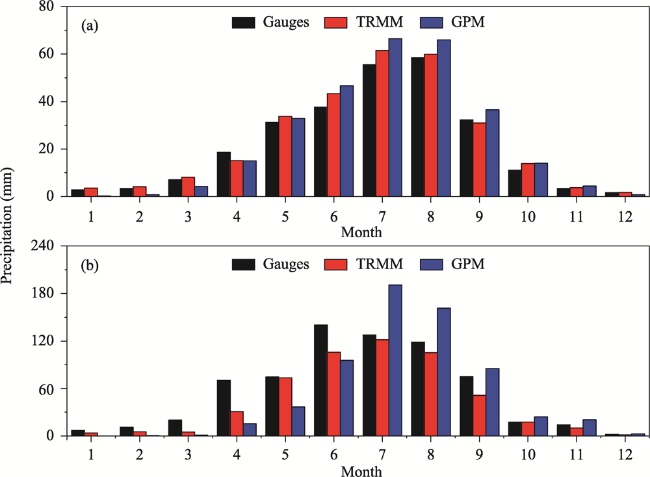
Figure 3 Distribution of monthly precipitation estimates from national stations (a), T-200B (b), TRMM and GPM
Table 2 Changes in different evaluation indices at different time scales
3 hours 6 hours 12 hours daily 2 days 5 days 10 days half monthly monthly
TRMM Bias -0.04 -0.08 -0.13 -0.32 -0.65 -1.61 -1.35 -3.71 -7.42
RMSE 1.44 2.29 3.22 4.60 7.10 11.95 11.69 23.03 25.05
NSE -0.52 -0.59 -0.48 -0.35 -0.37 -0.16 -0.12 0.15 0.68
R2 0.00 0.01 0.04 0.11 0.13 0.23 0.25 0.44 0.84
GPM Bias -0.01 -0.01 -0.03 -0.05 -0.09 -0.22 -0.04 0.16 0.32
RMSE 1.46 2.43 3.37 4.92 7.26 11.71 11.58 25.48 39.74
NSE -0.50 -0.46 -0.38 -0.06 0.04 0.22 0.25 0.39 0.58
R2 0.00 0.01 0.05 0.16 0.23 0.37 0.38 0.50 0.67

*The datasets are from T-200B weighing precipitation gauges.

The comparison between the results of two satellite datasets and observation datasets from CSPG was analysed at different time scales for the Qilian Mountains (Figure 4). Four evaluation indices for the two satellite datasets increased with time scale; two satellite datasets agreed well with gauge-precipitation amounts at monthly scale and had high R2 values, 0.73 and 0.78 for TRMM and GPM, respectively. The bias of TRMM was smaller than that of GPM, and the RMSEs of TRMM were higher than those of GPM (Figure 4). This indicates that the simulation results of TRMM were more accurate than those of GPM, but the simulation results of GPM were less scattered than those of TRMM when compared with observation datasets. In addition, although the R2 value of GPM was higher than that of TRMM at different time scales, TRMM had a better NSE. This showed that GPM had stronger correlation and more stable simulation results than TRMM, and TRMM had better simulation results when compared with observation precipitation datasets in the Qilian Mountains, and these results reflected those from earlier research (Li et al., 2018; Wang et al., 2019c).
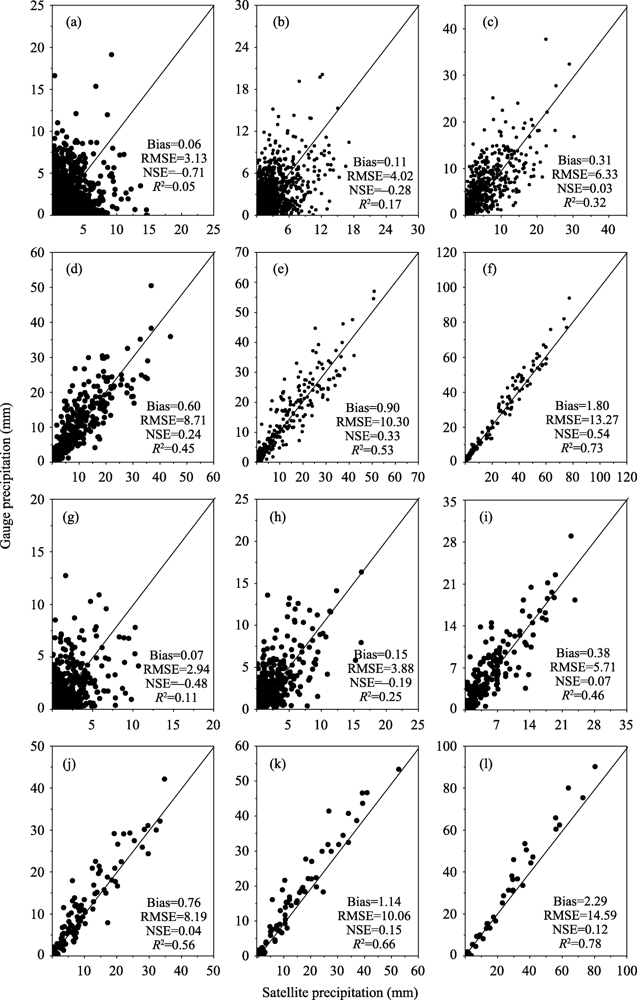
Figure 4 Changes in evaluation indices at different time scales: a, b, c, d, e, and f indicate changes in TRMM at daily, two-day, five-day, ten-day, half-monthly and monthly scales (2006-2018); g, h, i, j, k, and l indicate changes in GPM on daily, two-day, five-day, ten-day, half-monthly and monthly scales (2015-2018). Datasets are from national meteorological stations.
The T-200B weighing precipitation gauges are installed at higher elevations than the national stations with different climatic environments and precipitation amounts. Therefore, they had different evaluation index values. First, the bias for either GPM or TRMM was negative at almost all time scales, indicating that satellite values underestimated precipitation in high mountains and overestimated precipitation in low mountains compared with ground measurements (Table 2 and Figure 4). In addition, RMSEs of TRMM and GPM compared with T-200B datasets were higher than the same compared with national stations datasets at the same time scales; however, the NSE and R2 values were smaller than those calculated from CSPG observation datasets. These results showed that the errors in alpine areas were much larger than those in low mountains and that the discreteness of estimates in high mountains was greater regardless of whether TRMM or GPM was used to estimate precipitation.
It is well known that precipitation increases with elevation within a certain range; therefore, the evaluation indices are different at different elevations. We analysed the influences of elevation on the four statistical metrics at monthly scales in Figure 5. The four statistical metrics of the two satellite precipitation products showed similar change characteristics with elevation. RMSEs increased with elevation for both satellite products, while NSE and R2 values increased first and then decreased with elevation. The bias of the two satellite precipitation products had the same changing trend. First, the positive value approached zero, and then it became negative (Figure 5). Although the evaluation indices of the two satellite products had the same trends with elevation, different elevation thresholds could affect the trends. For example, the NSE and R2 values of TRMM exhibited a parabolic trend, reaching a maximum at approximately 4000 m and then decreasing with increasing elevation (Figures 5c and 5d). Furthermore, the absolute value of bias was minimal and closer to 0 at 4000 m, and RMSE increased dramatically above 4000 m (Figures 5a and 5b). Similarly, the elevation threshold for GPM was 3000 m. Although the parabolic trend of GPM bias and NSE was not clear, the trends of R2 values were similar to those of TRMM (Figures 5g and 5h). These results indicated that TRMM performed best at an elevation of approximately 4000 m, while GPM was best at an elevation of approximately 3000 m in the Qilian Mountains. We further discussed the influences of monthly precipitation amount on four statistical metrics at monthly scales. TRMM performed best when the average monthly precipitation was approximately 40 mm, while GPM was best when the average monthly precipitation was approximately 30 mm in the Qilian Mountains (Figure 6).
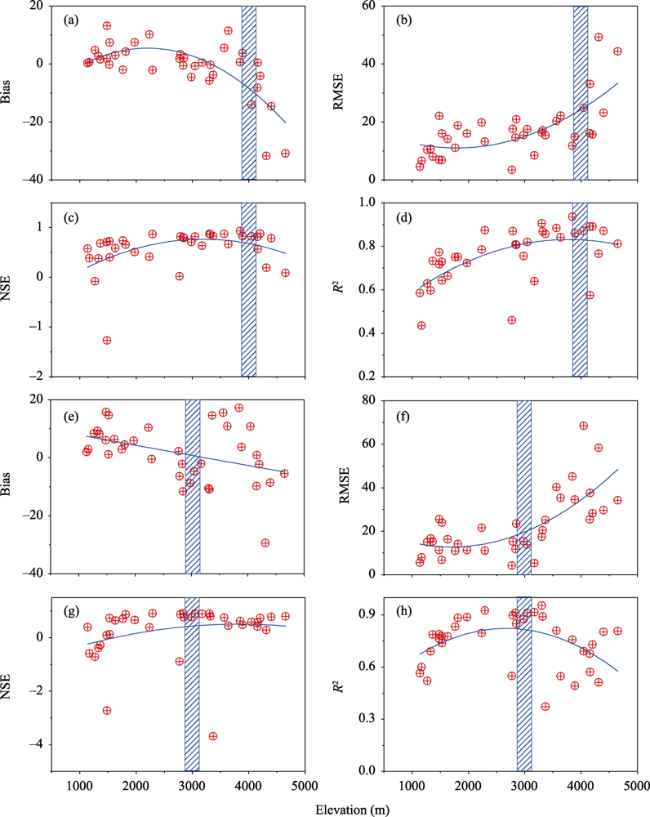
Figure 5 Scatter plots between the bias, RMSE, NSE and R2 values and elevation at monthly scales (a, b, c, and d represent evaluation indices of TRMM; e, f, g, and h represent evaluation indices of GPM.)
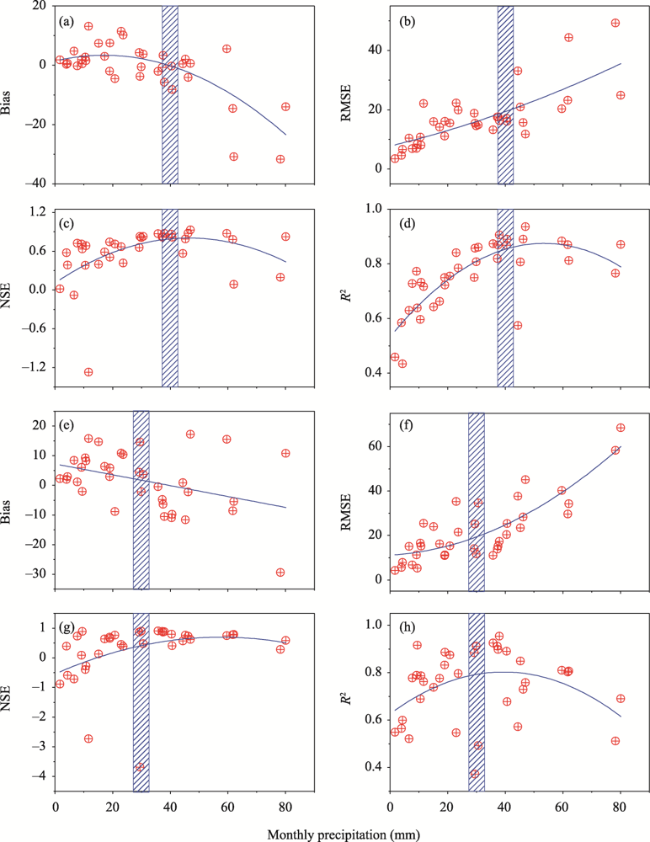
Figure 6 Scatter plots between bias, RMSE, NSE, and R2 values and monthly precipitation (a, b, c, and d represent evaluation indices of TRMM; e, f, g, and h represent evaluation indices of GPM.)
We also analysed the effects of precipitation magnitudes on evaluation indices at daily scales (Figure 7). When daily precipitation was less than 2 mm, both satellite products overestimated precipitation, and when daily precipitation was greater than 2 mm, both products underestimated precipitation. In addition, RMSE increased with precipitation magnitude. However, the errors of TRMM were higher than those of GPM at different precipitation magnitudes, regardless of whether it was bias or RMSE (Figure 7). These results were the same as those of previous research in the Andes Mountains (Scheel et al., 2011).
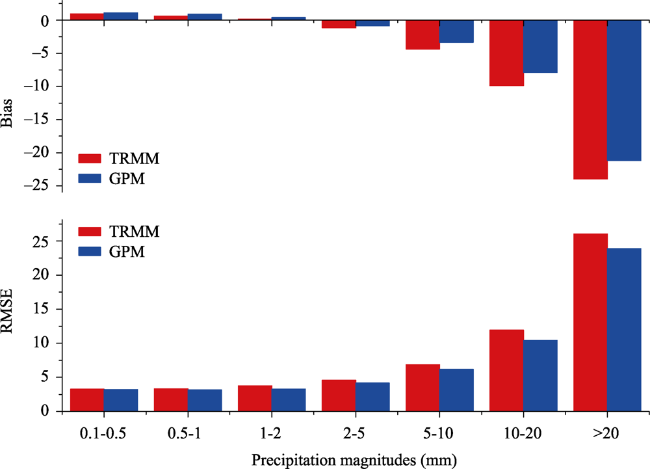
Figure 7 The histogram of changing bias and RMSE with precipitation magnitudes at a daily scale

4.2 Detecting capability of TRMM and GPM

Three statistical indices (FBI, FAR, and POD) were calculated at each ground-based precipitation gauge to assess the precipitation event detection capability of TRMM and GPM. For national stations at low elevations (<3500 m), GPM products had higher FBIs (ranging from 1.36 to 3.74 versus 0.96 to 1.21 for TRMM), PODs (ranging from 0.54 to 0.66 versus 0.21 to 0.45 for TRMM), and FARs (ranging from 0.60 to 0.83 versus 0.59 to 0.79 for TRMM) than TRMM (Figure 8 and Table 3). This indicated that GPM outperformed TRMM at lower altitudes in the Qilian Mountains. However, the case was opposite for the T-200B gauges at higher elevations (>3500 m). For example, TRMM exhibited higher PODs than GPM, indicating that TRMM worked better than GPM (Table 3). In conclusion, the overall detection capability of two satellite precipitation products in the Qilian Mountains was not as accurate as in areas with flat terrain and independent of elevation (Sun et al., 2016; Wang et al., 2019c).
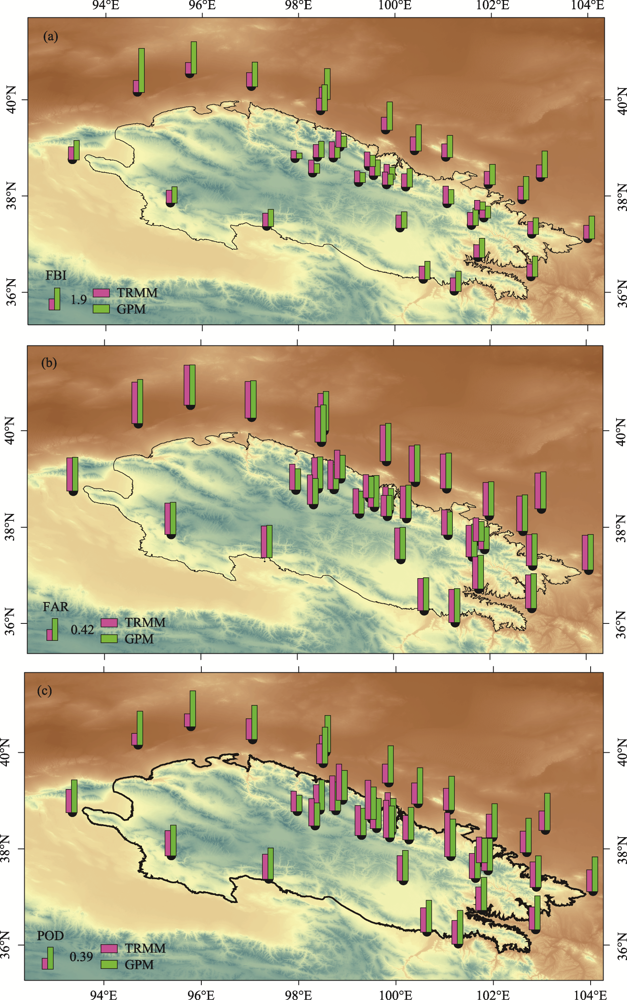
Figure 8 Comparison of the results of three statistical indices (FBI, FAR, and POD) in the Qilian Mountains
Table 3 Average statistical indices for satellite products at a daily scale
National gauges T-200B gauges
TRMM FBI 1.11 1.16
FAR 0.65 0.48
POD 0.39 0.60
GPM FBI 1.90 0.91
FAR 0.67 0.43
POD 0.60 0.52
The FBIs of GPM decreased with increasing elevation and monthly precipitation and approached 1; however, the FBIs of TRMM did not change significantly but fluctuated by approximately 1. The FARs of both satellite precipitation products decreased with increasing elevation and monthly precipitation (Figure 9). The PODs of both satellite precipitation products exhibited opposite trends: the PODs of TRMM increased and the PODs of GPM decreased with increasing elevation and monthly precipitation. Both satellite products overestimated the number of precipitation events at lower elevations. At higher elevations, GPM underestimated the number of precipitation events and overestimated precipitation amounts, while TRMM performed in the opposite manner (Figure 7 and Table 3). Both TRMM and GPM underestimated mid to large daily precipitation and overestimated light daily precipitation by an average of < 2 mm/d (Figure 7). This indicated that daily precipitation amounts in the Qilian Mountains were mostly less than 2 mm/day, reflecting the results of a previous study (Wang et al., 2019c).
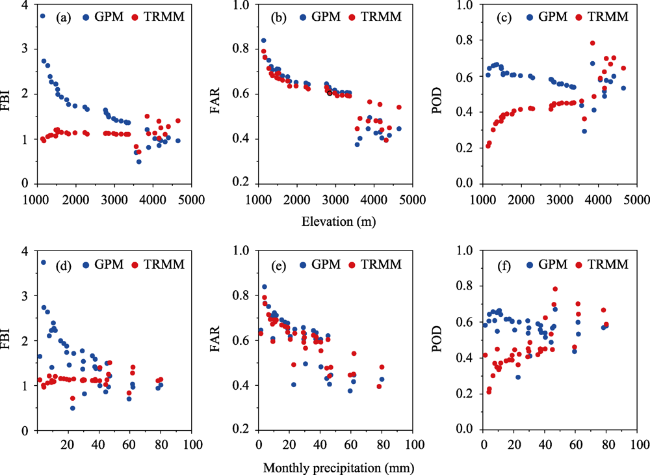
Figure 9 The change characteristics of statistical indices with changing elevation/monthly precipitation

4.3 Analysis of error sources in satellite datasets

The precipitation estimate performance of two satellite precipitation products in the Qilian Mountains showed significant spatial discrepancies at different elevations or different areas and for precipitation amounts and number of events. The accuracy of satellite precipitation datasets is significantly affected by topography, especially elevation. The effect of elevation on the precipitation estimate performance of satellite products has been discussed in several previous studies (Xu et al., 2017). In this study, TRMM performed best at an elevation of 4000 m, while GPM performed best at 3000 m; the performance of both satellite products decreased away from their elevation threshold (Figure 5).
The different performances between TRMM and GPM could be explained with the assimilation algorithm for precipitation datasets, cloud-precipitation microphysics, and their interactions with regional topography. First, the structure of precipitating cloud systems was considered in the assimilation algorithm of two satellite sensors (Michaelides et al., 2009), but the evaporation in different regions may not be considered adequately, especially in northwestern China with intense evaporation. Therefore, part of the liquid water in the atmosphere might evaporate as rain drops that fall because of intense evaporation and cannot form precipitation events; this results in overestimation of precipitation in northwestern China (Wang et al., 2018; Wang et al., 2019c). Several studies have compared estimates of the total precipitation rate between the upgraded GPM precipitation products and TRMM, and the results showed that GPM performed better than TRMM (Huffman et al., 2015; Fang et al., 2019). These improvements were primarily attributed to the enhanced capability of GPM to detect light rain and solid precipitation, which results in GPM further aggravating this part of the misjudgment (Huffman, 2017; Tang et al., 2017; Chen et al., 2018). This explains why GPM has better POD than TRMM but also has higher FAR values at lower elevations, which exhibit higher evaporation (Kang et al., 2002; Hu et al., 2018; Yang et al., 2018). Second, both satellite precipitation datasets are merged products that combine remote sensing inversion datasets from satellite sensors and observed precipitation datasets from ground gauges. However, the precipitation-observed networks on the Tibetan Plateau cannot accurately explain the complex spatiotemporal heterogeneity of precipitation in alpine regions with undulating topography. For example, the Anduo station (4800 m) is the highest national meteorological station on the Tibetan Plateau (Chen et al., 2014); nevertheless, the mean elevation of the Tibetan Plateau is approximately 4325 m. This means that the precipitation observation stations are too sparse to express the distribution of precipitation on the Tibetan Plateau.
The shortage of precipitation datasets has hindered research on the distribution characteristics of precipitation in alpine regions (Walser et al., 2004). In particular, the evaluation and correction of gridded precipitation products are limited because of scarce observed datasets. Therefore, the precipitation amount based only on the gridded precipitation products is inaccurate in mountain areas. In addition, whether rainfall, snowfall or sleet processes occur in alpine regions, they are more complex than those on low plains because of undulating topography, large roughness, and complex atmospheric conditions, which could result in inaccurate estimates of rainfall by satellite sensors. In higher mountainous areas, convective systems are more complex, and orographic precipitation events are more frequent than in low-lying areas; these special climate phenomena reduce the detectability of satellite sensors (Chen et al., 2016).
Although GPM has better spatiotemporal resolution than TRMM, problems remain. For example, GPM is limited in its way of representing small-scale precipitation systems and isolated deep convection and in capturing orographic enhancement of rainfall associated with cap clouds and feeder-seeder cloud interactions over ridges (Zhang et al., 2018a). Furthermore, the satellite algorithm is based on the statistical relationships of cloud systems and ground datasets, which result in large errors under high temporal-spatial resolution (Beria et al., 2017). Therefore, the performance of GPM was better at lower elevations and worse at higher elevations than that of TRMM, and these results reflect those of several previous studies on the Tibetan Plateau (Beria et al., 2017; Li et al., 2018; Zhang et al., 2018b; Wang et al., 2019b).

4.4 Limitations of performance analysis

The performance assessment of TRMM and GPM in alpine regions has some limitations. First, the lack of ground precipitation measurements not only limits the calibration of satellite datasets in high mountains but also causes large errors in the algorithm based on ground precipitation (Fang et al., 2019; Wang et al., 2019c). Although our research included gauge-precipitation datasets for high areas, the time series was too short to show annual variability in precipitation. Therefore, as the time series is extended, more research is needed on the accuracy and algorithm of satellite precipitation products (Mahmoud et al., 2019).
Second, the temporal resolution of precipitation data provided by national stations is mostly at a daily scale. Therefore, the minimum scale for satellite product evaluation is the daily scale (Rozante et al., 2018; Mahmoud et al., 2019). Therefore, scarce assessments at hourly scales result in an inability to obtain diurnal variability in precipitation. Although we evaluated the accuracy of satellite products in high mountains on hourly scales in this study, precipitation gauges were sparse and unevenly distributed, resulting in large blank areas. Hence, this will inevitably result in the limitation of satellite product evaluation and correction in regions with sparse precipitation gauges. In view of the current situation of precipitation observation research and installed precipitation gauges, we will install more T-200B weighing precipitation gauges in the alpine regions of the southwestern Qilian Mountains based on new funds and further discuss the accuracy of satellite products. Moreover, in the alpine regions where precipitation gauges are lacking, downscaling of satellite datasets is one of the effective methods to obtain high accuracy precipitation datasets. Therefore, various downscaling studies for satellite precipitation products need further research based on statistical downscaling and dynamic downscaling methods.

5 Conclusions

In this study, the TRMM and GPM precipitation products were compared with gauge datasets to determine the accuracy of satellite products for alpine regions at different time scales and different precipitation magnitudes. Some conclusions can be drawn as follows:
(1) Compared with TRMM, GPM had a smaller RMSE and larger R2, bias, POD, FAR, and FBI values at lower elevations (<3500 m) in the Qilian Mountains. At elevations above 3500 m, the performance of the two satellite products was opposite. TRMM had a smaller RMSE, larger bias, larger R2 value, better POD, worse FAR, and larger FBI. Overall, the performance of GPM was better than that of TRMM at lower elevations, but TRMM outperformed GPM at higher elevations. Furthermore, TRMM had better NSE values at all elevations.
(2) Analysis of statistical indicators showed that the best elevation in the Qilian Mountains for precipitation estimation with GPM was 3000 m; the best estimation accuracy with TRMM was 4000 m. GPM performed best when the average monthly precipitation was approximately 30 mm, and TRMM performed best when the average monthly precipitation was approximately 40 mm.
(3) For the Qilian Mountains, both TRMM and GPM precipitation products slightly underestimated mid to large daily precipitation amounts and overestimated daily precipitation totals below an average of 2 mm/day.
[1]
Bao C, Fang C L, 2007. Water resources constraint force on urbanization in water deficient regions: A case study of the Hexi Corridor, arid area of NW China. Ecological Economics, 62(3/4): 508-517.

DOI

[2]
Beria H, Nanda T, Bisht D S et al., 2017. Does the GPM mission improve the systematic error component in satellite rainfall estimates over TRMM? An evaluation at a pan-India scale. Hydrology and Earth System Sciences, 21(12): 6117.

DOI

[3]
Bhatt B C, Nakamura K, 2005. Characteristics of monsoon rainfall around the Himalayas revealed by TRMM precipitation radar. Monthly Weather Review, 133: 149-165.

DOI

[4]
Cai Y, Jin C, Wang A et al., 2016. Comprehensive precipitation evaluation of TRMM 3B42 with dense rain gauge networks in a mid-latitude basin, northeast China. Theoretical and Applied Climatology, 126: 659-671.

DOI

[5]
Chen C, Chen Q, Duan Z et al., 2018. Multiscale comparative evaluation of the GPM IMERG v5 and TRMM 3B42 v7 precipitation products from 2015 to 2017 over a climate transition area of China. Remote Sensing, 10(6): 944.

DOI

[6]
Chen F, Li X, 2016. Evaluation of IMERG and TRMM 3B43 monthly precipitation products over mainland of China. Remote Sensing, 8(6): 472.

DOI

[7]
Chen R S, Han C T, Liu J F et al., 2018. Maximum precipitation altitude on the northern flank of the Qilian Mountains, northwest China. Hydrology Research, 49: 1696-1710.

DOI

[8]
Chen R S, Song Y X, Kang E S et al., 2014. A cryosphere-hydrology observation system in a small alpine watershed in the Qilian Mountains of China and its meteorological gradient. Arctic, Antarctic, and Alpine Research, 46(2): 505-523.

DOI

[9]
Chen S, Zhang L, Zhang Y et al., 2020. Evaluation of Tropical Rainfall Measuring Mission (TRMM) satellite precipitation products for drought monitoring over the middle and lower reaches of the Yangtze River Basin, China. Journal of Geographical Sciences, 30(1): 53-67.

DOI

[10]
Darand M, Amanollahi J, Zandkarimi S, 2017. Evaluation of the performance of TRMM Multi-satellite Precipitation Analysis (TMPA) estimation over Iran. Atmospheric Research, 190: 121-127.

DOI

[11]
Fang J, Yang W, Luan Y et al., 2019. Evaluation of the TRMM 3B42 and GPM IMERG products for extreme precipitation analysis over China. Atmospheric Research, 223: 24-38.

DOI

[12]
Han C T, Chen R S, Liu Z W et al., 2018. Cryospheric Hydrometeorology Observation in the Hulu Catchment (CHOICE), Qilian Mountains, China. Vadose Zone Journal, 17(1).

[13]
Hou A Y, Kakar R K, Neeck S et al., 2014. The global precipitation measurement mission. Bulletin of the American Meteorological Society, 95: 701-722.

DOI

[14]
Hou B, Jiang C, Sun O J, 2020. Differential changes in precipitation and runoff discharge during 1958-2017 in the headwater region of Yellow River of China. Journal of Geographical Sciences, 30(9): 1401-1418.

DOI

[15]
Hu Z, Wang G, Sun X et al., 2018. Spatial-temporal patterns of evapotranspiration along an elevation gradient on Mount Gongga, Southwest China. Water Resources Research, 54(6): 4180-4192.

DOI

[16]
Huffman G J, 2017. The transition in multi-satellite products from TRMM to GPM (TMPA to IMERG). NASA. https://pmm.nasa.gov/resources/documents/.

[17]
Huffman G J, Bolvin D T, Nelkin E J, 2015. Integrated multi-satellite retrievals for GPM (IMERG) technical documentation. NASA/GSFC Code 612, 47.

[18]
Huffman G J, Bolvin D T, Nelkin E J et al., 2007. The TRMM multisatellite precipitation analysis (TMPA): Quasi-global, multiyear, combined-sensor precipitation estimates at fine scales. Journal of Hydrometeorology, 8: 38-55.

DOI

[19]
Kang E, Cheng G, Dong Z, 2002. Glacier-snow Water Resources and Mountain Runoff in the Arid Area of Northwest China. Beijing: Science Press, 248-269.

[20]
Kochendorfer J, Rasmussen R, Wolff M A et al., 2017. The quantification and correction of wind-induced precipitation measurement errors. Hydrology and Earth System Sciences, 21: 1973-1989.

DOI

[21]
Li Q, Zhang W, Yi L et al., 2018. Accuracy evaluation and comparison of GPM and TRMM precipitation product over Mainland China. Advances in Water Science, 29(3): 303-313.

[22]
Li Y, 2008. Study and analysis of climate characteristics of precipitation and its causes over Qilian Mountains[D]. Lanzhou: Lanzhou University.

[23]
Liu X, Zhang M, Wang S et al., 2017. Assessment of diurnal variation of summer precipitation over the Qilian Mountains based on an hourly merged dataset from 2008 to 2014. Journal of Geographical Sciences, 27(3): 326-336.

DOI

[24]
Lu X, Wei M, Tang G et al., 2018. Evaluation and correction of the TRMM 3B43V7 and GPM 3IMERGM satellite precipitation products by use of ground-based data over Xinjiang, China. Environmental Earth Sciences, 77(5): 209.

DOI

[25]
Mahmoud M T, Hamouda M A, Mohamed M M, 2019. Spatiotemporal evaluation of the GPM satellite precipitation products over the United Arab Emirates. Atmospheric Research, 219: 200-212.

DOI

[26]
Manz B, Buytaert W, Zulkafli Z et al., 2016. TRMM-and GPM-based precipitation analysis and modelling in the Tropical Andes. In: EGU General Assembly Conference Abstracts (Vol. 18).

[27]
Michaelides S, Levizzani V, Anagnostou E et al., 2009. Precipitation: Measurement, remote sensing, climatology and modeling. Atmospheric Research, 94(4): 512-533.

DOI

[28]
Palomino-Ángel S, Anaya-Acevedo J A, Botero B A, 2019. Evaluation of 3B42V7 and IMERG daily-precipitation products for a very high-precipitation region in northwestern South America. Atmospheric Research, 217: 37-48.

DOI

[29]
Rozante J, Vila D, Barboza Chiquetto J et al., 2018. Evaluation of TRMM/GPM blended daily products over Brazil. Remote Sensing, 10(6): 882.

DOI

[30]
Scheel M L, Rohrer M, Huggel C et al., 2011. Evaluation of TRMM Multi-satellite Precipitation Analysis (TMPA) performance in the Central Andes region and its dependency on spatial and temporal resolution. Hydrology and Earth System Sciences, 15(8): 2649-2663.

DOI

[31]
Sevruk B, 1997. Regional dependency of precipitation-altitude relationship in the Swiss Alps. In: Climatic Change at High Elevation Sites. Dordrecht, The Netherlands: Springer, 123-137.

[32]
Sorooshian S, Lawford R, Try P et al., 2005. Water and energy cycles: Investigating the links. WMO Bulletin, 54: 58-64.

[33]
Speirs P, Gabella M, Berne A, 2017. A comparison between the GPM dual-frequency precipitation radar and ground-based radar precipitation rate estimates in the Swiss Alps and Plateau. Journal of Hydrometeorology, 18(5): 1247-1269.

DOI

[34]
Su J, H, Zhu Y et al., 2019. Evaluating the hydrological utility of latest IMERG products over the Upper Huaihe River Basin, China. Atmospheric Research, 225: 17-29.

DOI

[35]
Sun R, Yuan H, Liu X et al., 2016. Evaluation of the latest satellite-gauge precipitation products and their hydrologic applications over the Huaihe River basin. Journal of Hydrology, 536: 302-319.

DOI

[36]
Tang G Wen, Y, Gao J et al., 2017. Similarities and differences between three coexisting spaceborne radars in global rainfall and snowfall estimation. Water Resources Research, 53(5): 3835-3853.

DOI

[37]
Walser A, Lüthi D, Schär C, 2004. Predictability of precipitation in a cloud-resolving model. Monthly Weather Review, 132(2): 560-577.

DOI

[38]
Wang L, Chen R S, Han C T et al., 2019a. An improved spatial-temporal downscaling method for TRMM precipitation datasets in alpine regions: A case study in northwestern China’s Qilian Mountains. Remote Sensing, 11(7): 870.

DOI

[39]
Wang L, Chen R S, Song Y X et al., 2018. Precipitation-altitude relationships on different timescales and at different precipitation magnitudes in the Qilian Mountains. Theoretical and Applied Climatology, 134(3/4): 875-884.

DOI

[40]
Wang S, Liu J, Wang J et al., 2019b. Evaluation of GPM IMERG V05B and TRMM 3B42V7 precipitation products over high mountainous tributaries in Lhasa with dense rain gauges. Remote Sensing, 11(18): 2080.

DOI

[41]
Wang X, Ding Y, Zhao C et al., 2019c. Similarities and improvements of GPM IMERG upon TRMM 3B42 precipitation product under complex topographic and climatic conditions over Hexi region, northeastern Tibetan Plateau. Atmospheric Research, 218: 347-363.

DOI

[42]
Xu J J, Wang K L, Jiang H et al., 2010. A numerical simulation of the effects of Westerly and Monsoon on precipitation in the Heihe River basin. Journal of Glaciology and Geocryology, 32: 489-496.

[43]
Xu R, Tian F, Yang L et al., 2017. Ground validation of GPM IMERG and TRMM 3B42V7 rainfall products over southern Tibetan Plateau based on a high-density rain gauge network. Journal of Geophysical Research: Atmospheres, 122(2): 910-924.

[44]
Yang Y, Chen R S, Song Y X et al., 2018. Comparison of precipitation and evapotranspiration of five different land-cover types in the high mountainous region. Sciences in Cold and Arid Regions, 9(6): 534-542.

[45]
Yi L, Zhang W, Wang K, 2018. Evaluation of heavy precipitation simulated by the WRF model using 4D-Var data assimilation with TRMM 3B42 and GPM IMERG over the Huaihe River Basin, China. Remote Sensing, 10(4): 646.

DOI

[46]
Yong B Ren, Hong Y et al., 2010. Hydrologic evaluation of multisatellite precipitation analysis standard precipitation products in basins beyond its inclined latitude band: A case study in Laohahe basin, China. Water Resources Research, 46: W07542.

[47]
Yuan F, Zhang L, Win K et al., 2017. Assessment of GPM and TRMM multi-satellite precipitation products in streamflow simulations in a data-sparse mountainous watershed in Myanmar. Remote Sensing, 9: 302.

DOI

[48]
Zhang C, Chen X, Shao H et al., 2018a. Evaluation and intercomparison of high-resolution satellite precipitation estimates-GPM, TRMM, and CMORPH in the Tianshan Mountain Area. Remote Sensing, 10(10): 1543.

DOI

[49]
Zhang M, Chen Y, Shen Y et al., 2019. Tracking climate change in Central Asia through temperature and precipitation extremes. Journal of Geographical Sciences, 29(1): 3-28.

DOI

[50]
Zhang Q, Yu Y X, Zhang J, 2008. Characteristics of water cycle in the Qilian Mountains and the oases in Hexi inland river basins. Journal of Glaciology and Geocryology, 30: 907-913.

[51]
Zhang S, Wang D, Qin Z et al., 2018b. Assessment of the GPM and TRMM precipitation products using the rain gauge network over the Tibetan Plateau. Journal of Meteorological Research, 32(2): 324-336.

DOI

[52]
Zhao Y, Chen R, Han C et al., 2021. Correcting precipitation measurements made with Geonor T-200B weighing gauges near the August: One ice cap in the Qilian Mountains, Northwest China. Journal of Hydrometeorology, 22(8): 1973-1985.

[53]
Zheng Q, Chen R S, Han C T et al., 2018. Adjusting precipitation measurements from the TRwS204 automatic weighing gauge in the Qilian Mountains, China. Journal of Mountain Science, 15(11): 2365-2377.

DOI

Outlines

/