
Journal of Geographical Sciences >
Classification and detection of dominant factors in geospatial patterns of traditional settlements in China
|
Wu Shaolin (1997-), PhD Candidate, specialized in settlement environment. E-mail: wushaolin@stu.scu.edu.cn |
Received date: 2020-12-05
Accepted date: 2021-08-12
Online published: 2022-07-25
Supported by
National Key Research and Development Program of China(2020YFD1100701)
Social Science Research “14th Five-Year Plan” 2021 Project of Sichuan Province(SC21ST001)
Strategic Priority Research Program of the Chinese Academy of Sciences(XDA23090502)
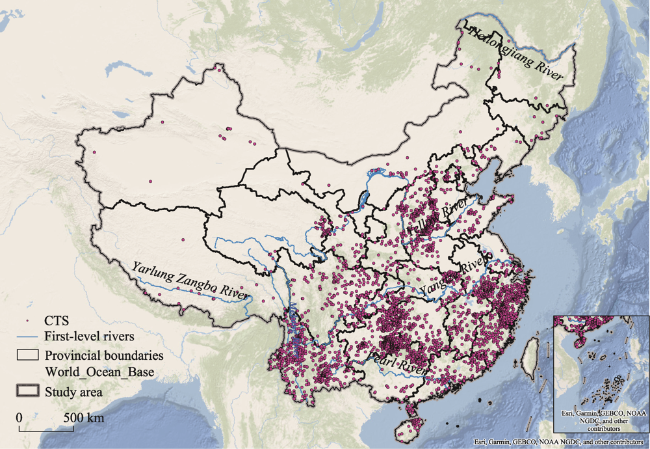
The geospatial distribution pattern in traditional Chinese settlements (TCSs) reflects the traditional harmony between humans and nature, which has been learned over centuries. However, TCSs have experienced serious disturbances by urbanization and migration. It is crucial to explore the local wisdom of geospatial patterns and dominant factors for TCSs at the national scale in China. This study sought to determine the geospatial wisdom of traditional settlements to enrich our future settlement development with the aim of establishing Chinese settlement values for modern living. Herein, a dataset of 4000 TCSs were analyzed and clustered for environmental factors that affect their geospatial patterns by machine learning algorithms. We concluded that (1) five geospatial patterns of TCSs were clustered on a national scale, and the threshold of environmental factors of TCS groups was detected. (2) Environmental conditions and settlement concepts interacted and determined the similarities and differences among TCS groups. (3) The key boundary for TCSs and the dominant factors for each zone were determined, and topographical conditions and hydrologic resources played significant roles in all five TCS zones. This study provides a better understanding of the adaptability of the environment in relation to the TCSs and aids in planning TCS conservation and rural revitalization.
WU Shaolin , DI Baofeng , Susan L. USTIN , Constantine A. STAMATOPOULOS , LI Jierui , ZUO Qi , WU Xiao , AI Nanshan . Classification and detection of dominant factors in geospatial patterns of traditional settlements in China[J]. Journal of Geographical Sciences, 2022 , 32(5) : 873 -891 . DOI: 10.1007/s11442-022-1976-7
Figure 1 Study area and distribution of TCS |
Table 1 Data description and data source |
| Types | Factors | Unit | Description | Data resource |
|---|---|---|---|---|
| Topographical factors | ELE | m | Digital Elevation Model (DEM), 30m resolution basic topographical map of China | SRTM (shuttle radar topography mission) |
| SLOPE | ° | Raster data of slope | Slope conversion from DEM data (by ArcGIS platform) | |
| Meteorological factors | TEM | ℃ | Average annual temperature, 5-year average of meteorological station data (2013-2017) | National Meteorological Information Center (http://data.cma.cn) |
| EVP | mm | Average annual evaporation, 5-year average of meteorological station data (2013-2017) | National Meteorological Information Center (http://data.cma.cn) | |
| PRE | mm | Average annual precipitation, 5-year average of meteorological station data (2013-2017) | National Meteorological Information Center (http://data.cma.cn) | |
| APR | 100Pa | Average annual atmospheric pressure, 5-year average of meteorological station data (2013-2017) | National Meteorological Information Center (http://data.cma.cn) | |
| RHU | % | Average annual air humidity, 5-year average of meteorological station data (2013-2017) | National Meteorological Information Center (http://data.cma.cn) | |
| SSD | h | Average annual sunshine duration, 5-year average of meteorological station data (2013-2017) | National Meteorological Information Center (http://data.cma.cn) | |
| Natural resources | NDVI | - | Average annual Normalized Vegetation Index (2018) | Resource and Environment Data Center (Xu, 2018) |
| HDR | m | Vector data of river in the study area (distance from river in meters) | Resource and Environment Data Center | |
| S_BD | g·cm‒3 | Soil Bulk Density | Cold and Dry Area Scientific Data Center (http://westdc.westgis.ac.cn/) | |
| S_OC | %(weight) | Soil Organic Carbon Content | Cold and Dry Area Scientific Data Center (http://westdc.westgis.ac.cn/) | |
| S_EC | dS·m‒1 | Soil Conductivity | Cold and Dry Area Scientific Data Center (http://westdc.westgis.ac.cn/) |
Table 2 SC value of clustering algorithm |
| Clustering number | 2 | 3 | 4 | 5 | 6 | 7 | 8 |
|---|---|---|---|---|---|---|---|
| K-Means | 0.3113 | 0.2805 | 0.2987 | 0.3119 | 0.2771 | 0.2619 | 0.2751 |
| Hierarchy | 0.2935 | 0.2653 | 0.2877 | 0.3002 | 0.3105 | 0.2575 | 0.2335 |
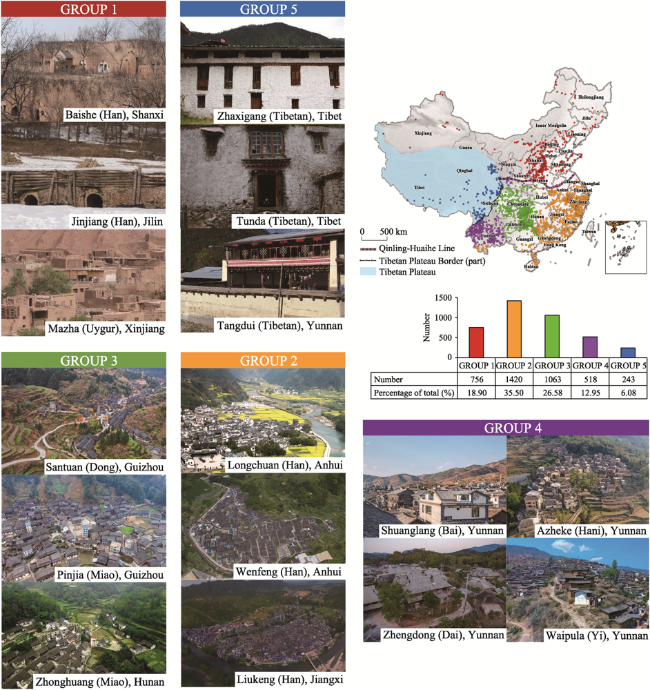
Figure 2 Five groups of TCS and sample photos of each group. (The legend of sample photos includes the name, main ethnic residents and province of sample TCS. Photo source: Traditional Chinese Settlements Digital Museum, http://www.dmctv.cn/prevue.aspx) |
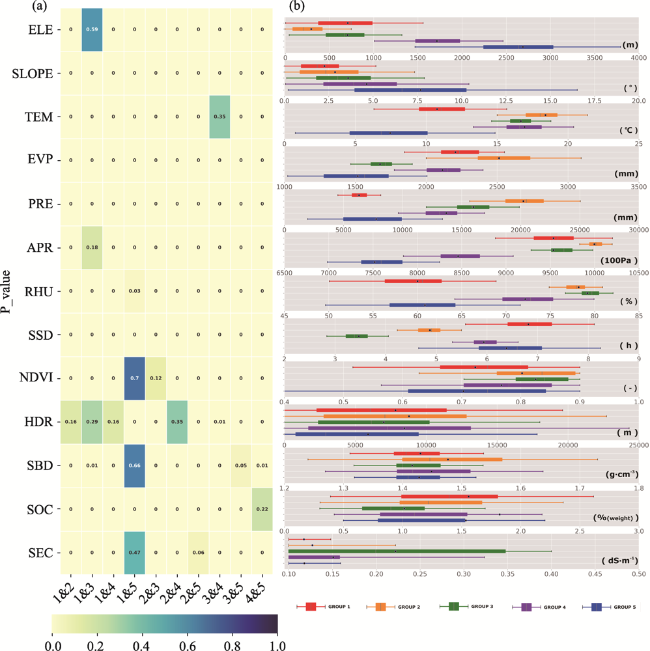
Figure 3 Similarities and differences of the environmental factors on TCS groups |
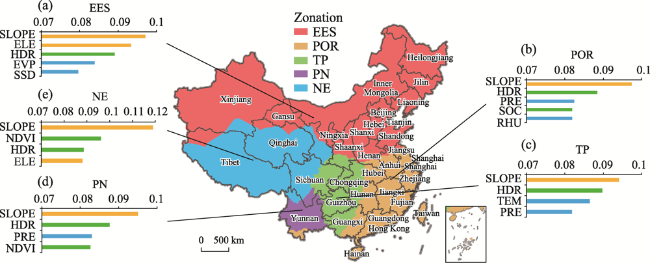
Figure 4 Map showing dominant factors per TCS zone. See Table 1 for list of factors. |
| [1] |
|
| [2] |
|
| [3] |
|
| [4] |
|
| [5] |
|
| [6] |
|
| [7] |
|
| [8] |
|
| [9] |
|
| [10] |
|
| [11] |
|
| [12] |
|
| [13] |
|
| [14] |
|
| [15] |
|
| [16] |
|
| [17] |
|
| [18] |
|
| [19] |
|
| [20] |
|
| [21] |
|
| [22] |
|
| [23] |
|
| [24] |
|
| [25] |
|
| [26] |
|
| [27] |
|
| [28] |
|
| [29] |
|
| [30] |
|
| [31] |
|
| [32] |
|
| [33] |
|
| [34] |
|
| [35] |
|
| [36] |
|
| [37] |
|
| [38] |
|
| [39] |
|
| [40] |
|
| [41] |
|
| [42] |
|
| [43] |
|
| [44] |
|
| [45] |
|
| [46] |
|
| [47] |
|
| [48] |
|
| [49] |
|
| [50] |
|
| [51] |
|
| [52] |
|
| [53] |
|
| [54] |
|
| [55] |
|
| [56] |
|
| [57] |
|
| [58] |
|
| [59] |
|
| [60] |
|
| [61] |
|
| [62] |
|
| [63] |
|
| [64] |
|
| [65] |
|
| [66] |
|
| [67] |
|
| [68] |
|
| [69] |
|
| [70] |
|
| [71] |
|
| [72] |
|
| [73] |
|
| [74] |
|
| [75] |
|
| [76] |
|
| [77] |
|
| [78] |
|
| [79] |
|
| [80] |
|
| [81] |
|
| [82] |
|
| [83] |
|
| [84] |
|
| [85] |
|
| [86] |
|
| [87] |
|
| [88] |
|
| [89] |
|
| [90] |
|
| [91] |
|
| [92] |
|
| [93] |
|
| [94] |
|
| [95] |
|
| [96] |
|
| [97] |
|
| [98] |
|
| [99] |
|
/
| 〈 |
|
〉 |