
Journal of Geographical Sciences >
Spatial heterogeneity of the economic growth pattern and influencing factors in formerly destitute areas of China
|
Yin Jiangbin (1985-), PhD and Associate Professor, specialized in urban geography and economic geography. E-mail: yjbin401@163.com |
Received date: 2021-07-29
Accepted date: 2021-12-20
Online published: 2022-07-25
Supported by
National Natural Science Foundation of China(42071213)
National Natural Science Foundation of China(41871168)
National Natural Science Foundation of China(41831284)
Accelerating economic growth in formerly destitute areas and narrowing the economic gap with other regions are essential tasks for poverty alleviation in China after 2020. In this study, the spatio-temporal characteristics of economic growth in 14 formerly destitute areas of China were identified. Moreover, the spatial heterogeneity of various influencing factors was analyzed using a geographically weighted regression model. The results were as follows: (1) The economic level of the formerly destitute areas was low, but their economies grew rapidly after 2011, with annual per capita GDP growth of 10.54% until 2018, higher than the national average of 9.14%. Western and southern counties grew faster economically than central and northern counties. (2) The impact of various factors on the economic growth of counties exhibited clear spatial heterogeneity. The influences of secondary industry growth and level of financial development on economic growth were mainly positive, whereas the effects of initial economic level and market location were mainly negative. (3) Six economic growth driving modes were identified for the 14 contiguous destitute areas, among which the secondary industry-driven mode was the most common. The study can serve as a scientific reference for differentiating regional policies.
YIN Jiangbin , LI Shangqian , ZHOU Liang , JIANG Lei , MA Wei . Spatial heterogeneity of the economic growth pattern and influencing factors in formerly destitute areas of China[J]. Journal of Geographical Sciences, 2022 , 32(5) : 829 -852 . DOI: 10.1007/s11442-022-1974-9
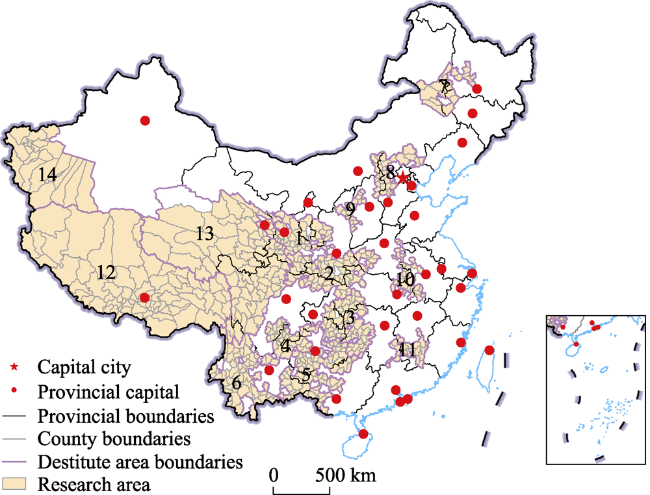
Figure 1 Spatial distribution of 14 contiguous destitute areas in China (1. Liupan Mountain area; 2. Qinba Mountain area; 3. Wuling Mountain area; 4. Wumeng Mountain area; 5. Dian-Gui-Qian Rocky Desert area; 6. Western Yunnan Border Mountain area; 7. Southern Da Hinggan area; 8. Yanshan-Taihang Mountain area; 9. Luliang Mountain area; 10. Dabie Mountain area; 11. Luoxiao Mountain area; 12. Tibet; 13. Tibetan areas of four provinces; 14. Three prefectures of southern Xinjiang) |
Table 1 Variable definitions and descriptive statistics |
| Variable | Definition | Mean | SD | VIF |
|---|---|---|---|---|
| Economic growth | Average annual growth rate of per capita GDP from 2011 to 2018 (%) | 10.5 | 4.5 | - |
| Initial economic level | Per capita GDP in 2011 (yuan) | 13065.2 | 12694.9 | 1.1 |
| Secondary industry growth | The difference in the proportion of secondary industry in GDP between 2011 and 2018 (%) | 1.8 | 10.9 | 2.6 |
| Tertiary industry growth | The difference in the proportion of tertiary industry in GDP between 2011 and 2018 (%) | 6.3 | 9.4 | 2.6 |
| Agriculture mechanization | Average annual growth rate of total agricultural machinery power from 2011 to 2018 (%) | 4.6 | 8.6 | 1.1 |
| Capital investment | Average annual growth rate of fixed asset investment from 2011 to 2018 (%) | 17.8 | 18.9 | 1.1 |
| Financial development | Average annual growth rate of loans issued by financial institutions from 2011 to 2018 (%) | 19.7 | 11.1 | 1.2 |
| Government expenditure | Average annual growth rate of public finance expenditure from 2011 to 2018 (%) | 12.4 | 8.8 | 1.1 |
| Precipitation | Average annual precipitation (mm) | 877.3 | 526.8 | 1.2 |
| Market location | Distance to provincial capital or regional megacities (km) | 339.5 | 254.3 | 1.2 |
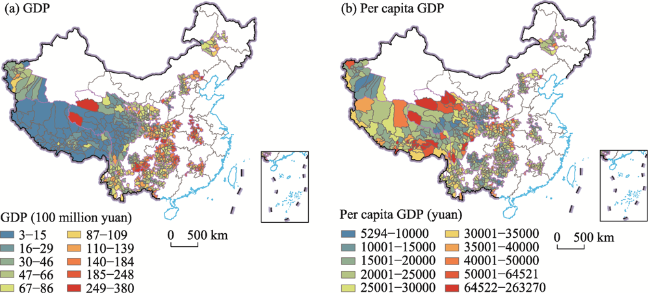
Figure 2 Economic distribution in the contiguous destitute areas at the county level in China in 2018 |
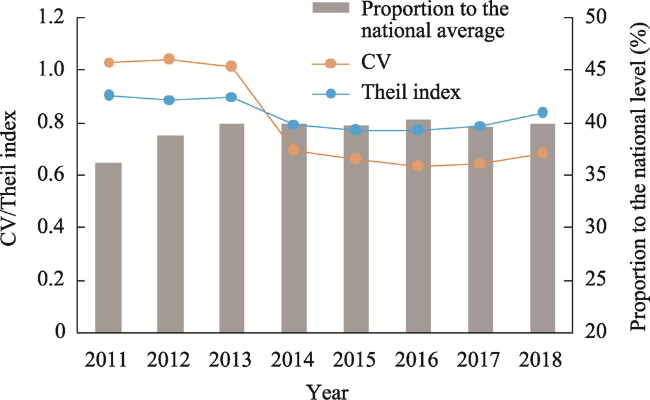
Figure 3 Economic disparity in formerly destitute areas of China from 2011 to 2018 |
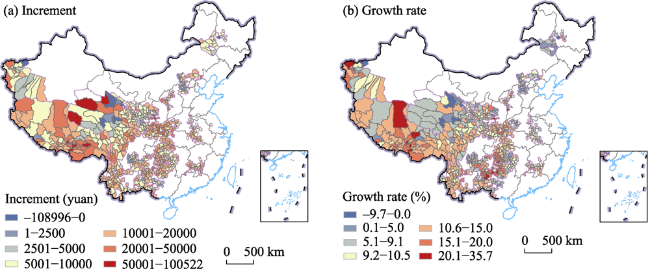
Figure 4 Economic growth pattern in formerly destitute areas of China at the county level from 2011 to 2018 |
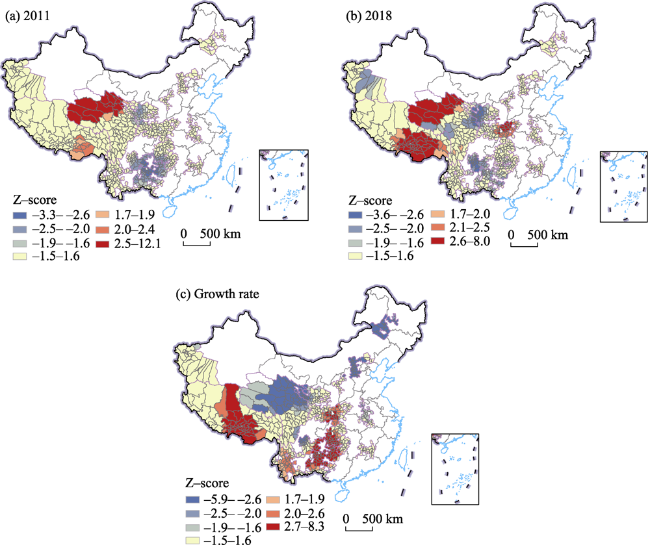
Figure 5 Spatial pattern in the Getis-Ord Gi*of per capita GDP in formerly destitute areas of China |
Table 2 Comparison of the OLS and GWR models |
| RSS | AICc | R2 | Adjusted R2 | |
|---|---|---|---|---|
| OLS | 4.0840 | -1490.1014 | 0.2996 | 0.2889 |
| GWR | 1.9887 | -1609.5924 | 0.6589 | 0.5275 |
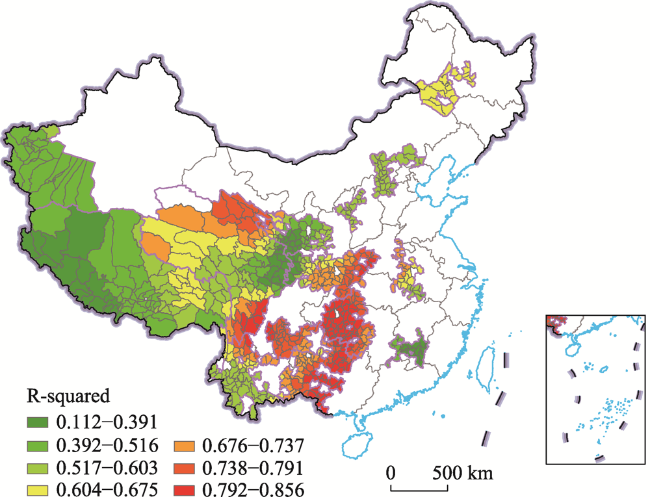
Figure 6 R2 spatial distribution of GWR model |
Table 3 Descriptive statistics of regression coefficients obtained using the GWR model |
| Variables | Min | Median | Max | Mean | Positive (%) | Negative (%) |
|---|---|---|---|---|---|---|
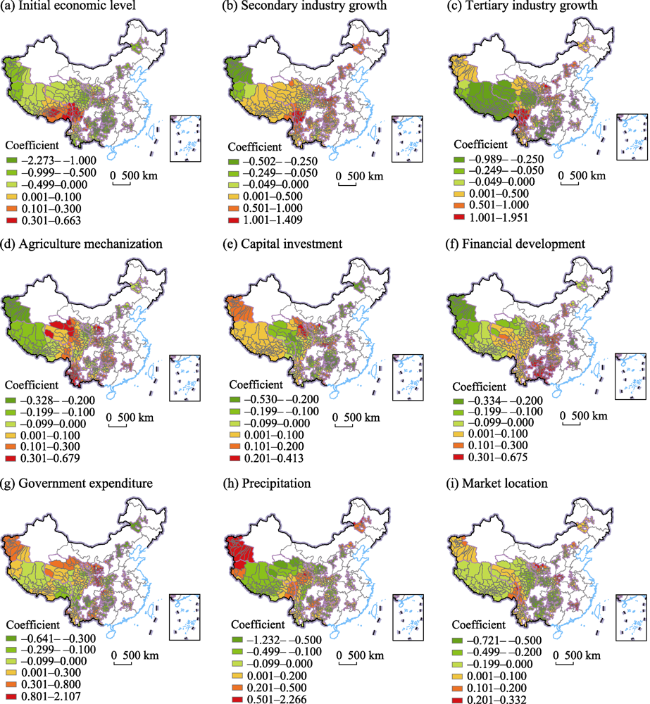
| Initial economic level | -2.273 | -0.292 | 0.663 | -0.387 | 22.12 | 77.88 |
| Secondary industry growth | -0.502 | 0.375 | 1.409 | 0.418 | 92.08 | 7.92 |
| Tertiary industry growth | -0.989 | 0.054 | 1.951 | 0.081 | 54.56 | 45.44 |
| Agriculture mechanization | -0.328 | 0.007 | 0.679 | 0.036 | 53.06 | 46.94 |
| Capital investment | -0.530 | -0.001 | 0.413 | -0.051 | 49.18 | 50.82 |
| Financial development | -0.334 | 0.063 | 0.675 | 0.089 | 69.96 | 30.04 |
| Government expenditure | -0.641 | 0.031 | 2.107 | 0.077 | 58.30 | 41.70 |
| Precipitation | -1.232 | 0.001 | 2.266 | 0.044 | 50.67 | 49.33 |
| Market location | -0.721 | -0.101 | 0.332 | -0.118 | 35.43 | 64.57 |
Figure 7 Spatial distribution of regression coefficients of various factors in GWR model |
Table 4 County distribution of dominant factors affecting economic growth in formerly destitute areas of China |
| SIG | TIG | AM | CI | FD | GE | PRE | ML | |
|---|---|---|---|---|---|---|---|---|
| Number of counties | 259 | 259 | 12 | 6 | 19 | 54 | 51 | 9 |
| Proportion/% | 38.7 | 38.7 | 1.8 | 0.9 | 2.8 | 8.1 | 7.6 | 1.3 |
Note: SIG: secondary industry growth; TIG: tertiary industry growth; AM: agriculture mechanization; CI: capital investment; FD: financial development; GE: government expenditure; PRE: precipitation; ML: market location. |
Table 5 Driving modes of economic growth in 14 contiguous destitute areas of China |
| Areas | SID | TID | STID | TIC | WRD | SIGD |
|---|---|---|---|---|---|---|
| Liupan Mountain area | ● | |||||
| Qinba Mountain area | ● | |||||
| Wuling Mountain area | ● | |||||
| Wumeng Mountain area | ● | |||||
| Dian-Gui-Qian Rocky Desert area | ● | |||||
| Western Yunnan Border Mountain area | ● | |||||
| Southern Da Hinggan area | ● | |||||
| Yanshan-Taihang Mountain area | ● | |||||
| Luliang Mountain area | ● | |||||
| Dabie Mountain area | ● | |||||
| Luoxiao Mountain area | ● | |||||
| Tibet | ● | |||||
| Tibetan areas of four provinces | ● | |||||
| Three prefectures of southern Xinjiang | ● |
Note: SID: secondary industry-driven mode; TID: tertiary industry-driven mode; STID: secondary and tertiary industry-driven mode; TIC: tertiary industry-constrained mode; WRD: water resource-driven mode; SIGD: secondary-industry-government-driven mode. |
| [1] |
|
| [2] |
|
| [3] |
|
| [4] |
|
| [5] |
|
| [6] |
|
| [7] |
|
| [8] |
|
| [9] |
|
| [10] |
|
| [11] |
Economic Growth Frontier Subject Team (EGFST), 2005. High growth of investment, macro-cost and the sustainability of economic growth. Economic Research Journal, (10): 12-23. (in Chinese)
|
| [12] |
|
| [13] |
|
| [14] |
|
| [15] |
|
| [16] |
|
| [17] |
|
| [18] |
|
| [19] |
|
| [20] |
|
| [21] |
Institute of Party History and Literature of the CPC Central Committee, 2018. Excerpts from Xi Jinping’s Treatise on Poverty Alleviation. Beijing: Central Party Literature Press: 55-84. (in Chinese)
|
| [22] |
|
| [23] |
|
| [24] |
|
| [25] |
|
| [26] |
|
| [27] |
|
| [28] |
|
| [29] |
|
| [30] |
|
| [31] |
|
| [32] |
|
| [33] |
|
| [34] |
|
| [35] |
|
| [36] |
|
| [37] |
|
| [38] |
|
| [39] |
|
| [40] |
|
| [41] |
|
| [42] |
|
| [43] |
|
| [44] |
|
| [45] |
|
| [46] |
|
| [47] |
|
| [48] |
|
| [49] |
|
| [50] |
|
| [51] |
|
| [52] |
|
| [53] |
|
| [54] |
|
| [55] |
|
| [56] |
|
| [57] |
|
| [58] |
|
| [59] |
|
| [60] |
|
| [61] |
|
| [62] |
|
/
| 〈 |
|
〉 |