Research Articles

Spatial expansion effects on urban ecosystem services supply-demand mismatching in Guanzhong Plain Urban Agglomeration of China

  • PENG Lixian , 1 ,
  • ZHANG Liwei , 1, * ,
  • LI Xupu 1 ,
  • WANG Zhuangzhuang 2 ,
  • WANG Hao 1 ,
  • JIAO Lei 1
Expand
  • 1. Department of Geography, School of Geography and Tourism, Shaanxi Normal University, Xi’an 710119, China
  • 2. State Key Laboratory of Urban and Regional Ecology, Research Center for Eco-Environmental Sciences, CAS, Beijing 100085, China
* Zhang Liwei (1985-), Associate Professor, specialized in ecosystem services. E-mail:

Peng Lixian (1998-), Master Candidate, specialized in ecosystem services mapping and modeling. E-mail:

Received date: 2021-06-10

  Accepted date: 2021-12-01

  Online published: 2022-07-25

Supported by

National Natural Science Foundation of China(41871187)

Natural Science Basic Research Plan in Shaanxi Province of China(2020JQ415)

Abstract

Global urbanization has led to drastic land use change, interfering the ecosystem services (ES) supply-demand balance, in turn threatening the well-being of humans. However, existing studies mainly stranded at the historical and current analysis, and the effects of urban spatial expansion on the relationship between ES supply and demand in the future are less clear, in particular at an urban agglomeration scale. This study was constructed with a framework of assessing the effects of urban spatial expansion on ES supply-demand mismatching under different future scenarios in the Guanzhong Plain Urban Agglomeration (GPUA) by using the Future Land Use Simulation (FLUS) model and expert-based Land-Use and Land-Cover Change (LUCC) matrix. The results showed that: (1) Urban expansion is significant in the natural development (ND) scenario, mainly manifesting the great transfer of dry land to construction land. (2) The gap between total ES supply and demand is narrowed from 2000 to 2030 and the mismatch between ES supply and demand is mainly reflected in the spatial distribution pattern in the GPUA. The ES budgets were in high surplus in Northern Qinling Mountains and northeast mountain areas, while they were in severe deficit in urban center areas. The budgets deficit under the ND scenario in 2030 is the most severe. (3) The gradient differences of ES budgets of the GPUA between urban centers and suburbs increase from 2000 to 2030 under two scenarios. The deficit region expands largest under ND scenario. The findings revealed that ES declining and supply-demand mismatching were triggered by the drastic land-use change driven by rapid urban expansion. The expansion has brought about an increasing material demand and growing industries, threatening the sustainability of ecosystems. Scenarios setting could contribute to coordinating the relationship between future urban development and ecological protection, and the policy strategies proposed in the study could inform ecological management and urban planning in the regions facing the similar urbanization situation.

Cite this article

PENG Lixian , ZHANG Liwei , LI Xupu , WANG Zhuangzhuang , WANG Hao , JIAO Lei . Spatial expansion effects on urban ecosystem services supply-demand mismatching in Guanzhong Plain Urban Agglomeration of China[J]. Journal of Geographical Sciences, 2022 , 32(5) : 806 -828 . DOI: 10.1007/s11442-022-1973-x

1 Introduction

Ecosystem services (ES) are the various benefits that people directly or indirectly derive from functioning ecosystems, which bridge the natural systems and socio-economic systems (MEA, 2005; Costanza et al., 2017). While the increasing human activity and the intensity of climate change have been profoundly altering the structure and function of the ecosystems worldwide, threatening the sustainable provision of ecosystem services upon with we depend (IPBES, 2019). Recently, a global assessment on ES and biodiversity reported that approximately 78% benefits human beings obtain from nature have declined rapidly (IPBES, 2019). It also indicated that cities are the most prominent areas of imbalance between ES supply and demand in the world due to the global urbanization (Liu et al., 2019b; Wang et al., 2020). Here, ES supply refers to the capacity of ecosystems to provide services to human beings, and demand includes the amount of services that human society desire (Burkhard et al., 2014; Zhang et al., 2014; Wolff et al., 2015). In the past few decades, land use change has been considered the most dominant and direct manifestation of large-scale urban spatial expansion, drastic land use change not only affects the capacity of ecosystems to provide services, but also alter the demand patterns (Maimaiti et al., 2021; Puplampu and Boafo, 2021; Zhou et al., 2022). In the meanwhile, the accompanying rapid growth of population and the continuous development of social economy have led to a sharp increase in the demand for ES (Wang et al., 2021b), resulting in ES supply-demand mismatch (MEA, 2005). Therefore, it is imperative to assess the effects of urban spatial expansion on ES supply-demand mismatching for optimizing urban planning and resource management (Fu and Zhang, 2014; Cao et al., 2021; Xin et al., 2021).
In recent years, quantitative assessment of ES supply and demand and depicting the relationships between them have become crucial issues when researching the interaction between humans and natural ecosystems in terms of ecological security and human well-being (Ma et al., 2017; Zhao et al., 2018; Zoe et al., 2018; Schirpke et al., 2019). Coupling ES supply and demand is complex and systematic, as the realization of ES not only depends on the structure and functions of ecosystems, but upon human needs and preferences (Maron et al., 2017). For instance, benefits of fresh water supply service to people are conditional on both the presence of ecosystems that can retain water and population and infrastructure (e.g., pipelines) making fresh water available for human beings. For decision-makers, they need to understand not only how the supply capacity of ecosystems to provide ES in management areas develop, but also whether the supply of ES can meet the demand in the long run, especially in rapidly expanding urban regions under urgent pressure (Peng et al., 2020a; Maimaiti et al., 2021; Zhou et al., 2022). Existing quantitative assessment on ES have undergone rapid development, moving from a focus on ES supply to the interaction between ES supply and demand (Schirpke et al., 2019; Xu et al., 2019; Ouyang et al., 2021). However, existing studies have focused more on what consequences the urban spatial expansion will have on the relationship between current ES supply and demand at the city or watershed scale, yet the spatio-temporal pattern of ES supply and demand at the scale of urban agglomeration and whether the ES supply and demand match in the future are less clear.
Quantitative assessments of ES supply and demand form the basis for depicting their relationships. To date, the methods for quantifying ES supply and demand include land use estimation method (Schroter et al., 2014), ecological process simulation method (Stuerck et al., 2014), spatially overlaying data method (Serna-Chavez et al., 2014) and discriminant method based on expert experience (Cao et al., 2021). Derived from the expert experience, the expert-based Land-Use and Land-Cover Change (LUCC) matrix proposed by Burkhard et al. (2012) has been widely used to quantify ES supply and demand in different areas at multiple scales for its simplicity and high efficiency of operation and reliability of results (Bicking et al., 2018; Liu et al., 2019a; Guo et al., 2020). Different land use structures engender different ecological processes, leading to various ecological pattern and changes in the supply of ES (Fu et al., 2013; Wu et al., 2019; Li et al., 2020b). Moreover, the land-use change caused by rapid urban expansion has intensified the supply-demand imbalance (Zhang et al., 2021). Therefore, understanding the ES supply-demand relationships under different land use change scenarios is critical for land resources planning and ecological management. The Future Land Use Simulation (FLUS) model proposed by Liu et al. (2017) was employed in this study to accurately simulate the interaction and spatial dynamics of multiple land use changes, which has been widely used to simulate the change and the projection of various land use and land coverage (Hu et al., 2020; Pan et al., 2020; Tan et al., 2020), as well as the ES supply-demand relationship simulation. The future scenario perspective adopted in this research is aiming to inform the formulation of regional sustainable development strategies in the long run.
Located in the heart of China’s interior, the Guanzhong Plain Urban Agglomeration (GPUA) is an important gateway to the eastern and central parts in western China. It is also a crucial fulcrum of the Asia-Europe Continental Bridge. Ever since the “Silk Road Economic Belt” and “21st Century Maritime Silk Road” initiatives were proposed, the GPUA has played a strategic role in leading the development of the central and western regions in China (Ma et al., 2020). However, the GPUA has undergone drastic augment in population and accelerated urbanization process over the past two decades, hence the sustainability of the socio-ecological environment has been greatly affected. Besides, land use change driven by rapid urban expansion has caused the spatio-temporal mismatch between ES supply and demand and in turn intensified the supply-demand imbalance (Liu et al., 2019b; Wang et al., 2020), which may affect the supply-demand relationships and human well-being in the future (Wu et al., 2019). Given above, the GPUA was taken as a case study to: (i) analyze the land use change in the past nineteen years (from 2000 to 2018) and simulate the future land use pattern arisen by urban spatial expansion under two scenarios of natural development (ND) and the ecological protection (EP) of 2030; (ii) explore the spatio-temporal heterogeneity and the quantitative change of ES supply, demand, and budgets in urban-suburb in the past period and future scenarios; (iii) explore the driving mechanism underlying urban spatial expansion effects on the supply-demand relationships in the past-future and the revelatory significance of scenario setting as well as discuss optimal management strategies for sustainable urban development and ecological security.

2 Materials and methods

2.1 Study area

The GPUA, located in central China (Figure 1a), covers an area of 1.071×10⁵ km2 (Wei et al., 2019). The GPUA has a great diversity in topography: the arid plateau in the northwest, the Zhongtiao Mountain in the northeast, the Guanzhong Plain in the center and Northern Qinling Mountains in the south (Figure 1). The northern and central parts of the study area are inland at mid-latitudes, with a predominant warm-temperate continental monsoon climate, while Northern Qinling Mountains in the south are temperate and medium-temperate climate (Wang et al., 2020). The GPUA with up to 60% of urbanized area had 44.09 million permanent residents at the end of 2017 (Yang and Cai, 2020). With Xi’an city as the center, the study area is surrounded by 10 prefecture-level cities (Figure 1b). Accelerated urban spatial expansion has led to drastic land use changes, resulting in an increase in artificial surface area and disturbance of ecosystems. Hence, some eco-environmental problems such as water scarcity, water pollution and soil erosion in the GPUA have become increasingly prominent. These will exacerbate the ES supply-demand imbalance and threaten the well-being of residents in the study area.
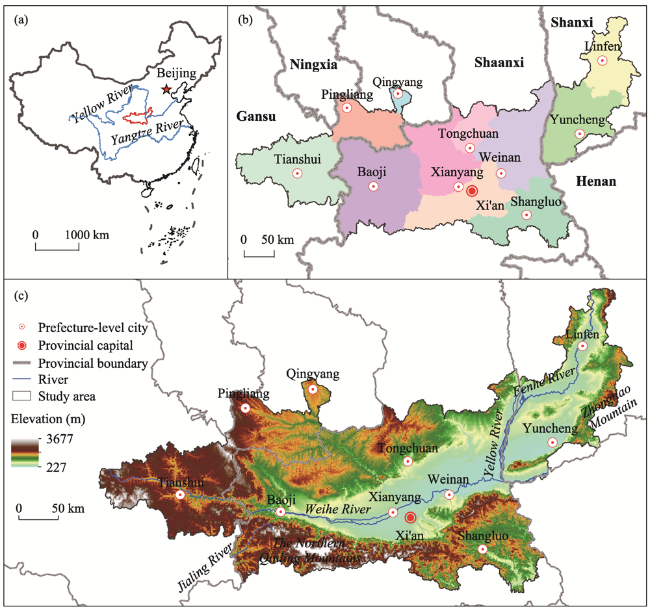
Figure 1 Overview of Guanzhong Plain Urban Agglomeration: (a) location in China; (b) administrative divisions; (c) elevation

2.2 Data sources

The datasets used in this study includes (Table 1):
Table 1 List of data and data sources in this study
Category Data Data type Data source
Land use Land-use data in 2000, 2010, 2015 and 2018 Raster (1 km) CAS (http://www.resdc.cn)
Socioeconomic data GDP in 2015 Raster (1 km) CAS (http://www.resdc.cn)
Population density in 2015 Raster (1 km)
Transportation City center Vector CAS (http://www.resdc.cn)
County center Vector
National highway Vector
Provincial highway Vector
Expressway Vector
Drainage system Vector
Railway Vector
Toll stations Vector
Bus stations Vector
Meteorological data Annual precipitation Raster (1km) CAS (http://www.resdc.cn)
Annual average temperature Raster (1km)
Terrain DEM Raster (1km) CAS (http://www.resdc.cn)
Slope Raster (1 km)
Aspect Raster (1 km)
Ecological data National nature reserve Vector CAS (http://www.resdc.cn)
Local nature reserve Vector
Key ecological function area Vector
Important ecological function area Vector
(1) The Land-use data at 1 km resolution were collected from China Land Use Status Remote Sensing Monitoring Databases in Resource and Environment Science and Data Center (https://www.resdc.cn/). The database established with landsat remote sensing image data from the U.S. land satellite as the primary information source obtained through manual visual interpretation, were proven to be the most accurate land use remote sensing monitoring data product in China (Lu et al., 2021; Ren et al., 2021). This datasets have played an important role in the national land resource survey, hydrology and ecological research (Ren et al., 2021). The land use classification of the study area followed the land use data classification standard of the Chinese Academy of Sciences (CAS) (Table A1).
(2) Population density and GDP spatial distribution datasets were from Resource and Environment Science and Data Center (https://www.resdc.cn/), which was expressed in units of persons per km2 and ten thousand yuan per km2, respectively.
(3) DEM (Digital Elevation Model) data were generated based on the latest SRTM Version 4.1 data resampled from the Resource and Environment Science and Data Center (https://www.resdc.cn/). And the Slope and Aspect data were created from DEM data with the spatial analyst tools in the software ArcGIS.
(4) Meteorological data were interpolated by ANUSPLIN interpolation software based on observation data from more than 2400 meteorological stations from Resource and Environment Science and Data Center (https://www.resdc.cn/), including annual average temperature and annual precipitation. The unit of annual average temperature data and annual precipitation data is 0.1°C and 0.1 mm, respectively. The ANUSPLIN interpolation software can perform reasonable statistical analysis and data diagnosis and depict the spatial distribution of meteorological data to achieve the function of spatial interpolation.

2.3 Methods

The research framework in this study was developed for identifying the effects of urban spatial expansion on the ES supply-demand mismatching (Figure 2), consisting of three steps: (1) simulate future land use change under different scenarios by FLUS model; (2) select key ES types and spatially quantify ES supply and demand by expert-based LUCC matrix; (3) analyze the spatio-temporal characteristics of ES supply, demand, and their relationship and explore the effects of urban spatial expansion on the supply-demand relationship by gradient analysis.
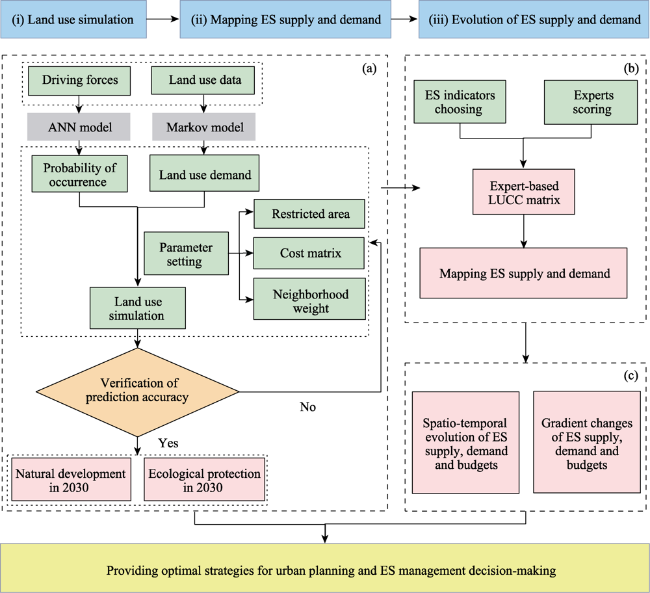
Figure 2 Research framework of the urban agglomeration spatial expansion on ES supply-demand mismatching

2.3.1 Land use change simulation

The future land use scenarios could be set as natural development scenarios, developed scenarios, planning scenarios, policy scenarios, etc. (Jiang et al., 2020; Zhang et al., 2020). Two future scenarios of natural development (ND) and ecological protection (EP) evolved from the scenarios above were proposed based on the current regional development goals in the study. In ND scenario, social development is in free and open style without policy restriction and manual intervention, while environmental protection is not considered; yet in EP scenario, the current ecological protecting measures were considered, including the national and local nature reserve, key ecological function zones, water bodies and wetlands in urban development. FLUS model was used to simulate the future land use under these two scenarios of the GPUA. FLUS model is operated under the coupling effects of human activities and natural factors in the future land use scenarios simulation (Liu et al., 2017; Zhang et al., 2020). To improve the simulation accuracy, the FLUS model combined the advantages of the system dynamics model and the cellular automata (CA) model, and introduced an adaptive inertial competition mechanism into the CA model to better process the complex competition between different land use types and interaction between them (Liu et al., 2020; Pan et al., 2020; Widaningrum et al., 2020). The main land use simulation processes were as follows:
Step 1: Running the ANN-based Probability-of-occurrence Estimation module. Firstly, the land use spatial distribution in 2018 was regarded as the base map of the training for acquiring occurring probability of each land use type. Then five natural and geographic factors (DEM, aspect, slope, annual precipitation, and annual average temperature), two socioeconomic factors (GDP and population), and nine layers of distance factors (distance to the city center, county center, national highway, provincial highway, railway, expressway, bus station, toll station and drainage system) were selected as driving factors of land use change. Among them, the distance factors were processed in software ArcGIS 10.2. It should be noted that all the driving force factors needed to be normalized and exported as raster data in TIF format. The sampling type was set to uniform sampling with the sampling rate and the hidden layer of 0.5% and 13, respectively.
Step 2: Running the Self-adaptive Inertia and Competition Mechanism CA module. In this module, the restricted transformation areas were set for EP scenarios, including national nature reserves, local nature reserves, important ecological function areas, key ecological function areas, water bodies and wetlands. By contrast, there were no restricted conversion areas set under the ND scenario. The future land use demand was obtained by Markov chain model. In response to the needs of urban spatial expansion, the actual construction land (refers to urban land, rural settlements and other construction sites in this study) was set to rarely converted to other types of land. With weighty and comprehensive consideration of the main situation of land use changes in the GPUA, the cost matrices (Table A2) and weight of neighborhood (Table A3) of each land use type under the ND scenario and the EP scenario were determined. For example, the conversion of construction land to other land use types was restricted due to the high cost of this conversion and the needs of urban spatial expansion in the GPUA.
Step 3: Future land use simulation. The land use data in 2018 as the initial year data and ANN-based Probability-of-occurrence data was input into the CA module to get the predicted land use in 2030 under the two scenarios (Hu et al., 2020). Then the FoM (Figure of Merit) index was used to verify the accuracy of the model, which has the advantages that avoid overrated verification (e.g., the kappa coefficient) (Chen et al., 2017; Li et al., 2020a).
Referring to the FLUS user’s guide, to validate the FoM index, land use data in 2018 was chosen as the subject of validation. Similarly, the land use was simulated in 2018 without any restricted conversion area. As mentioned in the above, firstly, the occurring probability data was obtained through the ANN-based Probability-of-occurrence Estimation module. The parameter settings and driving factors were the same as the ones listed in step 1. Then the Self-adaptive Inertia and Competition Mechanism CA module was running with the land use data in 2015 as the basic data. The cost matrix and weight of neighborhood of the different land use types were the same as those set under the ND scenario. Next the FoM index validation module was performed in FLUS model by inputting land use data in 2015 as start map. And then the simulated land use in 2018 and the actual data in 2018 (Figure A1) was input to get FoM values. The FoM value ranges from 0 to 1. The closer the value to 1, the higher the accuracy of the model simulation (Li et al., 2020a). In this study, the FoM index was 0.92 and the producer’s accuracy was 0.95, illustrating the high accuracy and applicability of Flus model in modelling the land use data for GPUA.

2.3.2 Expert-based LUCC matrix for mapping ES supply and demand

Based on experts’ knowledge and experience, the expert-based matrix assigned a value of 0-5 to represent the amount of ES supply / demand provided / desired by different land use types (Burkhard et al., 2012). ES defined in the Millennium Ecosystem Assessment (MEA, 2005) were comprised of the provisioning, regulating, cultural, and supporting services. Six types of provisioning services including crops, timber, energy, freshwater, biological products, and mineral resources; five types of regulating services including climate regulation, air quality regulation, water purification, erosion regulation, nature disaster regulation, and pollination while six types of cultural services consisting of leisure entertainment, landscape aesthetics, knowledge and education, cultural inheritance, and natural heritage were selected in this study. Then, the ES supply matrix (Figure 3) and demand matrix (Figure 4) were established, of which each key ES was assigned and calculate based on existing findings and expert knowledge (Burkhard et al., 2012; Wu et al., 2018; Liu et al., 2019a; Ji et al., 2020; Peng et al., 2020a; Cao et al., 2021). Finally, the ES supply, demand, and budgets were mapped based on the expert-based matrix and land use data.
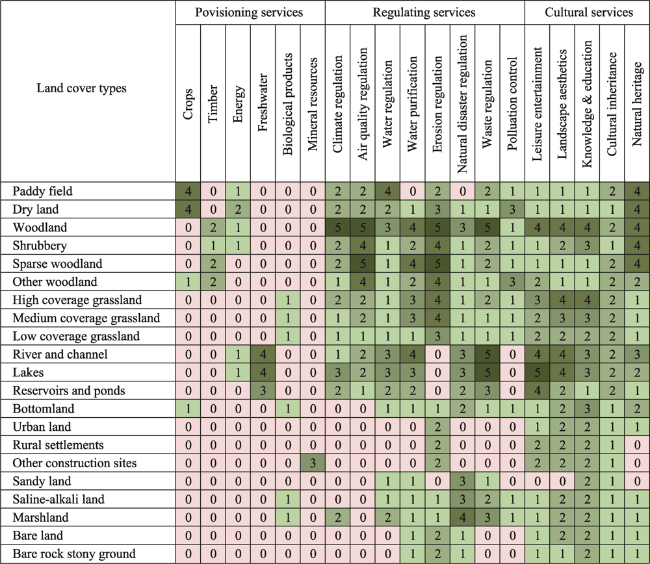
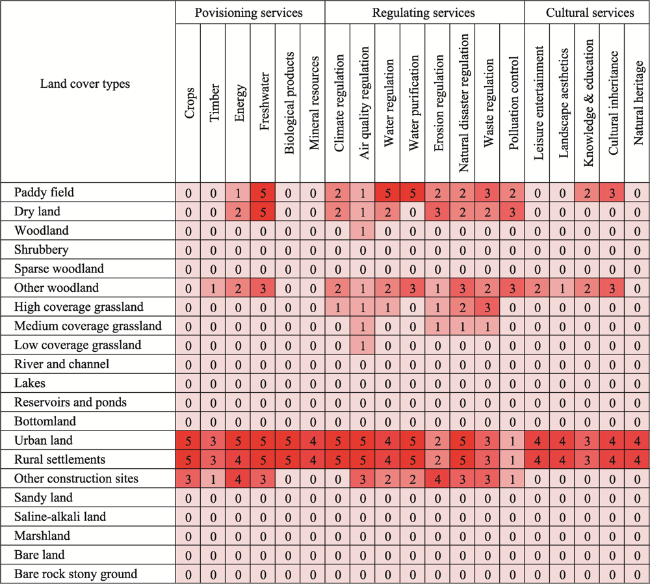
Figure 3 Expert-based LUCC matrix indicates the capacities of ecosystem supply. The meaning of values is as follows: 0 = no relevant supply; 1 = low relevant supply; 2 = relevant supply; 3 = medium relevant supply; 4 = high relevant supply; and 5 = very high relevant supply.
Figure 4 Expert-based LUCC matrix indicates the demand of ES. The meaning of values is as follows: 0 = no relevant demand; 1 = low relevant demand; 2 = relevant demand; 3 = medium relevant demand; 4 = high relevant demand; and 5 = very high relevant demand.

2.3.3 Gradient analysis

Spatial gradient refers to the spatial distribution investigation of landscape features that change regularly along a specific orientation (Radford and James, 2013). The urban-suburb gradient analysis tended to first establish a gradient zone between cities, and then the certain indexes changes such as the ES supply, demand, and budgets along the gradient zone are analyzed (Ji et al., 2020; Shou et al., 2020). However, for the purpose of analyzing major trends and variability between urban areas and suburbs in the study, constructing gradients in the form of city-centric buffer zones of concentric circles is considered to be appropriate (Kroll et al., 2012; Qin et al., 2020). Consequently, the latter method has been chosen for the further analysis. Specifically, 23 buffer zones of concentric circles with an outer radius of 1-23 km were constructed from each city center. ES supply, demand, and budgets in each buffer zone of concentric circle in different periods were calculated by using zonal statistics in ArcGIS.

3 Results

3.1 Spatio-temporal pattern of land use change

The land-use in the GPUA witnessed rapid and unparalleled changes with the cities expanding from 2000 to 2018 (Figure 5). The cultivated land decreased the largest (-2661 km2) and the construction land increased most (+1989 km2). The largest increase was in the construction land, mainly distributed in the central plain regions. The grassland came to the second (+444 km2). Dry land, medium coverage grassland, woodland, high coverage grassland, shrubbery and sparse woodland represented the dominant land use types, covering approximately 89% of the study area. From 2000 to 2018, land-use type change was mainly characterized by the largest decrease of dry land (-2520 km2) and the largest increase of urban land (+937 km2) (Table A4). Reduced areas of dry land was majorly transferred to medium cov erage grassland (6351 km2), rural settlements (2836 km2) and high coverage grassland (1342 km2). By contrast, the augment of urban land has been largely at the expense of the displacement of dry land (726 km2), rural settlements (165 km2) and other woodland (26 km2). It was notable that the area of cultivated land transferred to woodland (2288 km2) and grassland (8753 km2) from 2000 to 2018, which are mostly made up with shrubbery (947 km2) and high coverage grassland (6351 km2).
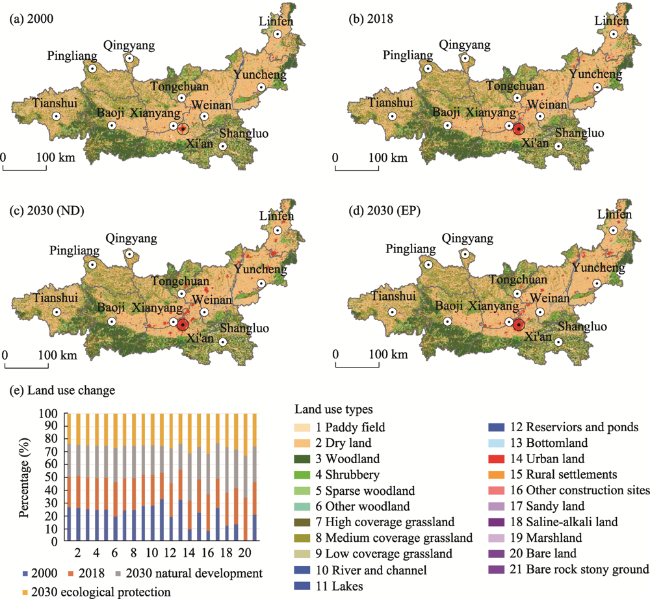
Figure 5 Land-use structure evolution of the Guanzhong Plain Urban Agglomeration in (a) 2000; (b) 2018; (c) 2030 under ND scenario; (d) 2030 under EP scenario; (e) proportion of each type of land use area in 2000, 2018 and 2030 under two scenarios. The numbers in the legend represent the different types of land use.
Under the ND scenario in 2030, the urban land will have a sharp increase (+1011 km2), resulting in a reduction in land-use types with high ES supply, such as low coverage grassland (-173 km2), medium coverage grassland (-93 km2) and bottomland (-56 km2). Urban land will increase the largest, at a rate of 62.80% under the ND scenario, which is 1.64 times that of the EP scenario. And bottomland will decrease most (-12.50%), followed by low coverage grassland (-6.34%). The land-use transformation is more drastic under the ND scenario compared to the EP scenario. For instance, more land transferred to dry land under the ND scenario, such as rural settlements (277 km2), low coverage grassland (221 km2), woodland (103 km2). In the ND scenario, a large amount of land with high ES supply will convert to urban land, which are mainly dry land (907 km2), and low coverage grassland (34 km2) and bottomland (14 km2). Even one of the most important ecosystems, the bottomland with high ES supply, saw 12.5% shift to dry land.
Under the EP scenario in 2030, the protection of land areas with high ES supply will be strengthened. Medium coverage grassland, low coverage grassland, river and channel will increase by 185 km2, 50 km2 and 17 km2 under the EP scenario, respectively. The area of lakes will have a 21.43% augment, only second to urban land (+38.2%). The area of dry land will decrease the most (-2.26%). Specifically, only 371 km2 of dry land and 8 km2 of bottomland are transferred to urban land under the EP scenario. In other words, the encroachment of urban land on ecological land (refers to grassland, woodland, water bodies and wetlands in this study) will be mitigated under the ecological protection (EP) scenario compared to that in ND scenario.

3.2 Spatio-temporal pattern of ES supply and demand

The distribution characteristics of ES supply is shown low in the middle and increased gradually to the periphery (Figure 6) from 2000 to 2030. The spatial distribution of the supply peak was mainly characterized by “lump” and “band” shapes. The “lump” shape was mainly distributed around Northern Qinling Mountains. The “band” shape was primarily distributed in the northeast of the study area. The corresponding land use types were dominant with woodland and grassland. The demand peak areas were gathered in the central plain, and the land use of which were urban land, rural settlements, and other construction land. The demand peak was principally distributed in a “lump” and “dot” shape. Most of the “lump” shape was mainly concentrated in Xi’an, Yuncheng, Xianyang and other city centers. The decrease areas of ES supply were mainly concentrated in the central plain from 2000 to 2018, especially around the city. It was represented by Xi’an and Yuncheng, followed by Xianyang, Weinan and Linfen. Under the scenarios of the ND and EP in 2030, the amount of demand peak of “lump” shape distribution will gradually increase. However, under the scenario of ND, the demand peak areas of some new “lump” shape distribution are larger.
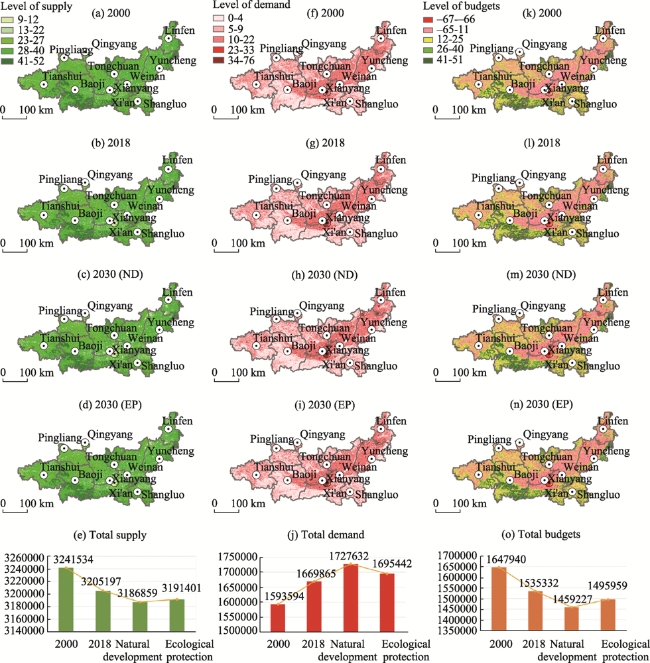
Figure 6 In the Guanzhong Plain Urban Agglomeration, level of ES supply in (a) 2000, (b) 2010, (c) 2030 under the ND scenario; (d) 2030 under the EP scenario; level of ES demand in (f) 2000, (g) 2010, (h) 2030 under the ND scenario; (i) 2030 under the EP scenario; level of ES budget in (k) 2000, (l) 2010, (m) 2030 under the ND scenario; (n) 2030 under the EP scenario; and total supply in (e); total demand in j); total budgets in (o)
The total amount of ES supply in the GPUA can meet the demand from 2000 to 2030 overall. Nevertheless, the gap between total ES supply and demand became narrowing. The total ES supply declined gradually and the total ES demand continued growing (Figure 6e, 6j) from 2000 to 2030 may lead to the ES supply-demand imbalance in the future. Compared with the EP scenario, the total amount of ES supply is decreasing (-18,338) and the demand is increasing (+57,767) even larger under the NP scenario in 2030. The urban ecosystems are developing in a pattern of ES demand outstrips supply in the GPUA from 2000 to 2030. Moreover, the ES supply and demand patterns show a strong spatial heterogeneity in the given period. High supply areas were mainly distributed in mountainous areas, while high demand areas were centered in urban areas.

3.3 Spatio-temporal pattern of ES supply-demand budgets

From 2000 to 2018, the average budgets of ES supply and demand decreased by 1.05, which will also be reduced in 2030. The average budgets of ES supply and demand in 2030 under the ND scenario is 0.71 lower than that in 2018 and 0.34 lower than that in 2030 under the EP scenario. The spatial distribution pattern of the ES supply-demand budgets (Figure 6) depicted that a few areas in the Northeast and most of the south part of the study area enjoyed high surpluses, which were mainly concentrated in Northern Qinling Mountains, the northeast mountain areas and the regions of the study area covering woodland, grassland and other ecological land. The ES budgets for land use in urban centers were in severe deficit, which was mainly reflected in the land use types of urban land, rural settlements and other building lands. From 2000 to 2018, the area of supply-demand budgets deficit areas increased sharply, with an increase rate of 46.82%. And its distribution was relatively scattered, mainly concentrated in urban centers, such as Xi’an, Xianyang and Yuncheng. The budgets surplus areas decreased by 1.79%. The budgets deficit under the ND scenario in 2030 is the most severe. The deficit areas under the ND scenario are 25.21% and 9.86% more than that in 2018 and under the EP scenario in 2030 respectively. From the perspective of the budgets value, the area with budgets score of 7 decreased the most, due to the drastic decrease of dry land area. Because of the augmentation of medium coverage grassland and urban land, the area with budgets score of 22 increased the most, and the regions with the lowest budget score ranked the second.
The ES supply-demand budgets deficit in 2030 under the ND scenario is the most severe under two scenarios. The surplus areas of ES supply-demand budgets in ND scenario are 0.66% less and the deficit areas of ES supply-demand budgets are 9.86% more than that under EP scenario. In terms of ES supply and demand value, the land area of the region with lowest budgets score (-67) under ND scenario is 19.84% more than that of EP scenario due to the increase of urban land. On the other hand, under the scenario of ND, on account of the increase of medium coverage grassland and high coverage grassland, and the land use area of the region with budgets score of 22 is 1.19% less than that of the EP scenario.

3.4 Gradient changes

Gradient differences are existing in the ES supply, demand and budgets between urban areas and suburbs of GPUA from 2000 to 2030 (Figure 7). With the rapid urban expansion, the gradient differences of ES supply and demand between urban centers and suburbs have become significant. Except Pingliang, the ES supply in most cities has sharp decline from 2000 to 2030 with a buffer of 1-16 km from the city center. For example, the ES supply in Yuncheng decreased by 11.27% at 5 km away from the city center from 2000 to 2018. Under the ND scenario in 2030, the decrease of ES supply in Tongchuan is 2.22 more than that in 2018 2 km from the city center. For the gradient change of ES demand, the ES demand of most cities increased more from 1-16 km away from the city center in 2018. For example, the ES demand has obviously increased in 1-8 km away from the city center of Xianyang, Linfen, Baoji and Tongchuan and 6-16 km away from the city center of Xi’an in 2018. The increase of ES demand in ND scenario is larger than that in EP scenario of 2030, especially in Tongchuan and Linfen. For example, the ES demand of Tongchuan under the ND scenario is 10.2 more than that under the EP scenario 3 km away from the city center. Therefore, the difference in ES supply and demand gradients between urban areas and suburbs was widened by urban spatial expansion. The budgets were in deficit in urban centers, while the surplus in suburbs. Along the urban-suburb gradient zone, the budgets continue to decrease and budget deficits expand from the central city to the suburbs as cities grow (e.g., Xianyang, Xi’an, Linfen, Yuncheng and Baoji). And this change occurred mostly in the range of 1-11 km. For example, the budgets of Xi’an city decreased by 57.63 in 2018 and 62.13 in 2030 under the ND scenario 11 km away from the city center.
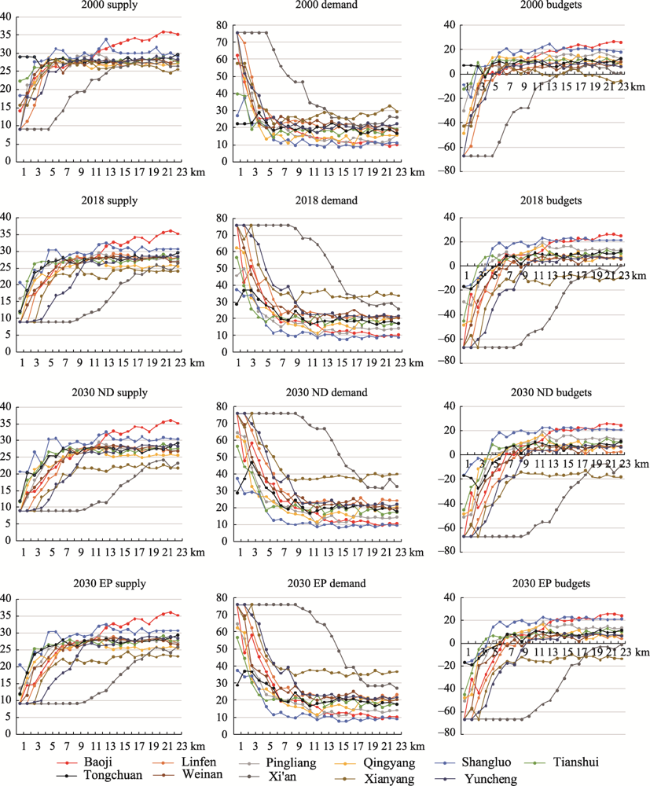
Figure 7 Gradient changes in level of ES supply, demand, and budgets in the Guanzhong Plain Urban Agglomeration. The X axis characterizes the distance to city center and the Y axis characterizes the value of ES supply, demand or budgets.
Furthermore, Xi’an city, as a megacity in the GPUA, its ES supply, demand, budgets has not changed within 6 km from the city center for its large urban scale. By contrast, the supply, demand and budgets of medium-sized cities in the GPUA (e.g., Xianyang, Yuncheng, Linfen, Baoji and Weinan) changed more intensified in total amount and range of distance because they were at the forefront of city expansion level in the GPUA. For example, the budgets of Yuncheng decreased 32.89 at 2 km away from the city center from 2000 to 2018. However, the ES gradient difference was less in small cities (e.g., Pingliang and Qingyang) due to relatively slow city development.
From 2000 to 2030, the stable unchanged areas of ES supply, demand and budgets became larger and the regions with drastic changes also expanded to areas farther away from urban center under all the scenarios as urban space expanded from small cities to megacity. For example, for Xi’an: in 2000, the ES supply, demand, and budgets in Xi’an had no change within 5 km, great change within 5-17 km and almost no change within 17-23 km; in 2018, due to city expansion, the areas with stable ES supply, demand, and budgets in Xi’an became larger, with no changes within 8 km and drastic changes within 8-19 km; in 2030, ES supply, demand, and budgets of Xi’an remain unchanged within 9 km, and changed dramatically within 9-19 km under both two scenarios. For other cities: in 2000, the ES supply, demand, and budgets in other cities changed drastically within 9 km, and did not change significantly within 9-23 km; in 2018, the range of drastic changes of ES supply, demand and budgets was extended to within 1-12 km, and the range of no significant changes was 12-23 km; in 2030, under both two scenarios, ES supply, demand and budgets in other cities have drastic change within 13 km, and no significant change within 13-23 km on the whole.

4 Discussion

4.1 Responses of ES to urban spatial expansion

The dramatic changes in land use driven by urban expansion from 2000 to 2030 under two alternative scenarios have been researched in this study. The changes are represented in the rapid expansion of urban land, increase of other woodland and reservoirs and ponds, and sharp declines in dry land, bottomland, and low coverage grassland. The findings revealed that ES supply shows a declining response and ES supply and demand are in a mismatching situation in the given time due to the drastic urban land use change, which is the most direct manifestation of rapid urban expansion in the GPUA (Ouyang et al., 2020; Cao et al., 2021; Maimaiti et al., 2021).
Land use change arisen from urban spatial expansion altered the ES supply and demand through its effects on the structure and ecological process of ecosystems (Fu and Zhang et al., 2014; Hu et al., 2020; Peng et al., 2020a), and the two responded to each other (Muhtar and Yimit, 2014; Huang et al., 2019). The urban expansion has accelerated industrial restructuring, non-agricultural industries rapidly developing, and demand for housing, utilities and transportation has risen sharply, leading to land use types with high ES supply transferred to the construction land with low ES supply (Zhou et al., 2018; Zhang et al., 2021). For instance, a large amount of the dry land in the central plain area, grassland and other woodland have been affected by urban spatial expansion converting to construction land from 2000 to 2030 in the GUPA. Moreover, the greatly rising grains demand as urban expansion motivating plentiful grassland and woodland transferred to dry land (Tan et al., 2020). Besides, the conflict between decreasing water supply and increasing demand have been exacerbated by urban expansion, resulting in water depletion since the dramatic changes are taking place in land use (Shi and Shi, 2018; Wang et al., 2019; Wang et al., 2020). In addition, some urgent environmental problems arising from the urban spatial expansion of GPUA also have a great effect on ES supply and demand. During the process of urban development, water pollution in some sections of the Weihe and Fenhe river basins (Jing et al., 2014; Hu et al., 2020a) and air pollution (SEB, 2018a; 2018b; GEB, 2018) caused by industrialization have been presenting. These outcomes lead to degradation in many types of ES (e.g., water regulation, air quality regulation), threatening ecological security in the GPUA (Wang et al., 2013; Qin et al., 2020).
It is interesting to note that the mismatch in the spatial distribution of supply and demand for ES in the study area is also embodied in the ES supply-demand is in surplus in the areas with ecological protection policies in place and high natural vegetation coverage in the southern part of the study area (Wang et al., 2017; Deng et al., 2021). For example, the returning cultivated land to woodland and grassland policy was implemented during the study period (Tan et al., 2020), extensive crop fields transferred to woods and grassland from 2000 to 2018. The degradation of woodland and grassland has been suppressed to some extent.

4.2 Implications of the future scenario setting

The effects of urban spatial development patterns on socio-ecological system development and the measurement of ES supply and demand vary in the direction and magnitude (Jiang et al., 2020; Li et al., 2020a; Zhang et al., 2020). Previous studies of the GPUA have not addressed the design of future scenarios (Yang and Cai, 2020; Zhang et al., 2020). Two different scenarios proposed in this study contributed to integrating the coordinated growth relationship between urban development and ecological protection in the future (Peng et al., 2020).
Aiming to pursuit maximum economic benefits is the main mode of urban development under ND scenario. In this scheme, urban land, and rural settlements increased rapidly, while the area of ecological land such as low coverage grassland and medium coverage grassland reduced a lot, which eventually leads to the severe mismatch of ES supply and demand in the future. Under the EP scenario, certain development activities were restricted in order to maintain the stable work of ecosystem structure and function. The cost of conversion of land use types with high ES supply to low ES supply is therefore suppressed in the land use simulation processing in this scenario. The outcome thus prove that the expansion of construction land will be effectively controlled with less natural or semi-natural ecosystems being converted to construction land under the EP scenario compared to ND scenario (Li et al., 2020b; Zhou et al., 2022). The ND scenario is bent on urban expansion, neglecting the coordinated development of urban and suburban areas, resulting in a significant contradiction between ES supply and demand of urban areas and suburbs compared to EP scenario (Wang et al., 2021a).
The findings in this research regarding different scenarios could contribute to elucidating the relationship between different land use structures and ES, informing the future land resources and ecological management of urban agglomerations (Li et al., 2020b; Liu et al., 2020; Zhou et al., 2022).

4.3 Strategic recommendations for urban management

The effects of urban spatial expansion on past-future evolution pattern of ES supply and demand have been evaluated in this research. Based on the research results, management strategies were proposed for the sustainable use of land resources and optimization of ecological development for the GPUA:
(1) Ecological management zoning could be implemented to build ecological security patterns (Zhang et al., 2020). The supply and demand conditions of ES vary from region to region. Though the ES supply and demand in the GPUA is in surplus on the whole, the uneven spatial distribution is existing significantly. Thus, it is necessary to carry out ecosystem maintaining and restoration by zoning and classifying, emphasizing on important ecological areas such as high coverage mountains, watersheds, and wetlands. Specifically, the high surplus ES supply-demand of mountains in the study area needs to be maintained, and Northern Qinling Mountains and Loess Plateau need to be protected on a priority basis since they are taken as the ecological security barriers in the southern and northern part of the study area (Wang et al., 2020). The ES supply and demand situation in the central plains have been seriously deteriorating, especially in the urban centers, and new urbanization needs to be developed to enhance the optimization of ecosystem structure and function. For the polluted sections of Fenhe River and Weihe River basin, the water quality purification and water containment need to be closely guarded. For the Yellow River and Wei River in the central part of the study area, the protection of watersheds can be enhanced by creating coastal ecological barriers (Zhang and Li, 2020). In terms of water depletion areas, the structure of industrial and agricultural production needs to be adjusted and the construction of water resources needs to be strengthened (Tan et al., 2020).
(2) The production, living and ecological land use structure should be improved to achieve the optimal use of existing urban land resources. Cities should grow sensibly, the maximum use of resources and socio-ecological sustainability should be achieved according to the different functions of the city, while the development boundaries of urban agglomerations could be delineated and the use of urban space in vertical directions should be increased. In addition, abandoned buildings could be redeveloped and utilized in order to achieve more effective use of existing urban land resources (Li et al., 2020b; Ma et al., 2020; Cao, 2021). Moreover, the ecological land use in cities could be planned to change the ecosystem structure of urban monoculture land use types to enhance the climate regulation and air purification of urban agglomerations (Ouyang et al., 2020; Deng et al., 2021).
(3) In response to the extreme imbalance in ES supply and demand between urban and rural areas, policies need to be implemented from a macro perspective, linking urban and suburban areas spatially and planning appropriately. Furthermore, the programme should be established on the basis of a reasonable measurement of the development of the different areas with a view to subsequent urban planning and ecological management planning.

4.4 Limitations and prospects

The innovation in this study lies in first establishing an effective framework for evaluating the patterns of ES spatio-temporal evolution, and then clarifying the mismatches relationship between ES supply and demand influenced by urban spatial expansion under different scenarios in the past and future at the scale of urban agglomeration. Besides, the spatial ecological factors such as national nature reserves, local nature reserves, important ecological function areas and key ecological function areas were incorporated into the scenario setting.
Still there are some limitations existing in the study. First of all, this study was based on land use data and expert knowledge and experience. This method effectively avoids the problem of errors arising from the conversion of units between supply and demand. For example, the unit for measuring water resources is cubic meters (m³), and the unit for measuring timber is ton (t) (or kg) (Burkhard et al., 2012; Ji et al., 2020). Yet for one thing, the accuracy of the simulation is limited by the inherent subjectivity of expert experience although the results underwent expert discussions and iterations (Jacobs et al., 2015; Guo et al., 2020). Moreover, the same type of land use, such as artificial lakes and natural lakes may provide different amount of ES (Bicking et al., 2019). The matrix method ignored the regional differences of ES supply and demand for the same land use type. In addition, driving elements in future scenarios such as future meteorological elements were not considered in the future land use simulation of the study (Zhang et al., 2020).
Nevertheless, the framework adopted in this study can integrate multiple ESs to evaluate ES supply and demand conditions more comprehensively. In order to provide city managers and decision makers with more intuitive information, future research and analysis can be carried out according to administrative boundaries. Specially, county-level administrative divisions allow for better analyzing the current state of ES in each district and the changing characteristics of ES supply and demand between cities and villages. Moreover, certain types of ES in urban agglomerations need to be quantified in detail, such as climate regulation, water conservation, air purification, etc., to provide strong scientific support for a more accurate study of ecological development and human needs of the study area, aiming to inform the decision making for urban-suburb development planning and ecological protection management.

5 Conclusions

This research assessed the effects of urban spatial expansion on ES supply-demand of the GPUA from 2000 to 2030 under different scenarios. FLUS model, expert-based LUCC matrix and gradient analysis methods were introduced to explore the spatio-temporal variations of the land use and different ES in the future. The findings showed that the ES supply and demand and budgets changed significantly in terms of total amount, spatial pattern and gradient changes as urban expanded spatially, leading to the possibility of the regional supply and demand mismatch occurrence. ES has gradually evolved in a direction where demand exceeds supply in the GPUA. The mismatch between ES supply and demand was not significant from the quantitative assessment perspective, but reflected in the spatial distribution pattern. The spatial distribution of supply and demand was extremely uneven with urban expansion, leading to an increasingly significant spatial heterogeneity in the supply and demand of ES. Meanwhile, the severe budgets deficit areas were gathered in urban centers while surplus areas were around the Northern Qinling Mountains and the mountains in the northeast of the GPUA.
Furthermore, the gradient differences of ES supply, demand, and budgets of the GPUA between urban centers and suburbs were enhanced by urban spatial expansion. The deficit areas extended from the urban centers to the suburbs with the city expanding. The extension under the ND scenario is the largest in 2030. From 2000 to 2030, as urban space expand from small cities to mega-cities, areas where ES supply, demand and budgets are stable become larger and areas of dramatic change gradually move away from urban centers under two scenarios.
In conclusion, the major factor causing ES declining and intensified the ES supply-demand mismatch was evidently drastic land use change driven by rapid urban expansion, for it has created increasing demand of water, grain, housing and utilities, as well as the pollution caused by the rapidly growing industries that threaten the sustainable development of the social ecosystem. Different scenarios setting could contribute to elucidating the relationship between different land use structures and ES, the strategies proposed in this study could provide information for the future land resources and ecological management of urban agglomerations. This research creates an effective framework for evaluating the ES supply and demand affected by urban spatial expansion, contributes to optimizing ecological planning and land resources management, and informing decision making to balance the socio-economic development and ecological protection at local and regional scales.

Appendix

Supplementary data to this article are also provided.

1 Appendix Tables

Table A1 Hierarchical classification of land-use types of the Guanzhong Plain Urban Agglomeration of China
Level 1 Level 2
Cultivated land Paddy field
Dry land
Forest land Woodland
Shrubbery
Sparse woodland
Other woodland
Grassland High coverage grassland
Medium coverage grassland
Low coverage grassland
Water body and wetland River and channel
Lakes
Reservoirs and ponds
Bottomland
Construction land Urban land
Rural settlements
Other construction sites
Unused land Sandy land
Saline-alkali land
Marshland
Bare land
Bare rock stony ground
Table A2 Cost matrices under ND and EP scenarios
Land cover types Paddy field Dry land Woodland Shrubbery Sparse woodland Other woodland High coverage grassland Medium coverage grassland Low coverage grassland River and channel Lakes Reservoirs and ponds Bottomland Urban land Rural settlements Other construction sites Sandy land Saline-alkali land Marshland Bare land Bare rock stony ground
Paddy field 1 1 1 1 1 1 1 1 1 0 0 0 0 1 1 1 1 1 1 1 1
Dry land 1 1 1 1 1 1 1 1 1 0 0 0 0 1 1 1 1 1 1 1 1
Woodland 1 1 1 1 1 1 1 1 1 0 0 0 0 1 1 1 1 1 1 1 1
Shrubbery 1 1 1 1 1 1 1 1 1 0 0 0 0 1 1 1 1 1 1 1 1
Sparse woodland 1 1 1 1 1 1 1 1 1 0 0 0 0 1 1 1 1 1 1 1 1
Other woodland 1 1 1 1 1 1 1 1 1 0 0 0 0 1 1 1 1 1 1 1 1
High coverage grassland 1 1 1 1 1 1 1 1 1 1 1 1 1 1 1 1 1 1 1 1 1
Medium coverage grassland 1 1 1 1 1 1 1 1 1 1 1 1 1 1 1 1 1 1 1 1 1
Low coverage grassland 1 1 1 1 1 1 1 1 1 1 1 1 1 1 1 1 1 1 1 1 1
River and channel 1 1 1 1 1 1 1 1 1 1 1 1 1 1 1 1 1 1 1 1 1
Lakes 1 1 1 1 1 1 1 1 1 1 1 1 1 1 1 1 1 1 1 1 1
Reservoirs and ponds 1 1 1 1 1 1 1 1 1 1 1 1 1 1 1 1 1 1 1 1 1
Bottomland 1 1 1 1 1 1 1 1 1 1 1 1 1 1 1 1 1 1 1 1 1
Urban land 1 1 1 1 1 1 1 1 1 0 0 0 0 1 1 1 1 1 1 1 1
Rural settlements 1 1 1 1 1 1 1 1 1 0 0 0 0 1 1 1 1 1 1 1 1
Other construction sites 1 1 1 1 1 1 1 1 1 0 0 0 0 1 1 1 1 1 1 1 1
Sandy land 1 1 1 1 1 1 1 1 1 0 0 0 0 1 1 1 1 1 1 1 1
Saline-alkali land 1 1 1 1 1 1 1 1 1 0 0 0 0 1 1 1 1 1 1 1 1
Marshland 1 1 1 1 1 1 1 1 1 0 0 0 0 1 1 1 1 1 1 1 1
Bare land 1 1 1 1 1 1 1 1 1 0 0 0 0 1 1 1 1 1 1 1 1
Bare rock stony ground 1 1 1 1 1 1 1 1 1 0 0 0 0 1 1 1 1 1 1 1 1
ND scenario in 2030
Land cover types Paddy field Dry land Woodland Shrubbery Sparse woodland Other woodland High coverage grassland Medium coverage grassland Low coverage grassland River and channel Lakes Reservoirs and ponds Bottomland Urban land Rural settlements Other construction sites Sandy land Saline-alkali land Marshland Bare land Bare rock stony ground
Paddy field 1 1 1 1 1 1 1 1 1 0 0 0 0 1 1 1 0 0 0 0 0
Dry land 1 1 1 1 1 1 1 1 1 0 0 1 0 1 1 1 0 0 0 0 0
Woodland 0 0 1 1 1 1 1 1 1 0 0 0 0 0 0 0 0 0 0 0 0
Shrubbery 0 0 1 1 1 1 1 1 1 0 0 0 0 0 0 0 0 0 0 0 0
Sparse woodland 0 0 1 1 1 1 1 1 1 0 0 0 0 0 0 0 0 0 0 0 0
Other woodland 0 0 1 1 1 1 1 1 1 0 0 0 0 0 0 0 0 0 0 0 0
High coverage grassland 0 0 0 0 0 0 1 1 1 0 0 0 0 0 0 0 0 0 0 0 0
Medium coverage grassland 0 0 0 0 0 0 1 1 1 0 0 0 0 0 0 0 0 0 0 0 0
Low coverage grassland 0 0 0 0 0 0 1 1 1 0 0 0 0 0 0 0 0 0 0 0 0
River and channel 0 0 0 0 0 0 0 0 0 1 1 1 0 0 0 0 0 0 0 0 0
Lakes 0 0 0 0 0 0 0 0 0 1 1 1 0 0 0 0 0 0 0 0 0
Reservoirs and ponds 0 0 0 0 0 0 0 0 0 1 1 1 1 0 0 0 0 0 0 0 0
Bottomland 1 1 0 0 0 1 1 1 1 1 1 1 1 1 1 1 1 0 1 0 0
Urban land 0 0 0 0 0 0 0 0 0 0 0 0 0 1 1 1 0 0 0 0 0
Rural settlements 0 0 0 0 0 0 0 0 0 0 0 0 0 1 1 1 0 0 0 0 0
Other construction sites 0 0 0 0 0 0 0 0 0 0 0 0 0 1 1 1 0 0 0 0 0
Sandy land 1 1 0 0 0 0 0 0 0 0 0 0 0 1 1 1 1 0 0 0 0
Saline-alkali land 1 1 1 1 1 1 1 1 1 0 0 0 0 1 1 1 1 1 1 1 1
Marshland 1 1 1 1 1 1 1 1 1 0 0 0 0 1 1 1 1 1 1 1 1
Bare land 1 1 1 1 1 1 1 1 1 0 0 0 0 1 1 1 1 1 1 1 1
Bare rock stony ground 0 0 0 0 0 0 0 0 1 0 0 0 0 0 0 0 0 0 0 1 1
EP scenario in 2030
Table A3 Weight of neighborhood under ND and EP scenarios
Scenarios Paddy field Dry land Woodland Shrubbery Sparse woodland Other woodland High coverage grassland Medium coverage grassland Low coverage grassland River and channel Lakes Reservoirs and ponds Bottomland Urban land Rural settlements Other construction sites Sandy land Saline-alkali land Marshland Bare land Bare rock stony ground
ND (natural development) 0.7 0.7 0.6 0.6 0.6 0.6 0.5 0.5 0.5 0.5 0.5 0.5 0.5 1.0 1.0 1.0 0.3 0.3 0.3 0.3 0.3
EP (ecological protection) 0.5 0.5 0.9 0.9 0.9 0.9 0.6 0.6 0.6 0.7 0.7 0.7 0.7 0.8 0.8 0.8 0.3 0.3 0.3 0.3 0.3
Table A4 Land-use conversion matrix of the Guanzhong Plain Urban Agglomeration during 2000-2018, 2018-2030 under ND scenario, and 2018-2030 under EP sce-nario (area km2)
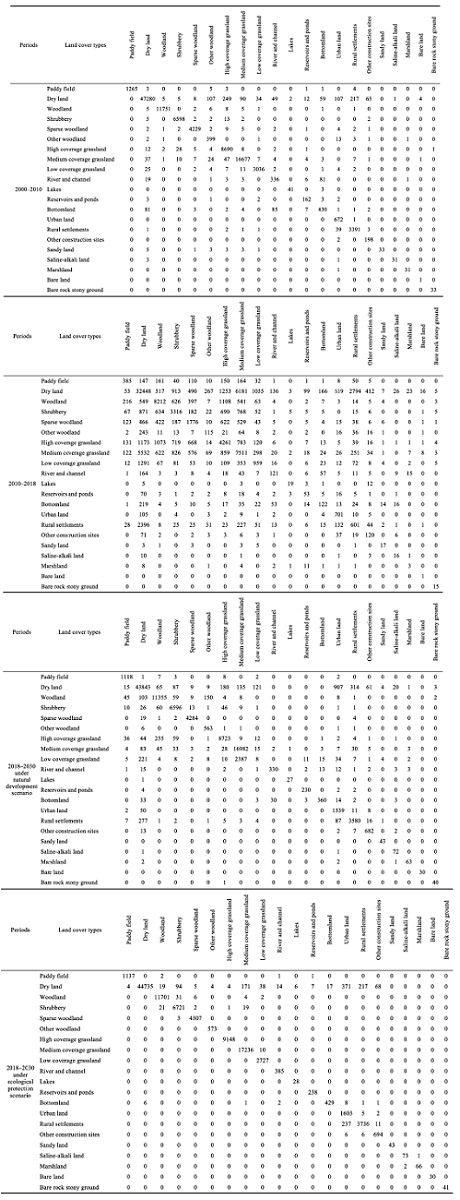
Table A5 Details of FoM validation
Category Value
A 1158
B 43938
C 1035
D 1801
FoM calculation formula B/(A+B+C+D)
FoM 0.916674
Producer’s Accuracy calculation formula B/(A+B+C)
Producer’s Accuracy 0.952461
User’s Accuracy calculation formula B/(B+C+D)
User’s Accuracy 0.939368

2 Appendix Figure

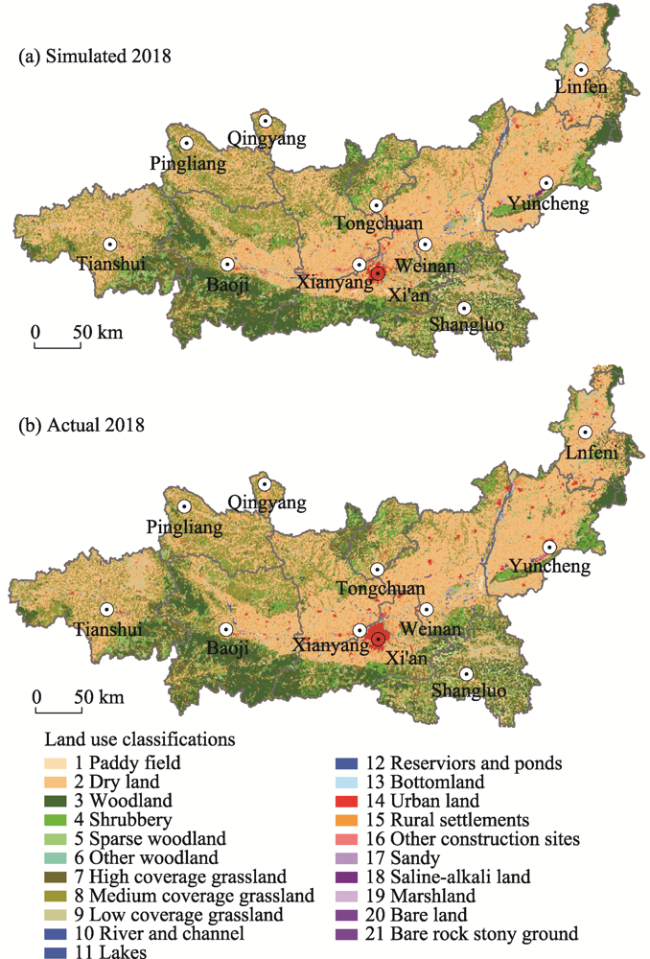
Figure A1 Land-use structure of the GPUA in (a) simulated 2018; (b) actual 2018. The numbers in the legend represent the different types of land use.
[1]
Bicking S, Burkhard B, Kruse M et al., 2019. Bayesian Belief Network-based assessment of nutrient regulating ecosystem services in northern Germany. Plos One, 14(4): e0216053.

DOI

[2]
Bongaarts J IPBES, 2019. Summary for policymakers of the global assessment report on biodiversity and ecosystem services of the Intergovernmental Science-Policy Platform on Biodiversity and Ecosystem Services. Population and Development Review, 45(3): 680-681.

[3]
Burkhard B, Kroll F, Nedkov S et al., 2012. Mapping ecosystem service supply, demand and budgets. Ecological Indicators, 21: 17-29.

DOI

[4]
Burkhard B, Kandziora M, Hou Y et al., 2014. Ecosystem service potentials, flows and demands: Concepts for spatial localisation, indication and quantification. Landscape Online, 34(1): 1-32.

DOI

[5]
Cao T G, Yi Y J, Liu H X et al., 2021. The relationship between ecosystem service supply and demand in plain areas undergoing urbanization: A case study of China’s Baiyangdian Basin. Journal of Environmental Management, 289: 112492.

DOI

[6]
Chen Y M, Liu X, Li X, 2017. Calibrating a land parcel cellular automaton (LP-CA) for urban growth simulation based on ensemble learning. International Journal of Geographical Information Science, 131(12): 2480-2504.

[7]
Costanza R, Groot R D, Braat L et al., 2017. Twenty years of ecosystem services: How far have we come and how far do we still need to go? Ecosystem Services, 28: 1-16.

DOI

[8]
Deng C X, Liu J Y, Liu Y J et al., 2021. Spatiotemporal dislocation of urbanization and ecological construction increased the ecosystem service supply and demand imbalance. Journal of Environmental Management, 288: 112478.

DOI

[9]
Fu B J, Wang S, Su C H et al., 2013. Linking ecosystem processes and ecosystem services. Current Opinion in Environmental Sustainability, 5(1): 4-10. (in Chinese)

DOI

[10]
Fu B J, Zhang L W, 2014. Land-use change and ecosystem services: Concepts, methods and progress. Progress in Geography, 33(4): 441-446. (in Chinese)

[11]
GEB (Gansu Environmental Bulletin), 2018. Gansu Provincial Department of Ecology and Environment. http://sthj.gansu.gov.cn/info/1049/14804.htm, 2019-06-05/2021-06-10.

[12]
Guo C X, Xu X B, Shu Q et al., 2020. A review on the assessment methods of supply and demand of ecosystem services. Chinese Journal of Ecology, 39(6): 2086-2096. (in Chinese)

[13]
Hu D X, Li Y J, Li L et al., 2020a. Reduction scenarios of non-point source pollution in Xianyang-Xi’an section of Weihe River Basin based on SWAT. Journal of Northwest A & F University. Natural Science Edition, 48(10): 127-136,145. (in Chinese)

[14]
Hu S, Chen L Q, Li L et al., 2020. Simulation of land use change and ecosystem service value dynamics under ecological constraints in Anhui Province, China. International Journal of Environmental Research and Public Health, 17(12): 4228.

DOI

[15]
Huang A, Xu Y Q, Liu C et al., 2019. Simulated town expansion under ecological constraints: A case study of Zhangbei County, Heibei Province, China. Habitat International, 91: 101986.

DOI

[16]
Jacobs S, Burkhard B, Daele T V et al., 2015. ‘The Matrix Reloaded’: A review of expert knowledge use for mapping ecosystem services. Ecological Modelling, 295: 21-30.

DOI

[17]
Ji Z X, Xu Y Q, Wei H J, 2020. Identifying dynamic changes in ecosystem services supply and demand for urban sustainability: Insights from a rapidly urbanizing city in Central China. Sustainability, 12(8): 3428.

DOI

[18]
Jiang B, Bai Y, Chen J Y et al., 2020. Land management to reconcile ecosystem services supply and demand mismatches: A case study in Shanghai municipality, China. Land Degradation & Development, 31(17): 2684-2699.

DOI

[19]
Jing S Y, Xu M D, Wu C F, 2014. Water quality analysis and pollution prevention countermeasure for Fenhe Reservior and its upstream. Environment Engineering, 32(4): 18-21. (in Chinese)

[20]
Jing Y C, Chen L D, Sun R, 2018. A theoretical research framework for ecological security pattern construction based on ecosystem services supply and demand. Acta Ecologica Sinica, 38(12): 4121-4131. (in Chinese)

[21]
Kroll F, Mueller F, Haase D et al., 2012. Rural-urban gradient analysis of ecosystem services supply and demand dynamics. Land Use Policy, 29(3): 521-535.

DOI

[22]
Li Z Z, Cheng X Q, Han H R, 2020a. Analyzing land-use change scenarios for ecosystem services and their trade-offs in the ecological conservation area in Beijing, China. International Journal of Environmental Research and Public Health, 17(22): 8632.

DOI

[23]
Li Z Z, Cheng X Q, Han H R, 2020b. Future impacts of land use change on ecosystem services under different scenarios in the ecological conservation area, Beijing, China. Forests, 11(5): 584.

DOI

[24]
Liu S, Yang Y, Wang Y C, 2019a. Mapping supply and demand differentiation of hydrological regulation service based on matrix analysis: A case study of Jiaxing City, Zhejiang Province. Acta Ecologica Sinica, 39(4): 1189-1202. (in Chinese)

[25]
Liu W, Zhan J Y, Zhao F et al., 2019b. Impacts of urbanization-induced land-use changes on ecosystem services: A case study of the Pearl River Delta Metropolitan Region, China. Ecological Indicators, 98: 228-238.

DOI

[26]
Liu X P, Liang X, Li X et al., 2017. A future land use simulation model (FLUS) for simulating multiple land use scenarios by coupling human and natural effects. Landscape and Urban Planning, 168: 94-116.

DOI

[27]
Liu Y B, Hou X Y, Li X W et al., 2020. Assessing and predicting changes in ecosystem service values based on land use/cover change in the Bohai Rim coastal zone. Ecological Indicators, 111: 106004.

DOI

[28]
Lu C, Zhou H, Zhang F et al., 2021. Land spatial transformation analysis in Shandong Province based on geoinformation map. Transactions of the Chinese Society for Agricultural Machinery, 52(7): 222-230. (in Chinese)

[29]
Ma F, Wang Z H, Sun Q P et al., 2020. Spatial-temporal evolution of urban resilience and its influencing factors: Evidence from the Guanzhong Plain Urban Agglomeration. Sustainability, 12(7): 2593.

DOI

[30]
Ma L, Liu H, Peng J et al., 2017. A review of ecosystem services supply and demand. Acta Geographica Sinica, 72(7): 1277-1289. (in Chinese)

[31]
Maimaiti B, Chen S S, Kasimu A et al., 2021. Urban spatial expansion and its impacts on ecosystem service value of typical oasis cities around Tarim Basin, Northwest China. International Journal of Applied Earth Observation and Geoinformation, 104: 102554.

DOI

[32]
Maron M, Mitchell M G E, Runting R K et al., 2017. Towards a threat assessment framework for ecosystem services. Trends in Ecology & Evolution, 32(4): 240-248.

DOI

[33]
MEA (Millennium Ecosystem Assessment), 2005. Ecosystems and Human Well-being:Synthesis. Washington, DC: Island Press.

[34]
Muhtar P, Yimit H, 2014. Ecosystem services sensitivity to land-use change: A case study of the Keriya oasis. Journal of Natural Resources, 29(11): 1849-1858.

[35]
Ouyang X, He Q Y, Zhu X, 2020. Simulation of impacts of urban agglomeration land use change on ecosystem services value under multi-scenarios: Case study in Changsha-Zhuzhou-Xiangtan Urban Agglomeration. Economic Geography, 40(1): 93-102. (in Chinese)

DOI

[36]
Ouyang X, Tang L S, Wei X et al., 2021. Spatial interaction between urbanization and ecosystem services in Chinese urban agglomerations. Land Use Policy, 109: 105587.

DOI

[37]
Pan Z Z, He J H, Liu D F et al., 2020. Predicting the joint effects of future climate and land use change on ecosystem health in the middle reaches of the Yangtze River Economic Belt, China. Applied Geography, 124: 102293.

DOI

[38]
Peng J, Wang X Y, Liu Y X et al., 2020a. Urbanization impact on the supply-demand budget of ecosystem services: Decoupling analysis. Ecosystem Services, 44: 101139.

DOI

[39]
Peng K F, Jiang W G, Deng Y et al., 2020. Simulating wetland changes under different scenarios based on integrating the random forest and CLUE-S models: A case study of Wuhan Urban Agglomeration. Ecological Indicators, 117: 106671.

DOI

[40]
Puplampu D A, Boafo Y A, 2021. Exploring the impacts of urban expansion on green spaces availability and delivery of ecosystem services in the Accra metropolis. Environmental Challenges, 5: 100283.

DOI

[41]
Qin Y L, Shi P, He W H et al., 2020. Influence of urbanization on landscape pattern and ecosystem service value in Xi’an city. Acta Ecologica Sinica, 40(22): 8239-8250. (in Chinese)

[42]
Radford K G, James P, 2013. Changes in the value of ecosystem services along a rural-urban gradient: A case study of Greater Manchester, UK. Landscape and Urban Planning, 109(1): 117-127.

DOI

[43]
Ren Q, Long A H, Yang Y M et al., 2021. Analysis on remote sensing monitoring of eco-environment variation of main stream basin of Tarim River in recent 20 years. Water Resources and Hydropower Engineering, 52(3): 103-111. (in Chinese)

[44]
Schirpke U, Candiago S, Vigl L E et al., 2019. Integrating supply, flow and demand to enhance the understanding of interactions among multiple ecosystem services. Science of the Total Environment, 651: 928-941.

DOI

[45]
Schroter M, Barton D N, Remme R P et al., 2014. Accounting for capacity and flow of ecosystem services: A conceptual model and a case study for Telemark, Norway. Ecological Indicators, 36: 539-551.

DOI

[46]
Serna-Chavez H M, Schulp C, Bodegom P V et al., 2014. A quantitative framework for assessing spatial flows of ecosystem services. Ecological Indicators, 39: 24-33.

DOI

[47]
Shaanxi Environmental Bulletin (SEB), 2018a. Shaanxi Provincial Department of Ecology and Environment. http://sthjt.shaanxi.gov.cn/newstype/hbyw/hjzl/hjzkgb/20190603/40879.html, 2019-06-03/2021-06-10.

[48]
Shanxi Environmental Bulletin (SEB), 2018b. Shanxi Provincial Department of Ecology and Environment. https://sthjt.shanxi.gov.cn/html/hjzkgb/20190826/81878.html, 2019-08-26/2021-06-10.

[49]
Shi Y S, Shi D H, 2018. Study on the balance of ecological service supply and demand in Dongting Lake ecological economic zone. Geographical Research, 37(9): 1714-1723. (in Chinese)

[50]
Shou F Y, Li Z F, Huang L et al., 2020. Spatial differentiation and ecological patterns of urban agglomeration based on evaluations of supply and demand of ecosystem services: A case study on the Yangtze River Delta. Acta Ecologica Sinica, 40(9): 2813-2826. (in Chinese)

[51]
Stuerck J, Poortinga A, Verburg P H, 2014. Mapping ecosystem services: The supply and demand of flood regulation services in Europe. Ecological Indicators, 38: 198-211.

DOI

[52]
Tan Z, Guan Q Y, Lin J K et al., 2020. The response and simulation of ecosystem services value to land use/land cover in an oasis, Northwest China. Ecological Indicators, 118: 106711.

DOI

[53]
Wang J, Zhai T L, Lin Y F et al., 2019. Spatial imbalance and changes in supply and demand of ecosystem services in China. Science of the Total Environment, 657: 781-791.

DOI

[54]
Wang J T, Peng J, Zhao M Y et al., 2017. Significant trade-off for the impact of Grain-for-Green Programme on ecosystem services in north-western Yunnan, China. Science of the Total Environment, 574: 57-64.

DOI

[55]
Wang R B, Bai Y, Alatalo J M et al., 2021a. Impacts of rapid urbanization on ecosystem services under different scenarios: A case study in Dianchi Lake Basin, China. Ecological Indicators, 130: 108102.

DOI

[56]
Wang W J, Wu T, Li Y Z et al., 2020a. Urbanization impacts on natural habitat and ecosystem services in the Guangdong-Hong Kong-Macao “Megacity”. Sustainability, 12(16): 6675.

DOI

[57]
Wang Z, Song J X, Duan M C et al., 2013. Characteristic analysis of COD and NH3-N change of water quality in Shaanxi section of Weihe River. Journal of Water Resources & Water Engineering, 24(3): 64-68. (in Chinese)

[58]
Wang Z G, Bai Y P, Che L et al., 2020b. Spatio-temporal characteristics and influencing factors of vegetation coverage in urban agglomeration of Guanzhong Plain. Arid Land Geography, 43(4): 1041-1050. (in Chinese)

[59]
Wang Z Z, Zhang L W, Li X P et al., 2021b. Integrating ecosystem service supply and demand into ecological risk assessment: A comprehensive framework and case study. Landscape Ecology, 36(10): 2977-2995.

DOI

[60]
Wei X H, Bai Y P, Che L et al., 2019. Evaluation of human settlement environment quality of urban agglomeration in Guanzhong Plain based on grid data. Arid Land Geography, 42(5): 1176-1184. (in Chinese)

[61]
Widaningrum D L, Surjandari I, Sudiana D, 2020. Analyzing land use changes in tourism development areas: A case study of cultural world heritage sites on Java Island, Indonesia. International Journal of Technology, 11(4): 688-697.

DOI

[62]
Wolff S, Schulp C J E, Verburg P H, 2015. Mapping ecosystem services demand: A review of current research and future perspectives. Ecological Indicators, 55: 159-171.

DOI

[63]
Wu A B, Zhao Y X, Shen H T et al., 2018. Spatio-temporal pattern evolution of ecosystem service supply and demand in Beijing-Tianjin-Hebei region. Journal of Ecology and Rural Environment, 34(11): 968-975. (in Chinese)

[64]
Wu Y, Tao Y, Yang G S et al., 2019. Impact of land use change on multiple ecosystem services in the rapidly urbanizing Kunshan City of China: Past trajectories and future projections. Land Use Policy, 85: 419-427.

DOI

[65]
Xin R H, Skov-Petersen H, Zeng J et al., 2021. Identifying key areas of imbalanced supply and demand of ecosystem services at the urban agglomeration scale: A case study of the Fujian Delta in China. Science of the Total Environment, 791: 148173.

DOI

[66]
Xu Z H, Wei H J, Dong X B et al., 2020. Evaluating the ecological benefits of plantations in arid areas from the perspective of ecosystem service supply and demand-based on emergy analysis. Science of the Total Environment, 705: 135853.

DOI

[67]
Yang Y, Cai Z X, 2020. Ecological security assessment of the Guanzhong Plain Urban Agglomeration based on an adapted ecological footprint model. Journal of Cleaner Production, 260: 120973.

DOI

[68]
Zhang D, Wang X R, Qu L P et al., 2020. Land use/cover predictions incorporating ecological security for the Yangtze River Delta region, China. Ecological Indicators, 119: 106841.

DOI

[69]
Zhang L W, Fu B J, 2014. The progress in ecosystem services mapping: A review. Acta Ecologica Sinica, 34(2): 316-325. (in Chinese)

[70]
Zhang Z M, Peng J, Xu Z H et al., 2021a. Ecosystem services supply and demand response to urbanization: A case study of the Pearl River Delta, China. Ecosystem Services, 49(1): 101274.

DOI

[71]
Zhao M Y, Peng J, Liu Y X et al., 2018. Mapping watershed-level ecosystem service bundles in the Pearl River Delta, China. Ecological Economics, 152: 106-117.

DOI

[72]
Zhou D Y, Tian Y Y, Jiang G H, 2018. Spatio-temporal investigation of the interactive relationship between urbanization and ecosystem services: Case study of the Jingjinji Urban Agglomeration, China. Ecological Indicators, 95: 152-164.

DOI

[73]
Zhou Y, Wu T, Wang Y C Z, 2022. Urban expansion simulation and development-oriented zoning of rapidly urbanising areas: A case study of Hangzhou. The Science of the Total Environment, 807(Part 2): 150813.

DOI

[74]
Zoe L, Lain W, Melissa G et al., 2018. Linkages between ecosystem services and human wellbeing: A Nexus Webs approach. Ecological Indicators, 93: 658-668.

DOI

Outlines

/