Research article

Glacier area changes in the Nujiang-Salween River Basin over the past 45 years

  • JI Xuan , 1, 2 ,
  • CHEN Yunfang , 3, * ,
  • JIANG Wei 1, 2 ,
  • LIU Chang 1, 2 ,
  • YANG Luyi 1, 2
Expand
  • 1.Institute of International Rivers and Eco-Security, Yunnan University, Kunming 650091, China
  • 2.Yunnan Key Laboratory of International Rivers and Transboundary Eco-Security, Yunnan University, Kunming 650091, China
  • 3.Faculty of Geography, Yunnan Normal University, Kunming 650500, China
* Chen Yunfang (1984-), PhD, specialized in hydrology and geographic information system. E-mail:

Ji Xuan (1984-), PhD, specialized in hydrology and remote sensing. E-mail:

Received date: 2021-09-19

  Accepted date: 2021-12-29

  Online published: 2022-08-25

Supported by

National Natural Science Foundation of China(42061005)

National Natural Science Foundation of China(41561003)

Science and Technology Projects of Yunnan Province(202101AT070110)

Abstract

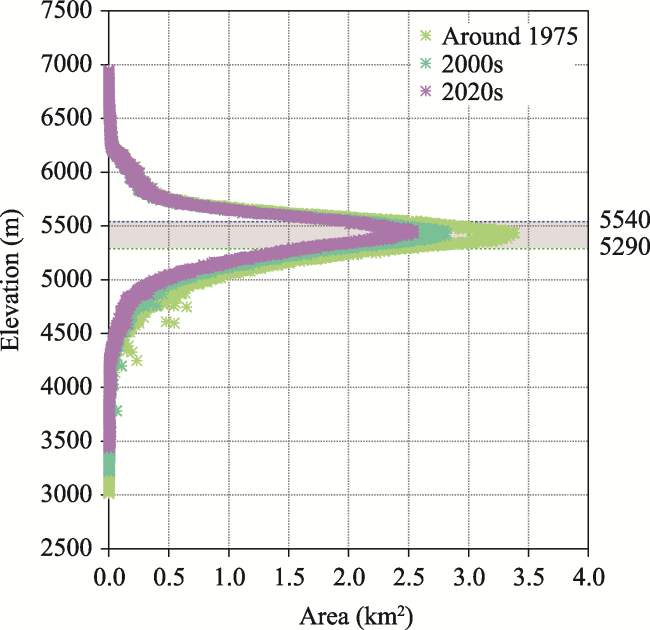
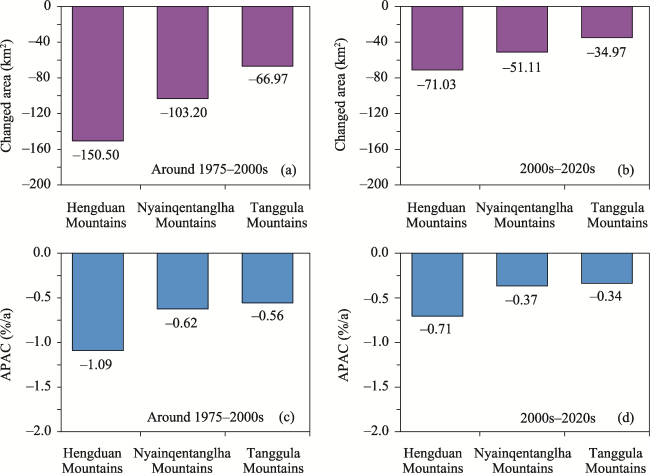
Automated image classification and visual interpretation of Landsat imagery were used to extract the glacier boundary in the Nujiang-Salween River Basin (NSRB) around the years 1975, 2000, and 2020. The spatiotemporal characteristics of glacier area changes in the NSRB were determined and the reasons for the spatial heterogeneity in glacier area changes were discussed, based on comparative analyses of temperature and precipitation data from meteorological stations around the NSRB. The results indicate that 1) the total glacier area in the NSRB decreased by 477.78 km² (28.17%) at a rate of -0.62%/a in 1975-2020. Most shrinkage occurred at low and mid altitudes, with the most severe occurring at 5290-5540 m, accounting for 40% of the total shrinkage. Considering other river basins in China, the relative glacier area change rate in the NSRB was similar to that for typical inland river basins in northwest China but lower than that for other transboundary river basins in the southeastern Tibetan Plateau. 2) These areal changes in the NSRB presented obvious regional differences. The glaciers in the Hengduan Mountains retreated significantly, followed by those in the Nyainqentanglha Mountains, with relatively low shrinkage observed in the Tanggula Mountains. The number of cold and hot spots indicating areal changes increased after 2000, along with their spatial heterogeneity. 3) The glacier shrinkage rate over different time intervals was positively correlated with temperature. Thus, spatial heterogeneity of climate change effects could elucidate differences in the glacier area change rate in different regions of the NSRB. The temperature rise was determined as the primary reason for the significant glacial retreat over the past 45 years. As the significant warming trend continues, the glacier area in the NSRB is likely to shrink further.

Cite this article

JI Xuan , CHEN Yunfang , JIANG Wei , LIU Chang , YANG Luyi . Glacier area changes in the Nujiang-Salween River Basin over the past 45 years[J]. Journal of Geographical Sciences, 2022 , 32(6) : 1177 -1200 . DOI: 10.1007/s11442-022-1991-8

1 Introduction

Mountain glaciers are an important part of the cryosphere. As important reservoirs of solid freshwater, glaciers greatly impact regional ecosystems, the environment, and socio-economic development (Liu et al., 2019). Glaciers are extremely sensitive to climate change, especially mountain glaciers; they are considered as key indicators of changes in the climate (Bolch et al, 2012; Grinsted, 2013; Paul et al., 2015). In the context of global warming, glacier retreat has become a worldwide trend (IPCC, 2019; Li et al., 2019) and is likely to substantially impact regional water resources, contribute to rising sea levels (Immerzeel et al., 2010; Church et al., 2011; Huss and Hock, 2018), and increase the risk of natural disasters such as glacial lake outburst floods and mudslides (Wang et al., 2015). As a result, the relationship between climate change and glacier shrinkage is being actively researched to ensure sustainable development under the global climate change scenario (Wu et al., 2018).
The Tibetan Plateau and surrounding areas host the greatest number of glaciers outside of the polar regions (Yao et al., 2012; Nie et al., 2021). Many of these glaciers are located at the headwaters of major rivers in Asia and have been retreating rapidly (Yao et al., 2007), not only affecting the surface environment of the Tibetan Plateau but also the hydrological processes and runoff of major rivers (Immerzeel et al., 2010). The long-term monitoring of glaciers is essential for understanding the environmental impacts of glacier change. In-situ observations of glaciers provide the most accurate and reliable data; however, the harsh terrain and conditions in mountainous areas result in serious limitations, especially in terms of large-scale observations (Sahu and Gupta, 2020). The advancements in remote sensing technology over recent decades have rendered glacier monitoring and research methods more effective. Remote sensing data have been used in multiple studies for investigating the changes in glacier areas on the Tibetan Plateau, with most studies focusing on the Himalayas (Kääb et al., 2012), Gangdise Mountains (Liu et al., 2019), Nyainqentanglha Mountains (Ji et al., 2018; Luo et al., 2020a), Karakoram Mountains (Rankl et al., 2014), Tanggula Mountains (Duan et al., 2019), and Hengduan Mountains (Wang et al., 2017).
Most studies considered mountain systems as bases for research, while relatively few studies have examined the glacier changes occurring in the basins. In China, research on glacier changes at the basin-scale have primarily focused on inland river basins in the northwest China, such as the Tarim River Basin (Liu et al., 2006) and Heihe River Basin (Huai et al., 2014). In recent years, the water resources of transboundary rivers have attracted worldwide attention. As high-quality freshwater reserves, the glaciers in transboundary river basins and changes in the scale of these glaciers are of great concern to the global research community. Some studies investigating basin-scale glacier changes in transboundary river basins have already been conducted in the southeastern Tibetan Plateau. For example, Liu et al. (2015) used the first and second China Glacier Inventory to analyze the changes occurring in the glaciers of the Lancang River Basin from the 1970s to the 2010s and found that the area covered by glaciers shrank at a rate of approximately 0.75%/a; Taft and Kühle (2018) used Landsat imagery to analyze glacier changes in the headwater region of the Irrawaddy River from 1976 to 2015 and found that the Irrawaddy glacier area shrank by approximately 1.39%/a. These research results show that the glacier areas in the headwater regions of transboundary rivers have retreated considerably. Other studies have shown that the most rapid glacial retreat occurred in the southeastern part of the Tibetan Plateau (Yao et al., 2019). However, the glacier response to climate change is spatially heterogeneous (Li et al., 2019), which indicates that the changes observed may vary greatly in different basins.
The glaciers in the Nujiang-Salween River Basin (NSRB) are primarily distributed along the southern slope of the Tanggula Mountain Range, the northern slope of the Nyainqentanglha Mountain Range, and over the eastern parts of the Hengduan Mountains. Compared with inland rivers in northwest China, glacier meltwater accounts for only a small proportion of the downstream discharge (Yang et al., 2021). However, in weak monsoon years, glacial meltwater plays a key role in maintaining stable river runoff (Zhang et al., 2020). In recent years, environmental issues in the NSRB, such as ecological changes (Feng et al., 2010) and the development of small hydropower stations (Alipour et al., 2022), have attracted attention. However, there is a notable lack of systematic and in-depth research on glacier changes in the NSRB.
The aim of this study was to determine the spatial and temporal changes in the glacier area in the NSRB over the past 45 years. Landsat imagery acquired around the years 1975, 2000, and 2020 were used to extract glacier boundaries through computer-aided and visual interpretation. Temperature and precipitation data from the surrounding meteorological stations were used to elucidate the reasons for the spatial heterogeneity in glacier area changes in the NSRB.

2 Study area

The Nujiang-Salween River is an important transboundary river in Southeast Asia. It originates in the Tanggula Mountains in the Central Tibetan Plateau, flows through the Tibet Autonomous Region and Yunnan Province of China to Myanmar, and finally discharges into the Andaman Sea in the northeastern Indian Ocean (Yang et al., 2021). The Nujiang-Salween River has a length of 3673 km and a total basin area of 325×103 km2. The headwaters of the river are separated from the source of the Yangtze River (to the north) by the Tanggula Mountains; its basin is separated from the adjacent Lancang River basin to the east by the Taniantaweng-Nushan Mountains and it is adjacent to the Yarlung Zangbo River Basin from the southwest and the Irrawaddy River Basin from the west, from which the NSRB is separated by the Nyainqentanglha Mountains and the Gaoligong Mountains, respectively.
The glaciers in the NSRB are mainly distributed in the three major mountain ranges: the Tanggula Mountains, Nyainqentanglha Mountains, and Hengduan Mountains (Figure 1). The focus of this study is the basin that lies above the Gongshan hydrological station in the upper reaches of the NSRB. The geographic environment and climatic conditions are particularly complex in this region. The altitude of the study area ranges from 3000 to 6000 m, with 90% of its area lying above 4000 m (Luo et al., 2020b). The climate in the NSRB is primarily affected by the Indian monsoon in summer, leading to humid and warm summers, and mid-latitude westerlies in winter that render it cold and dry during this season (Lan et al., 2014). Over the past 50 years, a significant increasing trend has been observed in the temperature in the upper reaches of the Nujiang-Salween River (Fan et al., 2015), indicating the serious impact of climate change on the cryospheric components in this area.
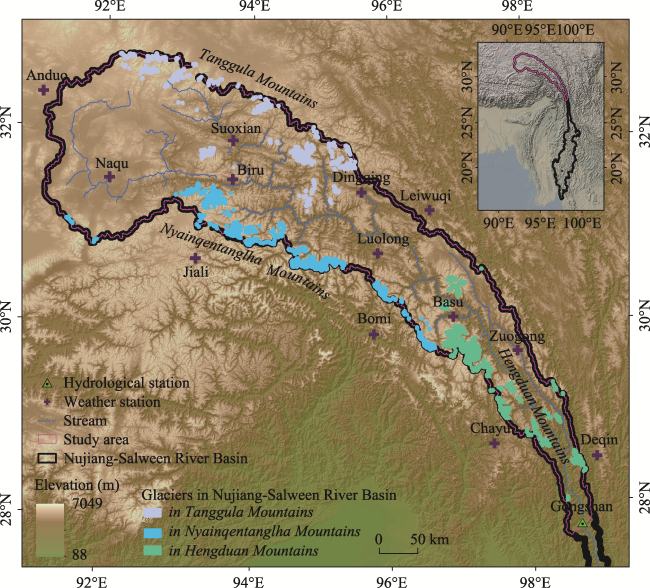
Figure 1 Location of the study area (Nujiang-Salween River Basin) and the distribution of glaciers

3 Data and methods

3.1 Data

This study used remote sensing imagery collected by the Multispectral Scanner (MSS), Thematic Mapper (TM), Enhanced Thematic Mapper Plus (ETM+), and Operational Land Imager (OLI) associated with the Landsat series satellites. The image data were obtained from the US Geological Survey (USGS) website (http://glovis.usgs.gov), and consisted of Level 1 terrain corrected (L1T) products subjected to system radiation correction, ground control point correction, and terrain correction based on digital elevation model (DEM) data. Some image processing was required for glacier boundary extraction as multi-phase image pixels can become deformed and shift in some areas due to undulations in the terrain. Therefore, the image processing software ENVI was used to perform image registration and geometric correction. A considerable amount of time was also spent screening the images to eliminate those with cloud and snow interference, thereby reducing potential sources of uncertainty in the extracted glacier boundaries. For time intervals when few remote sensing images were available or the data quality was unsatisfactory, images collected in adjacent years (±2 years) were used. In addition, when no clear image was available for a certain location (for example, because of seasonal snow cover or clouds), images with partial coverage of the location were selected and stitched together. This method can eliminate the impact of clouds and seasonal snow to a certain extent. Besides, the images of different dates may also have different solar elevation angles that can be conducive to reducing the impact of shadows. Ultimately, a total of 54 images were obtained to represent periods covering several years around 1975, 2000, and 2020. The selected Landsat images are listed in Table 1.
Table 1 Landsat images used to delineate glaciers in the Nujiang-Salween River Basin during periods around 1975, 2000, and 2020
Period Date Path/Row Cloud cover (%) Sensor Spatial resolution
Around 1975 1974-01-05 142/41 2.0 Landsat MSS 80 m
1975-11-30 143/41 3.0
1974-01-05 142/40 4.0
1976-10-19 143/40 6.0
1976-10-19 143/39 3.0
1976-11-25 144/39 15.0
1977-08-05 145/38 17.0
1977-08-06 146/38 3.0
1977-08-05 145/39 42.0
1976-12-15 146/39 21.0
1976-12-15 146/38 5.0
1976-12-16 147/37 1.0
1976-12-16 147/39 12.0
1976-12-16 147/38 6.0
1976-12-17 148/37 1.0
1976-12-17 148/38 3.0
2000s 2001-07-04 133/40 19.0 Landsat TM 30 m
2000-07-17 133/40 18.0
1999-09-24 134/40 26.0
1999-06-04 134/39 17.0
2001-07-09 136/38 26.0
2000-07-22 136/38 22.0
1999-09-22 136/38 7.0
2000-07-22 136/39 31.0
1999-09-22 136/39 3.0
2000-08-30 137/37 0.0
2000-12-25 132/41 0.0 Landsat ETM+
2000-12-25 132/40 0.0
2001-12-19 133/39 0.0
2001-12-19 133/40 10.0
2001-10-23 134/39 0.0
2001-10-23 134/38 10.0
1999-09-23 135/39 0.0
1999-09-23 135/38 0.0
2001-07-08 137/39 21.0
2000-12-28 137/39 10.0
2000-12-28 137/38 10.0
Period Date Path/Row Cloud cover (%) Sensor Spatial resolution
2020s 2019-08-16 132/41 6.2 Landsat OLI 30 m
2020-12-24 132/40 0.5
2020-08-25 133/40 21.7
2017-10-20 133/40 9.6
2020-09-01 134/39 15.0
2017-09-25 134/39 27.9
2019-08-14 134/39 23.8
2020-10-10 135/39 35.6
2020-10-10 135/38 0.9
2019-06-25 136/38 14.0
2020-12-20 136/38 0.9
2020-10-17 136/38 1.0
2019-06-25 136/39 54.6
2020-10-24 137/39 0.4
2021-01-28 137/38 0.2
2021-01-28 137/37 0.4
2020-10-31 138/38 1.1
This study also used the Second Chinese Glacier Inventory (SCGI; Liu et al., 2019) for reference to extract glacier boundaries; the dataset was downloaded from the National Cryosphere and Desert Data Center website (http://www.ncdc.ac.cn). In addition, the temperature and precipitation data from 13 meteorological stations located around the study area were used to analyze the climate change trends in the NSRB from 1971 to 2020 (Basic information from these stations is listed in Table S2 in the supplementary material). These data were obtained from the National Climate Centre at the China Meteorological Data Service Center (CMDC, http://data.cma.cn/en). The Shuttle Radar Topography Mission (SRTM) product (30 m resolution), provided by the Earth Resources Observation and Science Center of the US Geological Survey (https://earthdata.nasa.gov), was also used in this study.
Table S2 Basic information of the weather stations used in this study
Name Station ID Elevation (m) Annual average temperature (℃)
Anduo 55294 4694 -2.26
Naqu 55299 4508 -0.52
Suoxian 56106 3995 2.24
Biru 56109 4019 3.85
Dingqing 56116 3948 3.77
Leiwuqi 56128 3826 3.42
Jiali 56202 5246 -0.21
Bomi 56227 2745 9.06
Basu 56228 3294 10.83
Zuogong 56331 4244 4.88
Luolong 56233 3797 5.94
Chayu 56434 2959 12.14
Deqing 56444 3197 5.85

3.2 Methods

3.2.1 Glacier delineation

When delineating glacier areas from satellite images, Global Land Ice Measurements from Space (GLIMS) guidelines (http://www.glims.org/MapsAndDocs/guides.html) were used. Several procedures were followed to extract the glacier boundaries: image preprocessing, automated interpretation, and visual inspection. The specific workflow is illustrated in Figure 2.
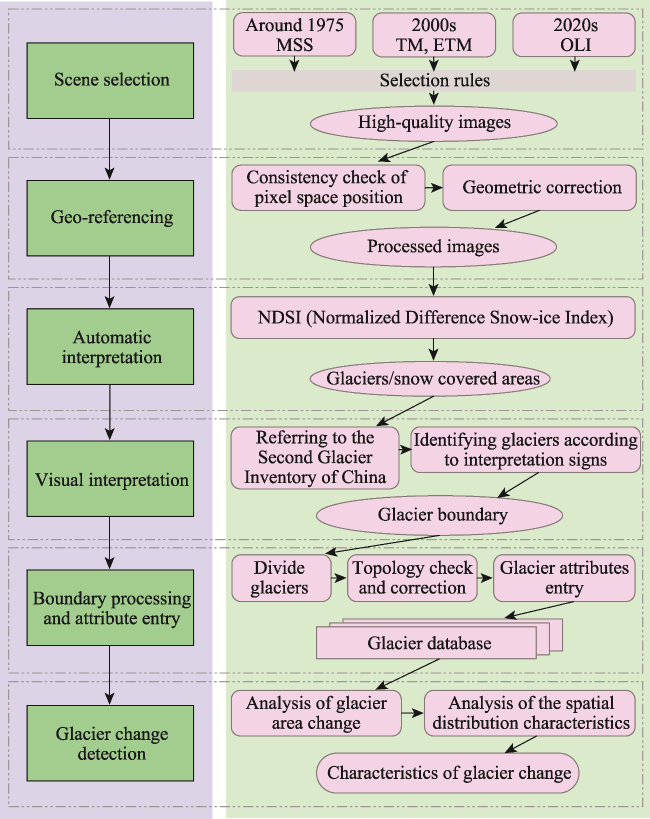
Figure 2 Schematic flow illustrating the multiangle glacier extraction method
Preprocessing was conducted via image screening and georeferencing, as described in Section 3.1 Automated extraction and visual interpretation are generally used to delineate glacier boundaries. Automated image classification methods involve extracting ground feature information in different spectral bands of a satellite image; the combination of data from different bands facilitates the rapid extraction of glacier boundaries. In this study the Normalized Difference Snow-ice Index (NDSI) was used to identify the general ice and snow area, in order to reduce the workload of visual interpretation (Xiao et al., 2001). A suitable threshold value between 0.2 and 0.4 was used to produce glacier outlines. After converting the grid data to vector data, the glacier polygons were visually checked. For debris-free glaciers, seasonal snow was the main influencing factor. For the main process of visual interpretation, especially for MSS image with low resolution, the Chinese glacier inventory dataset was referred to comprehensive identification. The termini of some debris-covered glaciers were difficult to identify using the NDSI method because the spectral characteristics are similar to those of the surrounding bare moraines (Garg et al., 2017). Therefore, debris-covered glaciers were manually delineated. The identification of debris was based on the hydrological characteristics at the glacier terminus and the topography at the lateral margins of the glacier. Several indicators were applied to identify the terminus of debris-covered glaciers, such as supraglacial ponds, ice cliffs, or origin of the water stream, and the end of the glaciers can be determined according to the location of these objects (Sahu and Gupta, 2020). In addition, by comparing the remote sensing images in different periods, some ice lake characteristics can be determined, if the latter images include many small lakes, we can consider them as the debris-covered parts. Owing to the long-term erosion by glacial meltwater, characteristic landscape features form at the glacier terminus, which provide important signs for identifying debris (Guo et al., 2015). The mountain ridge lines were extracted using the DEM data and SCGI-referenced vector data were used for segmentation to delineate individual glaciers. After glacier boundary interpretation, data describing the glacial area were extracted. In this study, the minimum threshold for glacier area was 0.01 km2, and targets with an area less than this threshold are ignored.

3.2.2 Indicators of glacier area change

Two indicators, percentage of area change (PAC) and annual percentage of area change (APAC), were used to analyze and compare the glacier area changes in different time intervals. The PAC and APAC are given by:
$P A C=\frac{\Delta S_{n}}{S_{0}} \cdot 100 \%$
$A P A C=\frac{\Delta S_{n}}{S_{0} \cdot n} \cdot 100 \%$
where S0 is the glacier area at the initial time interval and ΔSn is the change in the glacier area after n years.
APAC is commonly used to evaluate glacier area changes and can be used to effectively compare changes in the area over different spatial and temporal scales (Nie et al., 2010; Zhou et al., 2020). Because the images used to extract the glacier boundaries were collected in different years, the individual glaciers that were extracted were from different time intervals. Therefore, it was necessary to calculate the APAC for each time interval for each glacier and then calculate the annual average rate at which the glacier area changed on a selected regional scale.

3.2.3 Error estimation

Visual interpretation and manual verification methods were used to ensure the reliability of the extracted glacier boundaries. However, due to the spatial resolution of the remote sensing images, some errors remained after vectorization and interpretation of the raster data. In particular, the low spatial resolution (80 m) of Landsat MSS images could lead to large uncertainty around 1975. In this study, 100 glaciers in the study area were visually interpreted based on high-resolution remote sensing images (declassified Corona KH-9 images with 6 m spatial resolution). Then, using this as a reference, the error of glacier boundary interpreted by the MSS image was evaluated. The results show that the average error of glacier area was -4.4% (see Figure S1 and Table S1 in the supplementary material). Nevertheless, there are too few high-resolution images available to be used to fully extract glacier areas or estimate errors. Considering the consistency, this study adopts a unified uncertainty evaluation method for different image types, based on the glacier perimeter and the resolution of remote sensing images (Liu et al., 2020). The equation is as follows:
$U_{A}=0.5 \lambda \cdot P$
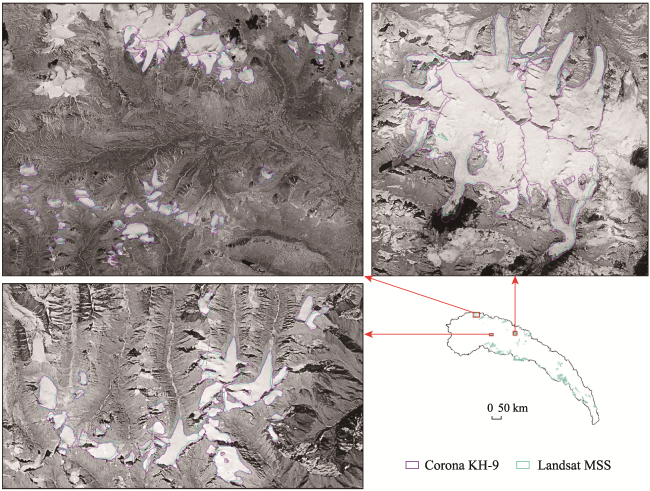
Figure S1 Comparison of glacier boundaries interpreted based on Landsat MSS and Corona KH-9 images
Table S1 Comparison of glacier area extracted based on MSS data and KH data
No. GLIMS_ID Area (km2) Deviation
(km2)
Error rate
(%)
KH-9 MSS
1 G092530E32610N 0.37 0.28 -0.08 -22.45
2 G092531E32593N 0.13 0.07 -0.06 -45.19
3 G092533E32623N 1.20 1.26 0.06 5.25
4 G092537E32591N 0.30 0.25 -0.04 -14.44
5 G092553E32562N 0.15 0.12 -0.03 -22.23
6 G092557E32598N 0.77 0.65 -0.12 -15.27
7 G092560E32589N 0.11 0.13 0.02 15.06
8 G092564E32569N 0.42 0.40 -0.02 -4.10
9 G092564E32581N 0.33 0.42 0.09 26.66
10 G092581E32605N 0.73 0.72 -0.01 -0.67
11 G092585E32600N 0.80 1.08 0.28 35.21
12 G092597E32594N 0.38 0.25 -0.13 -33.06
13 G092608E32559N 0.76 0.27 -0.49 -64.90
14 G092614E32580N 0.72 0.50 -0.22 -30.52
15 G092615E32564N 0.46 0.35 -0.11 -23.52
16 G092623E32729N 1.16 1.17 0.01 1.26
17 G092627E32593N 1.33 1.38 0.05 3.77
18 G092627E32712N 0.54 0.58 0.03 6.19
No. GLIMS_ID Area (km2) Deviation
(km2)
Error rate
(%)
KH-9 MSS
19 G092629E32576N 2.13 1.97 -0.17 -7.79
20 G092629E32720N 0.66 0.66 -0.01 -1.00
21 G092631E32710N 0.58 0.74 0.16 26.93
22 G092638E32571N 0.68 0.53 -0.15 -22.24
23 G092640E32610N 0.70 0.62 -0.08 -11.20
24 G092641E32715N 2.23 2.14 -0.09 -3.95
25 G092646E32596N 0.62 0.67 0.06 9.15
26 G092646E32604N 0.60 0.54 -0.06 -10.56
27 G092647E32616N 0.84 0.79 -0.05 -6.03
28 G092650E32712N 0.62 0.78 0.16 26.06
29 G092653E32719N 0.56 0.71 0.14 25.52
30 G092656E32591N 0.97 0.81 -0.16 -16.52
31 G092662E32724N 1.83 1.73 -0.10 -5.42
32 G092664E32596N 0.27 0.26 -0.01 -5.01
33 G092666E32592N 0.16 0.18 0.02 9.69
34 G092672E32587N 0.89 0.93 0.04 4.58
35 G092673E32713N 0.37 0.29 -0.08 -21.13
36 G092679E32736N 3.22 3.23 0.02 0.48
37 G092680E32586N 0.51 0.56 0.05 10.45
38 G092680E32708N 0.71 0.71 0.00 0.36
39 G092690E32720N 4.99 4.95 -0.05 -0.97
40 G092694E32707N 1.75 1.56 -0.18 -10.59
41 G092701E32585N 0.81 0.59 -0.23 -27.97
42 G092707E32583N 0.34 0.33 -0.01 -3.29
43 G092708E32696N 0.91 0.99 0.08 8.51
44 G092709E32706N 1.40 1.25 -0.15 -10.90
45 G092714E32719N 0.52 0.69 0.17 32.79
46 G092728E32696N 1.46 1.28 -0.19 -12.88
47 G092746E32619N 1.12 0.97 -0.15 -13.36
48 G092770E32720N 0.86 1.07 0.20 23.70
49 G092794E32716N 0.46 0.66 0.20 42.86
50 G092795E32707N 0.22 0.22 0.00 1.07
51 G092801E32724N 1.61 1.87 0.27 16.52
52 G092811E32717N 0.63 0.86 0.23 35.80
53 G092812E32698N 0.39 0.40 0.01 2.42
54 G092816E32690N 0.53 0.53 0.00 -0.78
55 G093384E31763N 1.11 1.16 0.05 4.26
56 G093390E31752N 0.49 0.38 -0.11 -22.60
57 G093391E31737N 0.08 0.10 0.02 20.86
58 G093394E31745N 0.64 0.67 0.02 3.36
59 G093400E31763N 0.13 0.20 0.07 50.87
60 G093402E31768N 0.20 0.19 -0.01 -3.85
No. GLIMS_ID Area (km2) Deviation
(km2)
Error rate
(%)
KH-9 MSS
61 G093403E31742N 0.50 0.39 -0.10 -20.26
62 G093409E31746N 0.18 0.12 -0.05 -30.08
63 G093413E31738N 0.87 0.80 -0.07 -8.57
64 G093414E31748N 0.04 0.03 -0.01 -16.42
65 G093424E31734N 0.28 0.20 -0.08 -28.98
66 G093434E31735N 0.32 0.30 -0.02 -5.35
67 G093435E31740N 0.33 0.20 -0.13 -39.78
68 G093439E31741N 0.15 0.09 -0.06 -36.70
69 G093439E31748N 0.36 0.33 -0.03 -8.86
70 G093439E31756N 0.42 0.44 0.02 5.13
71 G093448E31742N 2.08 1.70 -0.37 -17.86
72 G093463E31801N 0.46 0.41 -0.05 -11.19
73 G093465E31763N 0.79 0.74 -0.05 -6.35
74 G093466E31746N 0.86 1.01 0.14 16.36
75 G093467E31754N 0.28 0.22 -0.06 -20.94
76 G093472E31771N 2.73 2.45 -0.29 -10.51
77 G093475E31732N 2.11 1.74 -0.37 -17.49
78 G093475E31758N 0.43 0.36 -0.07 -17.21
79 G093488E31767N 2.25 2.25 0.00 0.07
80 G093496E31745N 0.22 0.16 -0.06 -25.92
81 G093496E31761N 0.39 0.33 -0.06 -15.93
82 G093497E31752N 0.17 0.16 -0.01 -8.70
83 G093501E31771N 0.39 0.35 -0.04 -9.13
84 G093514E31798N 0.58 0.60 0.02 4.06
85 G093515E31792N 0.47 0.40 -0.07 -14.18
86 G094626E31817N 3.80 3.46 -0.34 -8.86
87 G094626E31837N 5.98 5.87 -0.11 -1.90
88 G094631E31856N 2.37 1.88 -0.49 -20.67
89 G094667E31807N 37.81 36.25 -1.56 -4.12
90 G094684E31847N 17.64 16.90 -0.74 -4.19
91 G094692E31769N 2.10 1.72 -0.38 -17.95
92 G094702E31775N 0.85 0.76 -0.09 -10.96
93 G094702E31855N 0.60 0.62 0.02 3.82
94 G094710E31868N 1.87 1.82 -0.05 -2.49
95 G094713E31856N 0.39 0.48 0.09 23.16
96 G094716E31863N 0.21 0.26 0.04 20.69
97 G094720E31839N 11.34 11.06 -0.28 -2.48
98 G094728E31782N 24.11 22.62 -1.50 -6.20
99 G094732E31843N 0.65 0.55 -0.10 -15.37
100 G094745E31824N 15.36 14.97 -0.40 -2.57
Sum 193.21 184.64 -8.57
Avg -4.40
where UA is the uncertainty of the extracted area of an individual glacier in a certain image; λ is the spatial resolution of each image; and P is the perimeter of the glacier boundary (Liu et al., 2020). The uncertainties of glacier area around the years 1975, 2000, and 2020, were estimated to be 252.65, 94.67, and 88.05 km2, respectively, accounting for ±14.86%, ±6.88%, and ±7.23% of the total glacial area, respectively.
The uncertainty in the change in glacier area was estimated using Equation (4):
$U_{A C}=\sqrt{u_{1}^{2}+u_{2}^{2}}$
where UAC is the uncertainty in the change of a glacier area over a certain time interval, u1 is the uncertainty in the glacier area at the beginning of the selected time interval, and u2 is the uncertainty in the glacier area at the end of the selected time interval. This method helps to estimate two types of uncertainty in the upper part of the glacier, where adverse snow conditions create problems in adjusting minor glacier changes, as well as the uncertainty generated when delineating a single glacier (Sahu and Gupta, 2020). Using Equation (4), the uncertainties in the glacier area change during 1975-2000, 2000-2020, and 1975-2020 were determined as ±16.28%, ±9.90%, and ±16.46%, respectively.

3.2.4 Hot-spot analysis

The present study uses the hot-spot analysis method to characterize the spatial distribution of changes in the glacier area. Hot-spot analysis requires the calculation of the Getis-Ord Gi* statistic for each feature in the spatial dataset to determine the spatial clustering pattern of all features (Getis and Ord, 1992). Hot-spot analysis is based on the principle that the local sum of a certain feature and its neighboring elements can be compared with the sum of all elements. When the local sum is differs from the expected local sum and this difference cannot be attributed to random chance, a statistically significant z-score is generated. By calculating the z-scores and p-values, it is possible to determine the spatial clustering of high- and low-value features. The Getis-Ord G* score is obtained using the following equations:
$Z\left(G_{\mathrm{i}}^{*}\right)=\frac{\sum_{j=1}^{n} w_{i, j} \cdot x_{j}-\bar{x} \cdot \sum_{j=1}^{n} w_{i, j}^{2}}{\mathrm{~S} \cdot \sqrt{\frac{n \cdot \sum_{j=1}^{n} w_{i, j}^{2}-\left(\sum_{j=1}^{n} w_{i, j}\right)^{2}}{n-1}}}$
$S=\sqrt{\frac{\sum_{j=1}^{n} x_{j}^{2}}{n-1}-(\bar{x})^{2}}$
$\bar{x}=\frac{\sum_{j=1}^{n} x_{j}}{n}$
where Z(Gi*) is the z-score of patch i and xj is the attribute value for patch j. wi,j is a weight that can be defined as the inverse of the distance between locations i and j.$\bar{x}$is the average value of x with sample number n.
High z-scores and low p-values indicate hotspots, whereas low z-scores and low p-values indicate cold spots. A negative z-score value and small p-value indicates that there is no clear grouping in the area. Based on the confidence distributions, the calculated spatial clusters were classified into three types of “hot spot” sites (90%, 95%, and 99% confidence intervals), three types of “cold spot” sites (90%, 95%, and 99% confidence intervals), and “not significant” sites. Hot-spot analysis only detects the clustering of sample dataset features that are based on a target eigenvalue, whereas outliers cannot be detected. Thus, hot-spot analysis was used to accurately reflect regional distribution characteristics.

4 Results

4.1 Changes in glacier area and number

The results indicate that the total area covered by glaciers in the study area during the periods around 1975, 2000, and 2020 was 1696.04, 1375.37, and 1218.26 km2, respectively, as shown in Figure 3. In the past 45 years (1975-2020), the glacier area in the NSRB shrunk by 477.78 km², which accounts for 28.17% of the total glacier area that was present around 1975. However, the rate of glacier retreat differed during the two periods. The glacier area shrunk by 320.67 km² during 1975-2000, which corresponds to a relative area change of 18.91%, whereas it shrunk by 157.11 km2 during 2000-2020, which corresponds to a relative area change of 11.42%. Considering the annual average change in area over the investigated period, the glacier area in the NSRB decreased at a rate of 15 km2/a before 2000 and 8.7 km2/a after 2000. The annual average rate during the two time intervals indicates that the total glacier area in the NSRB has been shrinking continuously over the studied period, but the rate of decline has gradually decreased.
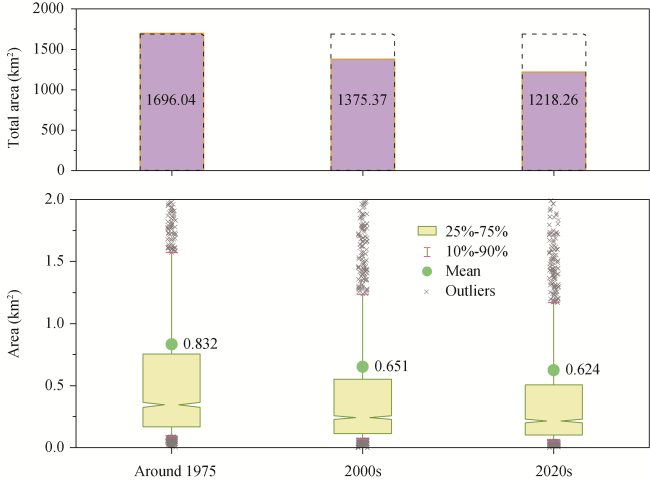
Figure 3 Glacier area in the Nujiang-Salween River Basin at different time intervals
Moreover, the number of glaciers in the NSRB increased from 2037 around 1975 to 2111 in the 2000s, and then decreased to 1952 in the 2020s. The increase in the number of glaciers may be explained by the breakup of large glaciers before 2000 followed by the shrinking of some smaller glaciers until they disappeared completely after 2000, leading to overall fewer glaciers. Figure 3 shows that the study area is dominated by small glaciers, with nearly 90% of glaciers having an area of less than 1.6 km2 (around 1975). Notably, the annual average area change reflects the number of glaciers and the glacier area change; the average area change decreased significantly from 0.83 km2 in around 1975 to 0.65 km2 in the 2000s, and decreased further to 0.62 km2 over the following 20 years. This indicates that although the number of glaciers increased before 2000 and then decreased, the size of individual glaciers continued to decrease continuously, and the annual average glacier area in the NSRB decreased gradually after 2000.
The glaciers in the study area were categorized into six ranks based on their surface area, with size thresholds of 2-3, 2-1, 21, 23, and 25 km2. The glacier area and the number of glaciers in each rank around the three years studied (~1975, ~2000, and ~2020) are shown in Figure 4. It is evident that the maximum cumulative glacier area corresponds to the 2-1-21 km2 ranks, while the maximum number of glaciers corresponds to the 2-3-2-1 km2 ranks. Considering the glacier change in all three time intervals, both the number and the cumulative area covered by glaciers sized 0.5 km2 and above and the number of glaciers in all ranks showed a decreasing trend, while a decreasing trend was observed for the area covered by glaciers of ranks 2-3-2-1 km2, with the number of glaciers first increasing slightly and then decreasing significantly. Both the area and number of rank 2-3 km2 glaciers showed an increasing trend, with the former likely caused by the significant retreat of adjacent glaciers and the latter by the breakup of larger glaciers. Figure 4 also shows that the glacier area in this rank (>25 km2) was significantly reduced from around 1975 to the 2000s. There were five glaciers larger than 32 km2 (>25 km2) around 1975, with a total area of 192.42 km2; By the 2000s, there were only three in the same rank, with a total area of 111.47 km2. When the large glacier retreats, the end of the glacier may separate. This can explain the situation in Figure 4, in which two large glaciers split into two and three small glaciers, respectively.
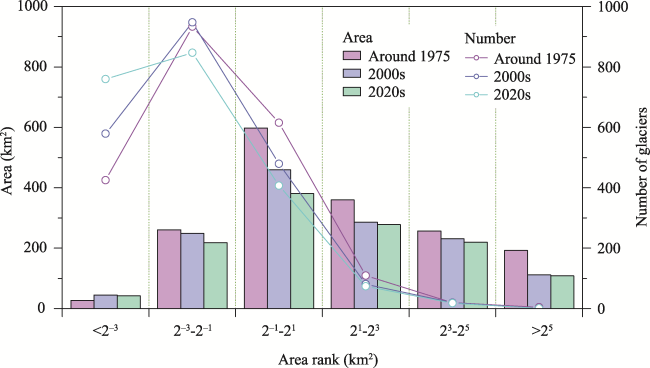
Figure 4 Changes in the glacier area and number of glaciers of different ranks in the Nujiang-Salween River Basin
The APAC of individual glaciers in the basin was also calculated, as shown in Table 2. It was found that in the studied period (from around 1975 to the 2020s), the annual average change in the area covered by glaciers in the NSRB was -0.84%; this was calculated as -0.80% before 2000 and -1.16% after 2000. Moreover, the annual relative change in the size of mid-size glaciers (area of 0.5-8 km2) was relatively high before 2000, exceeding -1% annually, whereas from the 2000s to the 2020s, smaller glaciers (area less than 0.5 km2) retreated at a significantly faster rate of approximately -1.3%/a than large glaciers. In general, the smaller the glacier size, the greater its relative change in area.
Table 2 Annual percentage of area change (APAC) for glaciers of different sizes during 1975-2020 (only the original number of individual glaciers in each rank is considered, and glaciers that formed after the area changed are not considered)
Area rank (km²) APAC (%/a)
Around 1975-2000s 2000s-2020s Around 1975-2020s
< 2-3 -0.01 -1.29 -0.67
2-3-2-1 -0.90 -1.31 -0.90
2-1-21 -1.06 -0.89 -0.89
21-23 -1.03 -0.33 -0.72
23-25 -0.64 -0.23 -0.47
> 25 -0.75 -0.15 -0.46
In total -0.80 -1.16 -0.84

4.2 Changes in glacier area at different elevations and aspects

The DEM data were also used to statistically analyze the elevation of the areas covered by glaciers. The changes in glacier area with respect to elevation show an approximately normal distribution, as seen in Figure 5. The glacier elevation ranged from 3000 m to 7000 m around 1975, with the highest concentration of glaciers observed between 4500 m and 6000 m, accounting for 96.70% of the total glacier area. By the 2000s, the lowest elevation at which glaciers could be observed in the study area increased to approximately 3210 m, and further increased to 3430 m by the 2020s.
Figure 5 Distribution of changes in glacier area at different elevations in the Nujiang-Salween River Basin
Figure 5 shows that changes in the glacier area within the NSRB occur primarily in the mid- and low-altitude areas. With respect to glacial retreat in the NSRB, 90% of the glacier area shrinkage occurred at altitudes below 5580 m during 1975-2000, while 90% of the shrinkage occurred below 5455 m during 2000-2020. Considering the total area over which the glaciers have retreated over the study period (1975-2020), 50% of the glacier shrinkage occurred below 5240 m and 90% below 5540 m. The most severe shrinkage (40% of the total area) occurred at elevations between 5290 m and 5540 m (250 m), which is close to the median elevation at which glaciers are found in the study area.
The distribution of glacier areas and their changes in different aspects (N, NE, E, SE, S, SW, W and NW) were also analyzed. Figure 6 shows that the distribution of glaciers in the study area is not uniform over different aspects, with the overall trend higher in the NE and lower in the SW, which is consistent with the distribution of solar irradiation on different aspects. In the years around 1975, 2000, and 2020, more than 50% of the total glacier area was on the slopes facing NE, E, and N (51.66%, 53.16%, and 52.22%, respectively), while less than 20% of the total area was on the slopes facing SW, W, and S (19.75%, 18.69%, and 18.97%, respectively) of the study area, indicating that the distribution of glaciers on different aspects has generally been relatively stable.
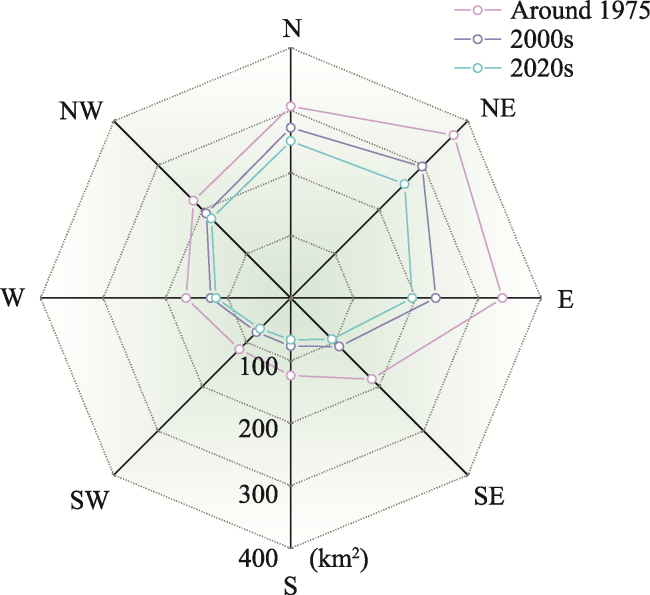
Figure 6 Distribution of changes in the glacier area in different aspects in the Nujiang-Salween River Basin
Glacial retreat has occurred across all aspects over the study period, but the degree of shrinkage has varied. It is evident from Figure 6 that the decrease in the glacier area was greater in the NE and lower in the SE. However, the ratio of glacier area shrinkage to total glacier area was higher in the SW than in the NE during 1975-2020. The glacier area shrunk by 30.63% on slopes facing NE, E, and N and by 37.26% on those facing SW, W, and S, indicating that the glaciers on the SW-facing slopes have retreated relatively quickly.

4.3 Glacier area changes in different mountains

Although the glacier area in the NSRB has shown an overall decreasing trend, the changes in glacier area have significantly differed in different regions. To determine the regional differences, a statistical analysis of the glaciated area in different mountain ranges within the study area (Tanggula Mountains, Nyainqentanglha Mountains, and Hengduan Mountains) was performed. The statistical data in Table 3 show that the greatest amount of glaciers were in the Nyainqentanglha Mountains around 1975, with an area of 662.66 km2, accounting for 39.07% of the total area; this was followed by the Hengduan Mountains with a glacier area of 552.86 km2 and the Tanggula Mountains with a glacier area of 480.52 km2, accounting for only 28.33% of the total glacier area.
Table 3 Glacier area of different mountain ranges in the Nujiang-Salween River Basin in different periods
Mountains Around 1975 2000s 2020s
Area (km2) Percentage (%) Area (km2) Percentage (%) Area (km2) Percentage (%)
Hengduan Mountains 552.86 32.60 402.36 29.25 331.32 27.20
Nyainqentanglha Mountains 662.66 39.07 559.46 40.68 508.35 41.73
Tanggula Mountains 480.52 28.33 413.55 30.07 378.59 31.08
Total 1696.04 100 1375.37 100 1218.26 100
Although the glacier area has decreased on all three mountain ranges over the study period, the largest glaciated area has consistently been observed on the Nyainqentanglha Mountains, where the proportion of the total glacier area has increased overall. In contrast, the proportion of the glacier area in the Hengduan Mountains decreased from 32.6% around 1975 to 29.25% in the 2000s, falling below that of the Tanggula Mountains (30.07%). In the 2020s, the glacier area ratio in the Hengduan Mountains decreased further, whereas that of the Nyainqentanglha Mountains and Tanggula Mountains increased.
During the study period, the glacier area in the Hengduan Mountains, the Nyainqentanglha Mountains and the Tanggula Mountains decreased by 221.53, 154.51, and 101.93 km2, respectively, accounting for 40.07%, 23.32%, and 21.21% of the total glacier area in each mountain region, respectively. It is evident that the most severe glacier area shrinkage occurred in the Hengduan Mountains, followed by that in the Nyainqentanglha Mountains. The glacier area has remained fairly constant in the Tanggula Mountains.
Figure 7 shows that the glacier area on Hengduan Mountains decreased the most (-150.5 km2) during 1975-2000, accounting for 27.22% of the total area, followed by that on the Nyainqentanglha Mountains, where the glacier area shrunk by 15.57%, with the lowest area shrinkage of 9.33% occurring on the Tanggula Mountains. The Hengduan Mountains continued to present the highest glacier area shrinkage at 17.65% during 2000-2020, while the Nyainqentanglha Mountains and Tanggula Mountains showed similar shrinkages of 9.14% and 8.46%, respectively, during this time period. It is evident that the glaciers on the Hengduan Mountains shrank considerably during the study period, while the area covered by glaciers on the Tanggula Mountains has remained fairly constant.
Figure 7 Glacier area changes in different mountain ranges of the Nujiang-Salween River Basin
A further analysis of APAC in each mountain range was carried out for each time interval, as shown in Figures 7c and 7d. The APAC of the Hengduan Mountains greatly exceeded that of the other two mountain ranges over the study period, while that of the Nyainqentanglha Mountains and Tanggula Mountains was relatively close. The APAC decreased after 2000 in all three mountain ranges, indicating that the glacial retreat is slowing in all three regions.

4.4 Hot-spot analysis of glacier area change

Figure 8 shows the distribution pattern of the hot and cold spots for glacier area change in the basin before and after 2000; the distribution of these changes differs over the two time intervals. No cold spots were detected before 2000, indicating no obvious clusters of glaciers with small changes in area. During the same interval, six obvious hot spots were formed. However, Table 4 shows that the number of hot spots accounted for less than 5% of the total area (with a > 90% confidence level). This indicates that although the overall area covered by glaciers decreased greatly before the year 2000, significant hot spots were relatively rare, indicating that the changes in the glacier area were spatially heterogeneous. The average areal change of 1.81 km2 with a variance of 5.605 in the high-confidence (99%) hot spot areas is significantly high as compared to the changes observed under the remaining two confidence levels (95% and 90%). These results show that glaciers with greater changes in the surface area show more significant clustering. The hot spots were primarily distributed in the Hengduan Mountains and Nyainqentanglha Mountains, and only one hot spot located in the Tanggula Mountains (Figure 8). This is consistent with the previous results, which indicated that the glacial area in the Hengduan Mountains and Nyainqentanglha Mountains showed greater changes. After 2000, the spatial clustering of the changes in the glacier area within the basin was relatively more complex. Figure 8 shows six cold spot areas after 2000. The number of hot spots accounts for almost 15% of the total number of glaciers (Table 4), indicating that a considerable number of glaciers did not shrink significantly during this period (0.03-0.04 km2); the variance in the areal change is also small (0.002-0.004), which indicates that the range of change in areas with cold spot glaciers is small. Figure 8 shows that seven more hot spots formed after 2000, mostly at the 90% and 95% confidence level. The greater number of hot spots indicates that the number of glaciers showing significant areal changes continued to increase steadily during this period.
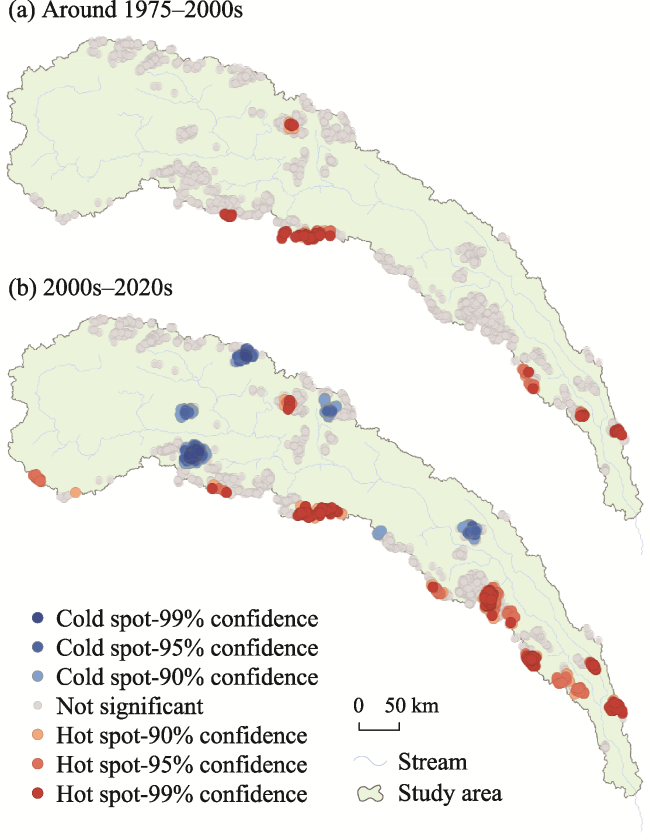
Figure 8 Hot spots of glacier area change in the Nujiang-Salween River Basin
Table 4 Statistical analysis data for cold and hot spots of glacier changes over different time intervals in the Nujiang-Salween River Basin
Hot and cold spots
confidence level
Proportion of glacier number (%) Average change area (km2) Variance
Around
1975- 2000s
2000s-2020s Around
1975 -2000s
2000s-2020s Around
1975 -2000s
2000s-2020s
Cold spot-99% confidence 0 3.02 - 0.04 - 0.002
Cold spot-95% confidence 0 6.67 - 0.03 - 0.002
Cold spot-90% confidence 0 6.28 - 0.04 - 0.004
Not significant 95.51 65.79 0.16 0.08 0.058 0.009
Hot spot-90% confidence 1.05 3.56 0.66 0.19 0.304 0.044
Hot spot-95% confidence 1.01 5.78 0.67 0.22 0.285 0.055
Hot spot-99% confidence 2.45 8.85 1.81 0.23 5.605 0.085
According to Table 4, although there was a significant increase in the number of hot spot glaciers during this interval (more than 18%), the average changes in area and variance were small, indicating that the degree of changes decreased, despite the formation of more hot spots after 2000. Most hot spots indicating significant glacier area changes were concentrated in the Hengduan Mountains and Nyainqentanglha Mountains, which are in the southeast and central parts of the NSRB, respectively. After 2000, the number of cold and hot spots increased, indicating that the glacier area change became more spatially heterogeneous. This may be related to the spatial characteristics of climatic factors, such as a heterogeneous spatial distribution of precipitation and temperature changes.

5 Discussion

5.1 Links between glacier variation and climate change

Mountain glaciers are the product of both climate and topography (Wang et al., 2017). Climatic factors are likely the most important of the factors affecting glacier changes (Farinotti et al., 2015). The accumulation and ablation of glaciers are controlled by two main factors: temperature and precipitation (Zhang et al., 2019). Temperature affects the ablation of glaciers, while precipitation affects the accumulation of glaciers; the combination of these factors, therefore, determines the survival of a glacier.
Based on the precipitation and temperature data from 13 meteorological stations around the study area (Figure 1), we used the statistical Mann-Kendall test (Mann, 1945; Kendall, 1975) and Sen’s slope estimator (Sen, 1968) to analyze the climate trends in the study area; we found that the study area has become warmer and wetter since the 1970s. Figure 9 indicates that a temperature increase at all 13 meteorological sites (0.16-0.55℃/10a). All the statistical analysis results were found to be significant (p<0.05). The average rate of temperature increase in the study area (0.38℃/10a) far exceeds the global average rate of 0.202℃/10a (Ren et al., 2017) and the 0.32℃/10a rate observed on the Tibetan Plateau (Yan and Liu, 2014). It is well established that precipitation shows a greater spatial and temporal variation than temperature (Bolch, 2007). Accordingly, the spatial variation in precipitation was found to be relatively high (-5.5 to 37.4 mm/10a). Except for two stations, which showed decreasing trends, all studied stations presented increasing precipitation trends. Although the trends were statistically significant for less than one-third of the stations (Figure 10), the over all precipitation still increased at a rate of 12.7 mm/10a. However, in comparison, the temperature changes in the study area are more significant. According to the above results, the overall glacier area retreated by 28.17% with an annual average shrinkage of 11.64 km2 over the past 45 years. It appears that this loss can be primarily attributed to the continuous and significant rise in temperature in the study area over the recent years. However, the increase in precipitation has somewhat slowed down the retreat of the glaciers.
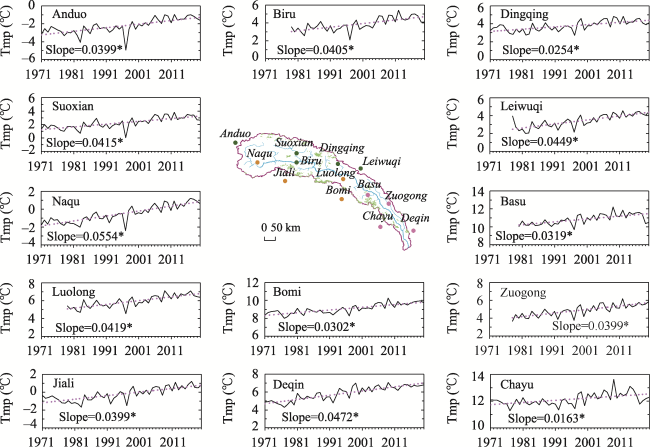
Figure 9 Temperature trend at each meteorological station in the Nujiang-Salween River Basin from 1971 to 2020 (the asterisk indicates that the trend analysis results were statistically significant, p<0.05; the different colored dots on the map of the study area represent the meteorological stations in the different mountain ranges)
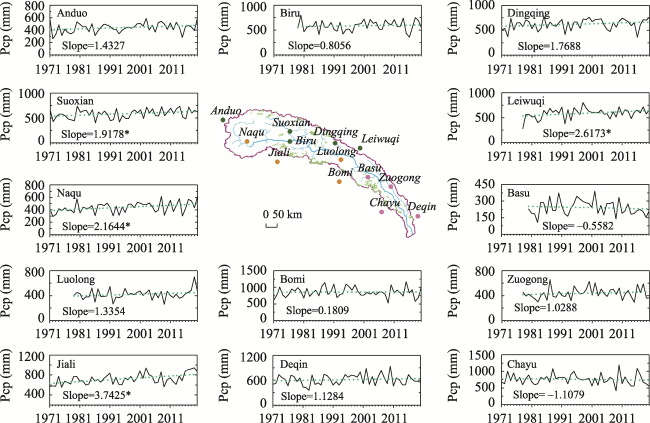
Figure 10 Precipitation trend at each meteorological station in the Nujiang-Salween River Basin from 1971 to 2020 (the asterisk indicates that the trend analysis results were statistically significant, p<0.05; the different colored dots on map of the study area represent the meteorological stations in the different mountain ranges)
We further carried out a comparative analysis of the mean annual precipitation and mean annual temperature trends in the study area before and after 2000. The results show that the rate of glacier retreat in different time periods showed a positive response to temperature changes in the corresponding time intervals. During 1975-2000, the temperature increased significantly, at a rate of 0.51℃/10a (p < 0.05), while precipitation increased only slightly at a rate of 3.36 mm/10a. After the 2000s, the temperature continued to increase, but the rate decreased to 0.31℃/10a, and precipitation showed a slightly decreasing trend of -0.75 mm/10a. The results of the preceding glacier area analysis showed that the glacier area retreated at a rate of 15 km2/a before the 2000s and 8.7 km2/a after the 2000s, which is consistent with the weakened trend of increasing temperature. Oerlemans (2005) proposed that an increase in precipitation by 25% is required to offset the impact of a 1℃ temperature rise for the loss in glacial mass. Accordingly, the overall change in precipitation in the study area was too low to noticeably offset the impact of the temperature rise. Consequently, rising temperature is the decisive factor leading to glacier area shrinkage in the study area.
Studies have shown that the effects of climate change are spatially heterogeneous. Glaciers are the most sensitive indicators of climate change; therefore, the glacial response to climate change should also present spatial heterogeneity. The trend data listed in Table 5 show that the temperature increased at a rate of 0.26, 0.53, and 0.49℃/10a in the Hengduan Mountains, the Nyainqentanglha Mountains, and the Tanggula Mountains, respectively; all trends were statistically significant (p<0.05). In the same three regions, the precipitation trend was found to be -27.32, 9.94, and 20.17 mm/10a, respectively; however, the precipitation trend in the Nyainqentanglha Mountains was not significant. These results show that the characteristics of climate change differed in the three mountainous regions. All increasing trends in temperature were found to be significant, but the increase in temperature in the Nyainqentanglha Mountains and Tanggula Mountains was much higher than that in the Hengduan Mountains. The differences in the precipitation trends are more obvious, with a significantly increasing trend in the Tanggula Mountains and a significantly decreasing trend in the Hengduan Mountains. It is evident that the spatial differences in the rate of glacier area changes can be explained by the combined effect of changes in both precipitation and temperature in the corresponding regions of the study area. The Hengduan Mountains showed a significant decreasing trend in precipitation and a significant increasing trend in temperature, both of which promote glacial retreat, indicating that this region should show the greatest shrinkage in glacier area. The Nyainqentanglha Mountains showed the most significant temperature rise but only a slight increase in precipitation, which could only slow down the glacial area shrinkage to a small extent; consequently, the glacier area shrinkage in this region was also high and followed that in the Hengduan Mountains. Finally, the Tanggula Mountains, which showed the smallest decrease in glacier area, showed a significant increasing trend for both precipitation and temperature; therefore, the precipitation in this region was sufficient to offset the impact of temperature rise on the glacier area.
Table 5 Changes in precipitation and temperature in the different mountain ranges in the Nujiang-Salween River Basin from 1971 to 2020 (the asterisk indicates that the trend analysis result passed the significance level test, p<0.05)
Mountains Linear trends
Precipitation (mm/10a) Temperature (℃/10a)
Hengduan Mountains -27.32* 0.26*
Nyainqntanglha Mountains 9.94 0.53*
Tanggula Mountains 20.17* 0.49*
Nevertheless, further quantitative analysis is required to elucidate the effect of climate change on glacier accumulation and ablation. However, more robust quantitative analyses require the availability of precipitation and temperature data. The representativeness of the meteorological stations used in the present study may also have affected the results of our analysis. The selected meteorological stations are located deep in the river valley, and the data gathered at these locations cannot fully reflect the climatic changes in the glacial regions, especially those at high altitudes. We considered using gridded temperature and precipitation data. However, interpolated gridded data are generated using extrapolation of lower elevation observed records. Satellite-based estimates have limited data lengths and often perform poorly at high altitudes. Reanalysis data are not homogenized for climate trend analysis; and global climate models generally have poor spatial resolutions (Pepin et al., 2015; Gao et al., 2018). Observations obtained from meteorological stations are still the most reliable data. Based on in-situ data, we analyzed the relationship between the annual average temperature and altitude in this area. There was a significant negative correlation (R2 = 0.77), which shows that the temperature data obtained from the meteorological station can reliably predict the temperature in the high-altitude area (see Figure S2 in the supplementary material). In addition, previous studies have shown that the southeastern Tibetan Plateau always exhibits elevation-dependent warming (EDW) phenomenon for most of time scales (Li et al., 2020). This indicates that the temperature rise rate of the high-altitude mountains in the study area will not be lower than the changes observed at the station. Overall, the results of this study can elucidate the relationship between glacier area changes and regional climatic changes in the NSRB. In general, an increase in the temperature leads to glacial retreat, while an increase in precipitation can weaken or offset the adverse effects of the temperature rise. The present study found that the significant rise in the temperature of the NSRB is the main reason for the significant decrease in the glacier area observed over the study period. Moreover, as the significant warming trend continues, we can expect that the glacier area in the NSRB will continue to shrink.
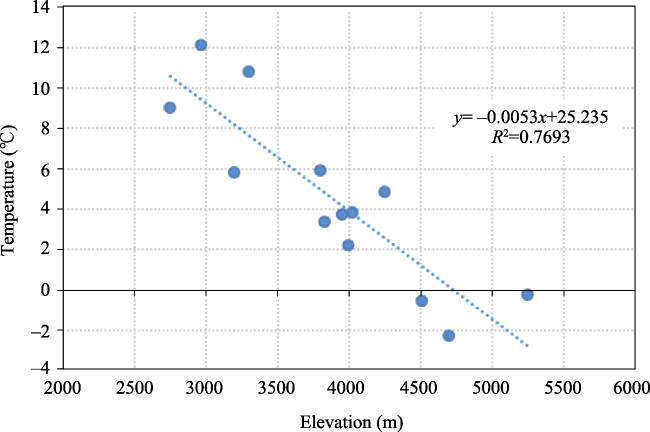
Figure S2 The relationship between the annual average temperature and the elevation of meteorological stations in upper Nujiang-Salween River Basin

5.2 Comparison of glacier area change with that in other regions

Studies have shown that global warming has led to a worldwide trend of glacier retreat (IPCC, 2019; Li et al., 2019). Accordingly, most glaciers in western China are retreating (Ye et al., 2017). To further investigate the glacier change characteristics in the NSRB, we selected typical mountainous areas and river basins in western China to compare the relative rate of glacier area change (APAC) in these regions with those in our study area (Table 6).
Table 6 Comparison of glacier changes within typical regions of western China in recent decades
Regions Period Area changed (km2) Change rate (%) APAC
(%/a)
References
Shule River Basin Basins 2000-2015 -57.5±2.68 -11.9±0.60 0.79±0.04 Zhang et al., 2018
Heihe River Basin 1960s-2010 -130.51 -36.08 -0.60 Huai et al., 2014
Aksu River Basin 1975-2016 -965.7 -25.88 -0.63 Zhang et al., 2019
Irrawaddy River Basin 1976-2015 -39.21±4.94 -54.3±7.64 -1.39±0.03 Taft and Kühle, 2018
Lancang-Mekong River Basin (1968-1975)-
(2005-2010)
-98.50±26.61 30%±8 0.75±0.2 Liu et al., 2015
Nujiang-Salween River Basin Around
1975-2020s
-477.78 -28.17 -0.62 This study
Tianshan Mountains Moun tains 1959-2010 -1619.8 -18.4 -0.4 Xing et al., 2017
Qilian Mountains 1956-2010 -420.8 -20.9 -0.4 Sun et al., 2018
Gangdisê Mountains 1970-2016 -854.05 -39.53 -1.09 Liu et al., 2020
Himalaya Mountains 1990-2015 2553.10 -10.99±0.23 -0.44±0.014 Ji et al., 2020
Hengduan Mountains 1990-2014 136.45±5 9.51±0.35 -0.40±0.26 Wang et al., 2017
Eastern Nyainqêntanglha Mountains 1999-2015 1285.99±6.01 -19.76±3.78 -1.24 Ji et al., 2018
Tanggula Mountains 1969-2015 -509.5 -20.8 -0.5 Duan et al., 2019
Hengduan Mountains in study area Around
1975-2020s
221.53 40.07 -0.89 This study
Nyainqentanglha Mountains in study area Around
1975-2020s
154.51 23.32 -0.51 This study
Tanggula Mountains in study area Around 1975 -2020s 101.93 21.21 -0.47 This study
Three inland rivers in northwest China and two transboundary rivers in southwest China were selected for basin-scale comparisons. Table 6 shows that the relative rate of glacier area change (-0.62%/a) in the NSRB is comparable to that in the Heihe River Basin (-0.60%/a) and Aksu River Basin (-0.63%/a) in northwest China, but is lower than that in the Shule River Basin (0.79 ± 0.04%/a), which may be related to the study period. The Shule River Basin glaciers were studied over a relatively short interval (2000-2015) using data collected after 2000, when the rate of glacier area shrinkage was generally accelerating (Zhang et al., 2018). Therefore, it may be inferred that if the study interval was extended into the 1970s, the overall rate of change may be lower. Similar to the glaciers in the NSRB, those in the Irrawaddy River Basin and Lancang-Megong River Basin are located in the southeastern part of the Tibetan Plateau, and therefore have a comparable climate and geographical environment. Based on the data in Table 6 for the three basins, the Irrawaddy River Basin showed the fastest rate of glacier area change (-1.39 ± 0.03%/a), followed by the Lancang-Mekong River Basin (0.75 ± 0.2%/a), and the NSRB. These results may be related to the size of the glaciers in each basin; in the early period (the 1970s), the total glacier area in the Irrawaddy River Basin and Lancang-Mekong River Basin was 33.00 ± 2.55 and 328.16 ± 20.29 km2, respectively, and the annual average glacier area was 0.26 and 0.78 km2, respectively. These values are lower than those in the NSRB (total area: 1696.04 km2; average area: 0.83 km2). Several studies have shown that small glaciers tend to suffer higher decreases in area than the large ones (Ye et al., 2003; Li et al., 2019), which may lead to widely varying rates of glacier area shrinkage between these three adjacent watersheds. Regardless of these differences, the rate of glacier area change in all three river basins is relatively high, providing further evidence that glaciers in the southeast of the Tibetan Plateau are retreating rapidly (Yao et al., 2012; 2019). In general, the rate of glacier area change in the NSRB is similar to that in the inland river basins in northwest China but lower than that in the transboundary river basins in the southeastern Tibetan Plateau.
On a mountain-range scale, the rate of glacier area changes in the three mountain ranges comprising the study area (the Hengduan Mountains, Nyainqentanglha Mountains, and Tanggula Mountains) was compared with that in other typical mountainous regions in western China, as shown in Table 6. It was found that the rate of glacier area change in the three mountain ranges of the NSRB was significantly higher than that in the Tianshan and Qilian mountains (-0.4%/a) and the Himalayas, but lower than that in the Gangdise Mountains and the Nyainqentanglha Mountains, which are also located on the Tibetan Plateau. According to Table 6, other studies have found the rate of glacier area change in the three mountain ranges of the study area to be somewhat different than those obtained in the present study (these three mountain ranges were only a subset of the study area considered in the cited studies). For example, Ji et al. (2018) obtained a rate of change of -1.24%/a in the eastern section of the Nyainqentanglha Mountains, which far exceeds the value obtained in the present study (-0.51%/a). This might be because the study area in the present study only encompasses the northern slopes of the Nyainqentanglha Mountain range, and glacier retreat is generally slower on northern slopes than on southern slopes. In addition, the time interval of the study by Ji et al. (2018) is shorter and falls in a period of accelerated glacial retreat (after 2000). Duan et al. (2019) found that the rate of glacier area change in the Tanggula Mountains was 0.5%/a, which is close to the rate obtained in the present study (-0.47%/a). This may be attributed to the spatial consistency of the study areas in both studies. Wang et al. (2017) studied glacier changes in the entire Hengduan Mountain Range from 1990 to 2014 and reported a rate of glacier retreat of -0.40 ± 0.26%/a. In contrast, the present study found that the rate of glacier change in the Hengduan Mountains was significantly higher (-0.89%/a). Similar to the Nyainqentanglha Mountains, the large discrepancy may be attributed to differences in the study period and the location of the respective study areas. Moreover, their study primarily focused on the Boshula Mountains and Taniantaweng Mountains, which have the highest rate of glacier retreat in the entire Hengduan Mountain Range (Wang et al., 2017). Table 6 indicates that climate change has accelerated the rate of glacial retreat in this region (with precipitation showing a significant decreasing trend and temperature showing a significant increasing trend). Accordingly, the higher rate of glacier change in the present study may also be attributed to the longer study interval.

6 Conclusions

In this study, we analyzed the glacier area changes in the NSRB over the past 45 years using Landsat images and elucidated the reasons for the spatial heterogeneity in glacier area shrinkage based on the meteorological data collected. The results of our study were as follows.
(1) Over the past 45 years, the total glacier area in the NSRB decreased by 477.78 km², which accounts for 28.17% around 1975, while the annual average change rate was -0.62%/a. Compared with the period from around 1975 to the 2000s, the glacier shrinkage rate gradually slowed down after 2000. Most of the glacier area shrinkage was at mid- and low-altitudes, with the most severe shrinkage observed between 5290 m and 5540 m, accounting for 40% of the total shrinkage. It was found that more glacier shrinkage occurred in the northeast as compared to the southeast. However, the shrinkage ratio was higher in the southwest than in the northeast. Compared with other typical river basins in China, the relative rate of glacier area change in the NSRB was similar to that in the inland river basins in northwest China but relatively lower than that in other transboundary river basins originating in southeastern Tibetan Plateau.
(2) The glacier area changes showed obvious regional characteristics. Although the glacier area in all three mountain ranges has been shrinking, the glacier area in the Hengduan Mountains retreated the most, followed by that in the Nyainqentanglha Mountains, with the Tanggula Mountains showing relatively low shrinkage. Hot spots of glacier area change were found in the Hengduan Mountains, which are in the southeast part of the study area, and in the Nyainqentanglha Mountains, located in the central part. After 2000, the number of cold and hot spots increased, indicating the clear spatial heterogeneity of glacier changes.
(3) The rate of glacier area shrinkage in different periods presented a positive response with respect to the temperature changes in the corresponding time interval. The spatial heterogeneity of climate change effects elucidated the differences in the rate of glacier area changes in different regions of the NSRB. The rise in temperature was found to be the primary reason for the significant glacier area shrinkage in the NSRB over the past 45 years. Moreover, as the warming trend continues, we can expect that the glacier area in the NSRB will continue to shrink.
[1]
Alipour M, Kibler K M, Alizadeh B, 2022. Flow alteration by diversion hydropower in tributaries to the Salween River: A comparative analysis of two streamflow prediction methodologies. International Journal of River Basin Management, 20(1): 33-43.

DOI

[2]
Bolch T, 2007. Climate change and glacier retreat in northern Tien Shan (Kazakhstan/Kyrgyzstan) using remote sensing data. Global and Planetary Change, 56(1/2): 1-12.

DOI

[3]
Bolch T, Kulkarni A, Kääb A, et al., 2012. The state and fate of Himalayan glaciers. Science, 336(6079): 310-314.

DOI PMID

[4]
Church J A, White N J, Konikow L F, et al., 2011. Revisiting the Earth’s sea-level and energy budgets from 1961 to 2008. Geophysical Research Letters, 38(18): L18601.

[5]
Duan H Y, Yao X J, Liu S Y, et al., 2019. Glacier change in the Tanggula Mountains, Tibetan Plateau, in 1969-2015. Journal of Mountain Science, 16(11): 2663-2678.

DOI

[6]
Fan H, He D M, 2015. Temperature and precipitation variability and its effects on streamflow in the upstream regions of the Lancang-Mekong and Nu-Salween rivers. Journal of Hydrometeorology, 16(5): 2248-2263.

DOI

[7]
Farinotti D, Longuevergne L, Moholdt G, et al., 2015. Substantial glacier mass loss in the Tien Shan over the past 50 years. Nature Geoscience, 8(9): 716-722.

DOI

[8]
Feng Y, He D M, Li Y G, 2010. Ecological changes and the drivers in the Nu River basin (upper Salween). Water International, 35(6): 786-799.

DOI

[9]
Garg P K, Shukla A, Jasrotia A S. 2017. Influence of topography on glacier changes in the Central Himalaya, India. Global and Planetary Change, 155: 196-212.

DOI

[10]
Gao Y, Chen F, Lettenmaier D P, et al., 2018. Does elevation-dependent warming hold true above 5000 m elevation? Lessons from the Tibetan Plateau. npj Climate and Atmospheric Science, 1: 19. https://doi.org/10.1038/s41612-018-0030-z.

DOI

[11]
Getis A, Ord J K, 1992. The analysis of spatial association by use of distance statistics. Geographical Analysis, 24: 189-206.

DOI

[12]
Grinsted A, 2013. An estimate of global glacier volume. The Cryosphere, 7(1): 141-151.

DOI

[13]
Guo W Q, Liu S Y, Xu J L, et al., 2015. The second Chinese glacier inventory: Data, methods and results. Journal of Glaciology, 61(226): 357-372.

DOI

[14]
Huai B J, Li Z Q, Wang S J, et al., 2014. RS analysis of glaciers change in the Heihe River Basin, Northwest China, during the recent decades. Journal of Geographical Sciences, 24(6): 993-1008.

DOI

[15]
Huss M, Hock R, 2018. Global-scale hydrological response to future glacier mass loss. Nature Climate Change, 8(2): 135-140.

DOI

[16]
Immerzeel W W, Van Beek L P, Bierkens M F, 2010. Climate change will affect the Asian water towers. Science, 328(5984): 1382-1385.

DOI PMID

[17]
IPCC, 2019. IPCC Special Report on the Ocean and Cryosphere in a Changing Climate. (in press)

[18]
Ji Q, Dong J, Li H R, et al., 2020. Glacier variations in the Himalaya from 1990 to 2015 based on remote sensing. The Cryosphere Discussions, [preprint]. https://doi.org/10.5194/tc-2019-297.

[19]
Ji Q, Yang T B, Dong J, et al., 2018. Glacier variations in response to climate change in the eastern Nyainqêntanglha Range, Tibetan Plateau from 1999 to 2015. Arctic, Antarctic, and Alpine Research, 50(1): e1435844.

[20]
Kääb A, Berthier E, Nuth C, et al., 2012. Contrasting patterns of early twenty-first-century glacier mass change in the Himalayas. Nature, 488(7412): 495-498.

DOI

[21]
Kendall S B, 1975. Enhancement of conditioned reinforcement by uncertainty. Journal of the Experimental Analysis of Behavior, 24(3): 311-314.

PMID

[22]
Lan C, Zhang Y X, Zhu F X, et al., 2014. Characteristics and changes of streamflow on the Tibetan Plateau: A review. Journal of Hydrology: Regional Studies, 2: 49-68.

DOI

[23]
Li B F, Chen Y N, Shi X, 2020. Does elevation dependent warming exist in high mountain Asia? Environmental Research Letters, 15: 024012. https://doi.org/10.1088/1748-9326/ab6d7f.

DOI

[24]
Li Y J, Ding Y J, Shangguan D H, et al., 2019. Regional differences in global glacier retreat from 1980 to 2015. Advances in Climate Change Research, 10(4): 203-213.

DOI

[25]
Liu J, Yao X J, Liu S Y, et al., 2020. Glacial changes in the Gangdisê Mountains from 1970 to 2016. Journal of Geographical Sciences, 30(1): 131-144.

DOI

[26]
Liu Q, Liu S Y, Guo W Q, et al., 2015. Glacier changes in the Lancang River Basin, China, between 1968-1975 and 2005-2010. Arctic, Antarctic, and Alpine Research, 47(2): 335-344.

DOI

[27]
Liu S Y, Ding Y J, Zhang Y, et al., 2006. Impact of the glacial change on water resources in the Tarim River Basin. Acta Geographica Sinica, 61(5): 482-490. (in Chinese)

[28]
Liu S Y, Guo W Q, Xu J L, 2019. The Second Chinese Glacier Inventory (V 1.0). National glacial and frozen desert scientific data center (http://www.ncdc.ac.cn/). doi: 10.12072/ncdc.Westdc.db0006.2020.

DOI

[29]
Luo W, Zhang G Q, Chen W F, et al., 2020a. Response of glacial lakes to glacier and climate changes in the western Nyainqentanglha range. Science of The Total Environment, 735: 139607.

DOI

[30]
Luo X, Fan X M, Ji X, et al., 2020b. Hydrological impacts of interannual variations in surface soil freezing processes in the upper Nu-Salween River basin. Arctic, Antarctic, and Alpine Research, 52(1): 1-12.

DOI

[31]
Mann H B, 1945. Nonparametric tests against trend. Econometrica, 13(3): 245-259.

DOI

[32]
Nie Y, Pritchard H D, Liu Q, et al., 2021. Glacial change and hydrological implications in the Himalaya and Karakoram. Nature Reviews Earth & Environment, 2(2): 91-106.

[33]
Nie Y, Zhang Y L, Liu L S, et al., 2010. Glacial change in the vicinity of Mt. Qomolangma (Everest), central high Himalayas since 1976. Journal of Geographical Sciences, 20(5): 667-686.

DOI

[34]
Oerlemans J, 2005. Extracting a climate signal from 169 glacier records. Science, 308(5722): 675-677.

PMID

[35]
Paul F, Bolch T, Kääb A, et al., 2015. The glaciers climate change initiative: Methods for creating glacier area, elevation change and velocity products. Remote Sensing of Environment, 162: 408-426.

DOI

[36]
Pepin N, Bradley R S, Diaz H F, et al., 2015. Elevation-dependent warming in mountain regions of the world. Nature Climate Change, 5(5): 424-430.

DOI

[37]
Rankl M, Kienholz C, Braun M, 2014. Glacier changes in the Karakoram region mapped by multimission satellite imagery. The Cryosphere, 8(3): 977-989.

DOI

[38]
Ren Y Y, Ren G Y, Sun X B, et al., 2017. Observed changes in surface air temperature and precipitation in the Hindu Kush Himalayan region over the last 100-plus years. Advances in Climate Change Research, 8(3): 148-156.

DOI

[39]
Sahu R, Gupta R, 2020. Glacier mapping and change analysis in Chandra basin, Western Himalaya, India during 1971-2016. International Journal of Remote Sensing, 41(18): 6914-6945.

DOI

[40]
Sen P K, 1968. Estimates of the regression coefficient based on Kendall’s tau. Journal of the American Statistical Association, 63(324): 1379-1389.

DOI

[41]
Sun M P, Liu S Y, Yao X J, et al., 2018. Glacier changes in the Qilian Mountains in the past half-century: Based on the revised First and Second Chinese Glacier Inventory. Journal of Geographical Sciences, 28(2): 206-220.

DOI

[42]
Taft L, Kühle L, 2018. Glacier changes between 1976 and 2015 in the source area of the Ayeyarwady (Irrawaddy) River, Myanmar. Water, 10(12): 1850.

DOI

[43]
Wang W C, Xiang Y, Gao Y, et al., 2015. Rapid expansion of glacial lakes caused by climate and glacier retreat in the Central Himalayas. Hydrological Processes, 29(6): 859-874.

DOI

[44]
Wang X, Chai K G, Liu S Y, et al., 2017. Changes of glaciers and glacial lakes implying corridor-barrier effects and climate change in the Hengduan Shan, southeastern Tibetan Plateau. Journal of Glaciology, 63(239): 535-542.

DOI

[45]
Wu K P, Liu S Y, Jiang Z L, et al., 2018. Recent glacier mass balance and area changes in the Kangri Karpo Mountains from DEMs and glacier inventories. The Cryosphere, 12(1): 103-121.

DOI

[46]
Xiao X M, Shen Z X, Qin X G, 2001. Assessing the potential of VEGETATION sensor data for mapping snow and ice cover: A Normalized Difference Snow and Ice Index. International Journal of Remote Sensing, 22(13): 2479-2487.

DOI

[47]
Xing W C, Li Z Q, Zhang H, et al., 2017. Spatial-temporal variation of glacier resources in Chinese Tianshan Mountains since 1959. Acta Geographica Sinica, 72(9): 1594-1605. (in Chinese)

[48]
Xu A W, Yang T B, Wang C Q, et al., 2016. Variation of glaciers in the Shaksgam River Basin, Karakoram Mountains during 1978-2015. Progress in Geography, 35(7): 878-888. (in Chinese)

[49]
Yan L, Liu X, 2014. Has climatic warming over the Tibetan Plateau paused or continued in recent years. Journal of Earth, Ocean and Atmospheric Sciences, 1(1): 13-28.

[50]
Yang Y H, Weng B S, Yan D H, et al., 2021. Partitioning the contributions of cryospheric change to the increase of streamflow on the Nu River. Journal of Hydrology, 598: 126330.

DOI

[51]
Yao T D, Pu J C, Lu A X, et al., 2007. Recent glacial retreat and its impact on hydrological processes on the Tibetan Plateau, China, and surrounding regions. Arctic, Antarctic, and Alpine Research, 39(4): 642-650.

DOI

[52]
Yao T D, Thompson L N, Yang W, et al., 2012. Different glacier status with atmospheric circulations in Tibetan Plateau and surroundings. Nature Climate Change, 2(9): 663-667.

DOI

[53]
Yao T D, Yu W S, Wu G J, et al., 2019. Glacier anomalies and relevant disaster risks on the Tibetan Plateau and surroundings. Chinese Science Bulletin, 64(27): 2770-2782.

[54]
Ye B S, Ding Y J, Liu F J, et al., 2003. Responses of various-sized alpine glaciers and runoff to climatic change. Journal of Glaciology, 49(164): 1-7.

DOI

[55]
Ye Q H, Zong J B, Tian L D, et al., 2017. Glacier changes on the Tibetan Plateau derived from Landsat imagery: Mid-1970s-2000-13. Journal of Glaciology, 63(238): 273-287.

DOI

[56]
Zhang Q F, Chen Y N, Li Z, et al., 2019. Glacier changes from 1975 to 2016 in the Aksu River Basin, Central Tianshan Mountains. Journal of Geographical Sciences, 29(6): 984-1000.

DOI

[57]
Zhang X W, Li H J, Zhang Z H, et al., 2018. Recent glacier mass balance and area changes from dems and landsat images in upper reach of Shule River Basin, northeastern edge of Tibetan Plateau during 2000 to 2015. Water, 10(6): 796.

DOI

[58]
Zhang Y G, Hao Z C, Xu C Y, et al., 2020. Response of melt water and rainfall runoff to climate change and their roles in controlling streamflow changes of the two upstream basins over the Tibetan Plateau. Hydrology Research, 51(2): 272-289.

DOI

[59]
Zhou Z H, Han N, Liu J J, et al., 2020. Glacier variations and their response to climate change in an arid inland river basin of Northwest China. Journal of Arid Land, 12: 357-373.

DOI

Outlines

/