Research article

Water sources for typical desert vegetation in the Ebinur Lake basin

  • HAO Shuai , 1, 2 ,
  • LI Fadong , 3, 4, *
Expand
  • 1.College of Geographic Science and Tourism, Xinjiang Normal University, Urumqi 830054, China
  • 2.Key Laboratory of Xinjiang Uygur Autonomous Region, Xinjiang Laboratory of Lake Environment and Resources in Arid Area, Urumqi 830054, China
  • 3.Key Laboratory of Ecosystem Network Observation and Modeling, Institute of Geographic Sciences and Natural Resources Research, CAS, Beijing 100101, China
  • 4.College of Resource and Environment, University of Chinese Academy of Sciences, Beijing 100190, China
* Li Fadong, Professor, specialized in ecohydrological environment. E-mail:

Hao Shuai (1982-), specialized in ecohydrological process in arid zone. E-mail:

Received date: 2022-01-23

  Accepted date: 2022-03-03

  Online published: 2022-08-25

Supported by

Natural Science Foundation of Xinjiang Uygur Autonomous Region(2021D01A118)

National Natural Science Foundation of China(U1803244)

Open Project of Xinjiang Laboratory of Lake Environment and Resources in Arid Area(XJNUSYS2019B18)

Abstract

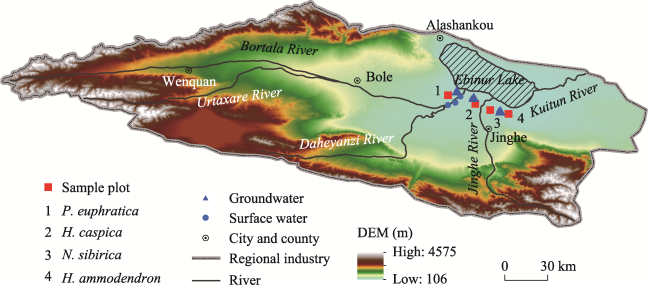
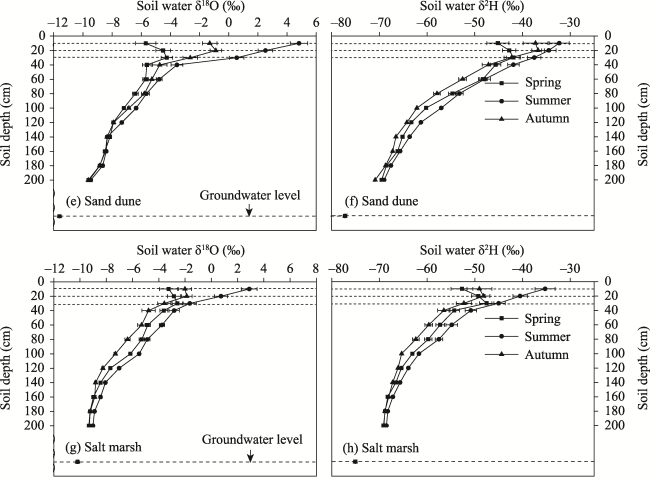
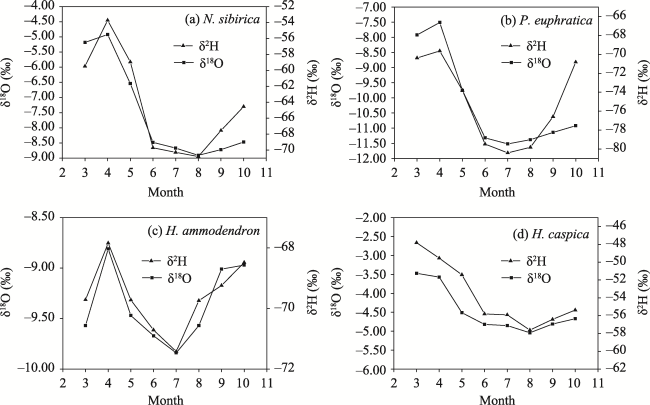
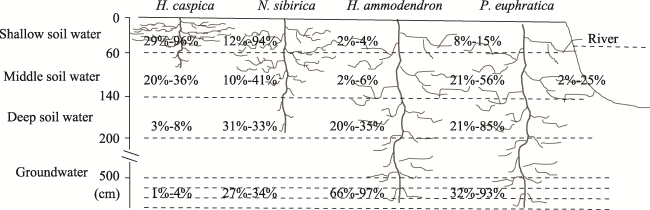
In arid and semi-arid environments, desert vegetation plays an important role in preventing soil erosion by wind and helps maintain the stability of desert and oasis ecosystems. Four types of typical desert vegetation, namely Populus euphratica, Haloxylon ammodendron, Nitraria sibirica, and Halostachs caspica, corresponding to different habitats (i.e., river bank, sand dune, desert, and salt marsh) were chosen as the model vegetation in this research. The δ2H and δ18O for rainwater, soil water, and plant water were applied to identify the water sources and quantify the proportions of different water sources used over the entire plant growth period (from March to October). The results showed that the precipitation δ2H and δ18O in the Ebinur Lake basin varied from -142.5‰ to -0.6‰ and from -20.16‰ to 1.20‰, respectively. The largest δ2H and δ18O values occurred in summer and the smallest in winter. The soil water δ2H and δ18O of the four habitats decreased gradually with increasing depth. The δ2H and δ18O values of water extracted from the stems of the four plants had similar variation trends, that is, the maximum was observed in spring and the minimum in summer. Among the four plants, H. caspica had the highest stable isotopic values in the stem water, followed by N. sibirica, H. ammodendron, and P. euphratica. The water sources and utilization ratios of desert vegetation varied across different growth stages. Throughout the growing period, H. ammodendron mainly used groundwater, whereas the water source proportions used by N. sibirica varied greatly throughout the growing season. In spring, plants mainly relied on surface soil water, with a contribution rate of 80%-94%. However, in summer, the proportion of deep soil water used was 31%-36%; and in autumn, the proportion of middle soil water used was 33%-36%. H. caspica mainly relied on topsoil water in spring and autumn, and the proportion of soil water in the middle layer slightly increased to 20%-36% in summer. P. euphratica mainly used intermediate soil water in spring with a utilization rate of 53%-54%. In summer, groundwater was the main source, with a utilization rate of 72%-88%, and only 2%-5% came from river water, whereas in autumn, the river water utilization rate rose to 11%-21%. The results indicated that there were significant differences in water use sources during the growing period for desert vegetation in arid areas. This research provides a theoretical basis for understanding water use mechanisms, water adaptation strategies, and vegetation restoration and management in arid areas.

Cite this article

HAO Shuai , LI Fadong . Water sources for typical desert vegetation in the Ebinur Lake basin[J]. Journal of Geographical Sciences, 2022 , 32(6) : 1103 -1118 . DOI: 10.1007/s11442-022-1987-4

1 Introduction

In arid and semi-arid areas, rainfall is scarce and water is the most important factor limiting vegetation distribution and growth (Chen et al., 2017). In naturally arid areas, the available water sources for desert vegetation include precipitation, river water, soil water, and groundwater. During the long-term evolution of halophytes in arid areas, different water sources have been selected by the plants to improve their ability to cope with arid environments (Barbeta et al., 2015). The utilization of vegetation water sources can be determined by many methods, such as the root control excavation method (Brooke et al., 2014), the liquid flow measurement method (Eggemeyer et al., 2008), and the radioactive trace method (Schwendenmann et al., 2015). The shortcomings of these methods are high cost, an inability to distinguish between different water sources in detail, and the radioactive risk. Stable isotope technology can safely, effectively, and non-destructively determine and distinguish vegetation water use. In plants, the root system absorbs water and transports it along the xylem. The water process exists in the form of liquid flow. There is no water exchange with the external environment or isotope fractionation before reaching the non-tethered young branches and leaves (Chen et al., 2007; Liu et al., 2016; Wang et al., 2016). Analysis of the isotopic values of xylem water and potential water sources can determine the water use mode of plants and quantify the proportion of different water sources in plants.
The stable isotope method is widely used to study vegetation water use in terrestrial ecosystems, such as forest (Xing et al., 2014; Ellsworth et al., 2017), farmland (Huo et al., 2008; Kathleen et al., 2018; Zhao et al., 2018), and grassland ecosystems (Chen et al., 2016; Zhou et al., 2017). However, there has been little research on vegetation ecosystems in arid areas and the water absorption strategies used by saline vegetation in different habitats are not clear, which is a shortcoming of vegetation ecosystem research in arid areas. Ebinur Lake is the largest salt water lake in the Xinjiang Uygur Autonomous Region. It is located at a low injection point in the southwest part of the Junggar Basin. It has the typical ecological environmental characteristics of arid areas and is the water and salt collection center of the basin. It maintains the stability of the whole basin ecosystem and is an ecological barrier for Xinjiang and the entire northwest region (Chen et al., 2006). Under the influence of climate change and human activities, vegetation degradation, over-exploitation and utilization of water, and aggravation of soil salinization have occurred in the Ebinur Lake basin. Considering vegetation and water bodies as a system, this study investigated the interaction between desert vegetation and potential water sources, and determined the water use strategies employed during different growth periods to provide theoretical support for the restoration of local vegetation ecosystems.
In this study, the typical desert vegetation: Populus euphratica, Haloxylon ammodendron, Nitraria sibirica, and Halostachys caspica, corresponding to four habitats (river bank, sand dune, desert, and salt marsh) in the Ebinur Lake basin were selected as the research objects, and the hydrogen and oxygen stable isotope method was used to study the water source and water use strategy over the entire growth period (March to October). The purpose of this study was to 1) clarify the stable isotopic composition of precipitation, soil water, and vegetation stem water in the study area; 2) quantify the proportion of water source utilization during the growth period of typical desert vegetation; and 3) explore the mechanism that influences desert vegetation effects on water source utilization. This study provides a scientific basis for vegetation ecosystem protection and restoration in arid areas.

2 Study area and data

2.1 Study area

The Ebinur Lake basin (44°02'N-45°23'N, 79°53'E-83°53'E) has a typical temperate, arid, continental climate with an annual average temperature of 8.0℃, annual precipitation of 89.9-169.7 mm, and annual evaporation of 1569-3421 mm. Ebinur Lake is the center of regional water and salt collection because it is the lowest depression in the western Junggar Basin. The lake water mainly comes from surface rivers and groundwater recharge. At present, the rivers that recharge to the lake in the form of surface runoff are mainly the Jinghe and Bortala rivers. Groundwater in the basin mainly comes from snowmelt and river recharge, and the groundwater depth around the Ebinur Lake wetland is approximately 5 m (Xu, 2017). The basin has diverse landscapes and integrates wetland and desertification processes.
The flora in the basin is affected by the flora of central Asia and Mongolia, and shows obvious transition characteristics. The plant species are mainly Salix, Chenopodiaceae, Tamarixaceae, Gramineae, and other plants. The main vegetation types are Populus euphratica, Haloxylon ammodendron, Tamarix ramosissima, Halostachys caspica, Nitraria sibirica Pall, Kalidium foliatum, Halocnemum strobilaceum, Suaeda pterantha, and Glycyrrhiza uralensis (Qian et al., 2013).

2.2 Experimental design and field sampling

A 20 m × 20 m sample plot was set up in each of the different habitats in the Ebinur Lake basin and the plants investigated were H. caspica (salt marsh), P. euphratica (river bank), N. sibirica (desert), and H. ammodendron (sand dune). Three plants with heights and crown widths that reflected the average status of the sample plot were selected as sampling objects in the sample plot. The plant embolus branches were sampled along with the soil, river water, and groundwater. The morphological characteristics of the desert vegetation in the sample plots are shown in Table 1.
Table 1 Morphological characteristics of four desert plants in the Ebinur Lake basin
Vegetation Height
(cm)
Crown
(cm NS×EW)
Plant type Foot type Plant community Community cover (%) Habitat Sample site
H. caspica 52.3±12.3 (21.3±9.2)×
(12.1±4.6)
Small shrub Shallow root H. caspica-
K. foliatum
15 Salt marsh Beidi station
P. euphratica 312.2±24.3 (214.2±45.6)×
(245.4±56.4)
Tree Middle-deep root P. euphratica-
P. australis
50 River bank Bohe station
H. ammodendron 125.3±14.4 (56.4±10.3)×
(64.5±23.5)
Small tree Middle-deep root H. ammodendron 10 Sand dune Tuoniao station
N. sibirica 23.2±9.4 (104.6±18.3)×
(96.3±10.5)
Small shrub Shallow root T. ramosissima-
N. sibirica
30 Desert Tuoniao station
The sample collection time covered the entire growth period (March to October). River water collection mainly occurred in riparian habitats, particularly the Bortala River. Groundwater was collected from three wells near the sample sites, and three wells were drinking water wells. The numbers of the well water samples from left to right are 1 #, 2 #, and 3 # (Figure 1). Fresh water was collected to avoid stagnant water in the water pipe. The soil was collected near the selected plant using a soil drill. The total collection depth was 200 cm. A 0-40 cm soil profile was collected every 10 cm and a 40-200 cm profile was collected every 20 cm. Three soil profiles were drilled around each plant. The plant collection technique minimized the influence of light intensity and other external conditions on the isotope composition analysis results. Plant samples were collected between 9:00-11:00 am as far as possible. The embolus branches were selected and 3-5 cm segments were taken in four directions to remove the skin. The samples were packed into glass bottles with spiral caps, sealed with Parafilm, and stored in cold storage.
Figure 1 Schematic diagram of sample setting and sampling points in the Ebinur Lake basin

2.3 Water extraction, and hydrogen and oxygen isotope composition testing of the samples

Water extraction by the samples and the hydrogen and oxygen isotope composition tests were completed at the Xinjiang Laboratory of Lake Environment and Resources in Arid Area, Xinjiang Normal University. The water samples were filtered through a 0.45 μm cellulose acetate filter membrane. The water types, including river water in the plant and soil samples, were extracted using an automatic vacuum condensation extraction system (LI-2100, LICA United Technology Limited, Beijing, China). Isotope fractionation did not occur during sample water extraction and the water extraction rate was above 98%. Hydrogen and oxygen stable isotope compositions (δ2H and δ18O) were analyzed using a liquid water stable isotope analyzer (Model DLT-100, Los Gatos Research, Mountain View, CA, USA). Each sample was analyzed six times. To reduce the memory effect, the first two analysis results were abandoned and the final result was the average of the last four analysis results. Plant water obtained by low-temperature vacuum extraction technology may be doped with methanol and ethanol based organic substances. The absorption peaks of ethanol based organic substances are very close to those of water, resulting in isotope composition errors when determined by the spectral method. To improve the measurement accuracy of the δ2H and δ18O values in plant water, the isotope composition of plant water was corrected by the organic correction curve fitted by (Schultz et al., 2011), to minimize the influence of organic matter on the measurement results. The measured hydrogen and oxygen stable isotope composition is the thousandth deviation of Vienna standard average oceanic water (V-SMOW), which can be expressed by the following formula:
$\delta(\% 0)=\frac{R_{\text {sample }}-R_{\text {standard }}}{R_{\text {standard }}} \times 1000$
where Rsample and Rstandard are the O or H isotope ratios (18O/16O or 2H/1H) of the collected water samples and the standard samples, respectively, and the measurement accuracies of δ2H and δ18O were 0.5 ‰ and 0.15 ‰, respectively.

2.4 Data processing and statistical analysis

In this study, IsoSource1.3.1 software was used to calculate the utilization ratio of plants to various water sources. The IsoSource program used the linear mixed model to calculate all possible solutions when the increment was set to 1% and the mass balance tolerance was set to 0.1. The specific calculation process can be found in Phillips and Gregg (2003).
One-way analysis of variance was used to analyze and compare the differences in soil water content and hydrogen and oxygen isotope values among the different soil layers (P < 0.05) and an independent-sample t-test was used to test the differences in stem water isotope values between different vegetation types (P < 0.05). The statistical analysis was implemented using SPSS 17.0 (SPSS Inc., Chicago, Ill., USA) and the figures were produced by Origin 8.0 (OriginLab Corp., Northampton, MA, USA).

2.5 Division of potential water sources used by vegetation

In this study, the potential water sources for vegetation were divided into five categories: 1) the isotope values for shallow soil water (0-60 cm) show obvious seasonal and inter-layer changes, mainly because the soil in this layer is susceptible to climatic factors, such as precipitation, temperature, and evaporation; 2) the isotope values of intermediate level soil water (60-140 cm) still show large seasonal and inter-layer changes, but the trend is less obvious compared to the surface layer; 3) deep soil water (140-200 cm) has relatively consistent isotope values with small seasonal and inter-layer variations; 4) the seasonal variation in groundwater isotope values is small or almost unchanged; and 5) river water isotope values have seasonal variation characteristics (Dai et al., 2015; Bahejiayinaer et al., 2018; Ines et al., 2020). The formula for the isotope values associated with soil stratification combined with a weighted treatment is as follows:
$\delta_{w t}=\frac{\sum_{i=1}^{n}\left(s w c_{x} \times \delta_{x}\right)}{\sum_{i=1}^{n} s w c_{x}}$
where δwt is the soil water δ2H and δ18O values of the weighted treatment after soil layer combination, and swcx and δx are the soil water content and soil water δ2H and δ18O values at soil depth X, respectively.

3 Results

3.1 Variation characteristics of precipitation stable isotope composition

Based on the precipitation δ2H and δ18O at the event scale in the Ebinur Lake basin, the atmospheric water line in the region was obtained by statistical analysis as δ2H = 6.93 (±0.18) δ18O - 5.43 (±1.37) (R2 = 0.99, n = 87). The slope of the atmospheric water line in the study area was smaller than that of the global atmospheric water line (δ2H = 8δ18O + 10, GMWL). This is mainly due to the following reasons. First, the study area is located in an inland arid area with low precipitation and air humidity. Precipitation undergoes strong evaporation fractionation during the precipitation process. Second, the study area is far from the ocean and a considerable amount of precipitation water vapor comes from the local water cycle (Pang, 2014). Local water evaporation leads to the unbalanced fractionation of precipitation and the enrichment of heavy isotopes, which reduces the slope of the atmospheric water line.
The δ2H and δ18O values for precipitation in the Ebinur Lake basin showed significant seasonal variations (Table 2). The δ2H and δ18O values were highest in summer, lowest in winter, and intermediate in spring and autumn; that is, the stable isotope composition of hydrogen and oxygen in precipitation was depleted in winter and enriched in summer. The water vapor in the arid areas of Xinjiang is mainly derived from two sources: the westerly circulation and the local recycling process, and the share of recycled water vapor is approximately 8% on average throughout the year (Pang, 2014). In the study area, the summer temperature was high, the humidity was low, evaporation under clouds was strong, and the temperature effect on the precipitation isotopes was obvious, which led to a high isotope value. In winter, water vapor mostly comes from the westerly circulation, which has a low isotope composition. Furthermore, the temperature is low, resulting in low isotope values for local precipitation (Liu et al., 2008). Therefore, the seasonal variation associated with the precipitation hydrogen and oxygen isotope composition reflects the difference in water vapor sources and is restricted by meteorological conditions in the study area.
Table 2 Seasonal variation of precipitation δ2H and δ18O in the Ebinur Lake basin
δ(‰) Spring Summer Autumn Winter
δ2H Average -96.6 -45.5 -103.0 -129.7
Range -98.4 to -78.4 -63.1 to -34.5 -132.7 to -62.8 -148.2 to -98.3
δ18O Average -12.33 -2.50 -11.31 -18.63
Range -12.89 to -9.32 -5.94 to 1.20 -17.74 to -5.64 -20.16 to -14.38

3.2 Variation characteristics of the stable isotope composition of soil water and groundwater

In the growing season, the soil water content in different habitats was low. In addition, the profile change gradually increased with the increase in soil depth from 2.9 ± 1.2% in the 0-60 cm layer to 18.4 ± 2.3% in the 140-200 cm layer (Table 3). The δ2H values for the soil water profile showed that the dune had the highest values, the river bank had the lowest, and the salt marsh land and desert were intermediate. The δ18O values in salt marsh land were highest in the 0-60 cm and 60-140 cm layers, while the 140-200 cm level values were highest in the dune and lowest in the river bank sites. It can also be seen from Table 3 that the soil water isotope composition of the three layers in the different habitats showed enrichment in the 0-60 cm layer and depletion in the 140-200 cm layer. Soil texture, soil structure, vegetation type, and community coverage in the different habitats varied, resulting in differences in soil water content and soil water δ2H and δ18O values. The response of the soil water stable isotope content to humidity changes in the dune habitat was the largest, mainly due to the high sand content (more than 80%), loose texture, large pores, difficulty in maintaining soil moisture (2.9%-8.9%, Table 3), and strong evaporation at the soil surface. These characteristics led to increases in the isotope composition of soil water. The riparian habitat is close to the river, the soil moisture is relatively large (5.2%-18.4%, Table 3), shrubs and herbaceous plants are common, and the vegetation coverage is better (50%, Table 1). These characteristics allow a microclimate to form that is less affected by humidity change, resulting in a weak response by soil water stable isotope composition to humidity. The structure of salt marsh land and desert is relatively compact, the pores are small, and the soil moisture content is low (3.2%-11.3%, Table 3). The stable isotope composition of soil water responds well to humidity. In summary, different habitats exhibit different ecological environmental characteristics. It is the combined effect of these different ecological factors that leads to the different characteristics shown by the soil water stable isotope composition.
Table 3 Average values of soil water content and soil moisture δ2H and δ18O in different habitats of the Ebinur Lake basin
Habitat 0-60 cm 60-140 cm 140-200 cm
Water
content (%)
δ2H
(‰)
δ18O
(‰)
Water
content (%)
δ2H
(‰)
δ18O
(‰)
Water content (%) δ2H
(‰)
δ18O
(‰)
Sand dune 2.9±1.2 -41.5±15.2 -2.48±1.45 5.2±1.0 -60.5±8.1 -7.19±0.93 8.9±1.1 -66.3±5.2 -8.50±0.49
Desert 3.2±1.3 -51.4±13.7 -3.40±1.25 7.5±1.2 -67.5±7.3 -7.88±1.08 11.2±1.6 -73.8±4.7 -10.21±0.84
River bank 5.2±1.5 -55.6±11.4 -4.31±1.95 10.2±1.6 -73.1±6.7 -8.82±0.83 18.4±2.3 -79.3±5.7 -11.20±0.43
Salt marsh 3.5±1.4 -48.7±17.1 -2.37±1.86 7.9±2.3 -63.5±8.2 -6.90±1.21 11.3±3.4 -68.4±3.8 -9.02±0.35

Note: The data indicate mean value ± standard deviation.

The change in the stable isotope composition of soil water is affected by many factors, such as atmospheric precipitation, surface evaporation, horizontal migration, and the vertical movement of water through the soil. In the vegetation growing season, the overall variation in the soil water stable isotope composition profile showed that the isotope value decreased with increasing depth. In the deep layer, the variation in soil water isotope composition was smallest and tended to be stable below 160 cm (Figure 2), which is consistent with Sprenger et al. (2016). This is because deep soil water contains isotopic information about precipitation and the soil profile water under long-term mixing and accumulation. Furthermore, deep soil is less affected by meteorological factors and the evaporation effect is weak, resulting in the profile variation characteristics shown by the soil water isotope composition. However, the variation trend for the soil surface in spring and autumn did not fully conform to this rule. The δ2H and δ18O values in the different habitats during spring reached a maximum at 20-30 cm depth, indicating that snow has a direct impact on the stable isotope composition of soil water above 20 cm. The stable isotope values of soil water in the different habitats increased from 10 cm to 20 cm in autumn, which was different from the decreasing trend in summer. The main reason for this is that the temperature decreases in autumn, but rainfall is basically the same as that in summer. The rainfall is low intensity precipitation and infiltration into the soil is shallow, resulting in the isotope value of the 10 cm soil water being lower than the isotope value for 20 cm soil, which was the highest due to the lack of rainfall supplementation and evaporation.
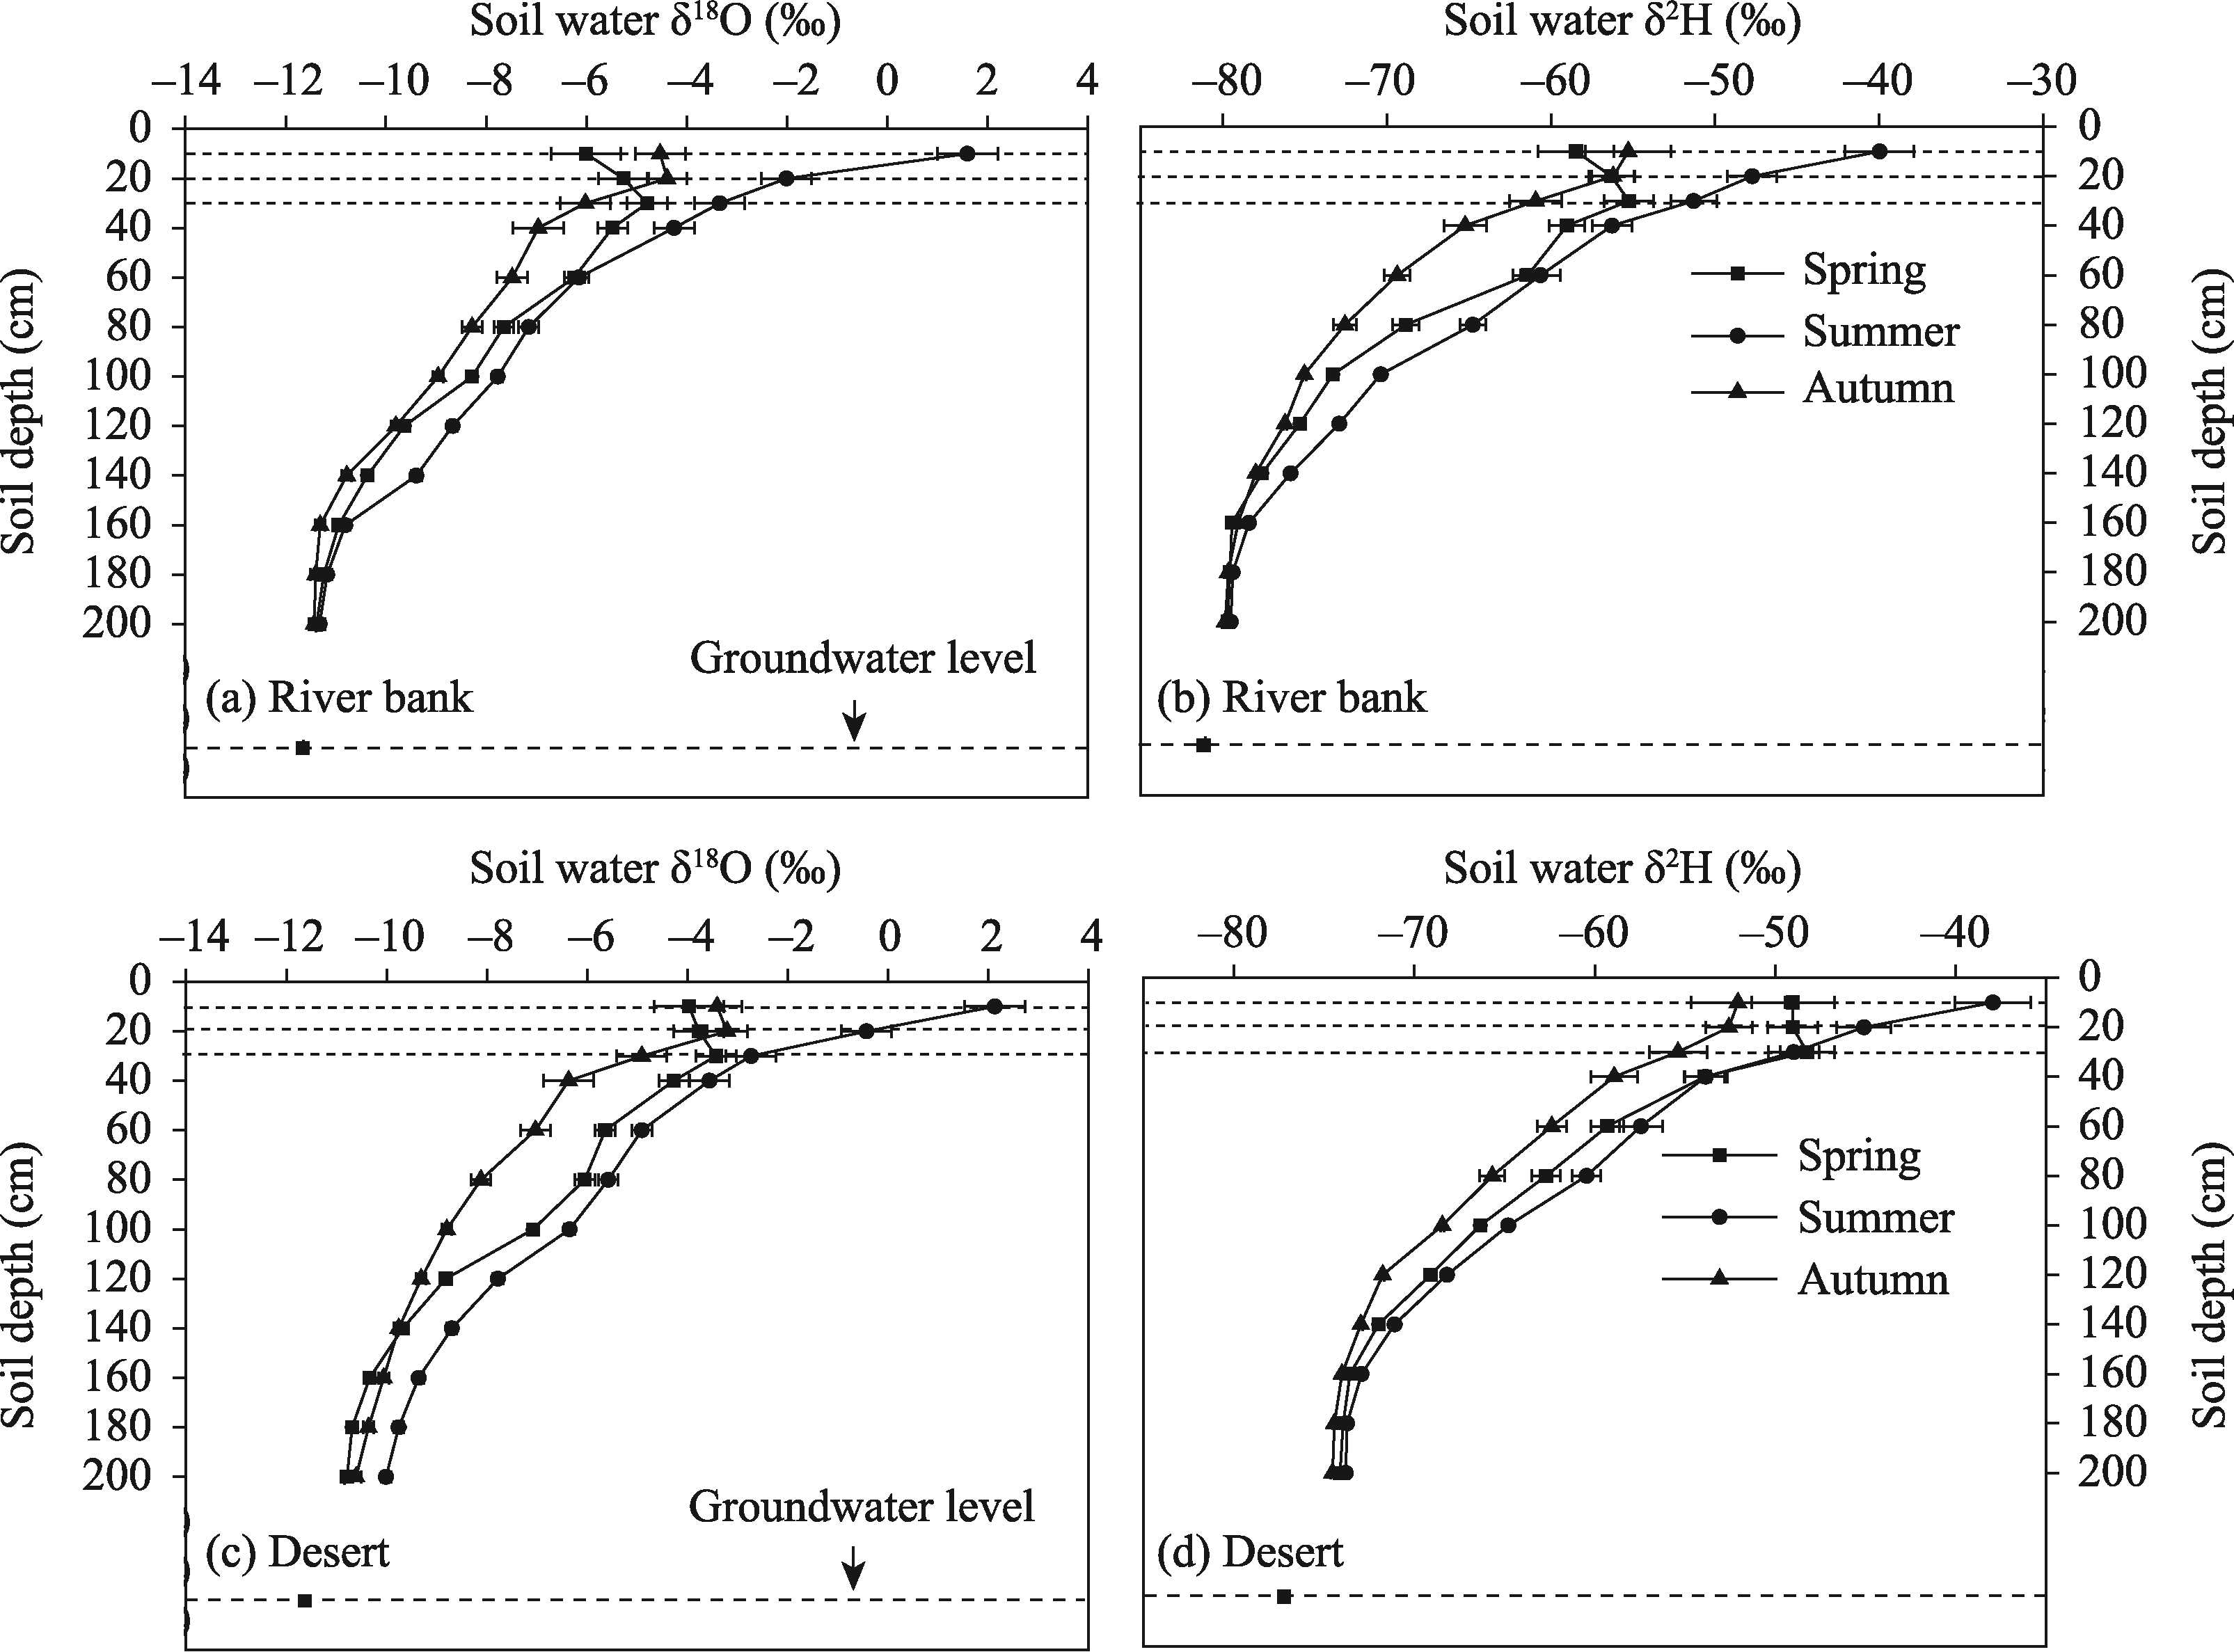
Figure 2 Variations in soil moisture δ2H and δ18O at different depths in different habitats of Ebinur Lake basin
The isotope values for groundwater in the Ebinur Lake basin showed a certain seasonal difference, but the difference was not significant (Table 4). The hydrogen and oxygen isotope values were the highest in spring, followed by autumn and summer. It can be seen that the seasonal variation in groundwater isotope values is different from that of soil water. According to the analysis, the isotopic composition of soil water is mainly affected by meteorological factors, whereas the underground aquifer is distributed below the surface and the well depth is approximately 80 m. The well is less affected by changes in external meteorological factors and is mainly affected by the recharge sources and water-rock interactions. In summer, rainfall in the mountains and melting ice and snow recharge the groundwater aquifer, resulting in a lower isotopic value for groundwater.
Table 4 Seasonal variation of δ2H and δ18O values in observation well water of the Ebinur Lake basin
Well number Spring Summer Autumn Well depth (m)
δ2H (‰) δ18O (‰) δ2H (‰) δ18O (‰) δ2H (‰) δ18O (‰)
1# -80.1±2.4 -12.03±0.92 -80.5±1.8 -12.32±0.74 -80.3±3.1 -12.25±1.26 75
2# -74.6±2.5 -10.44±0.63 -75.0±2.6 -10.71±1.12 -74.8±2.4 -10.63±0.83 80
3# -76.8±2.6 -11.35±1.21 -77.2±1.6 -11.63±0.45 -77.0±2.3 -11.46±0.71 80

Note: The data indicate mean value ± standard deviation.

3.3 Characteristics of plant water stable isotope composition

The temporal variations in the δ2H and δ18O values for plant water in the different habitats are shown in Figure 3. The temporal variation trends in the water δ2H and δ18O values for different plants were generally consistent. They showed a maximum in spring, a minimum in summer, and a gradual increase in autumn, which was similar to a ‘U’ shape. The δ2H and δ18O values for plant water in the different vegetation growing seasons varied. The average values for H. ammodendron were -69.6‰ and -9.36‰, ranging from -71.4‰ to -67.8‰ and -9.84‰ to - 8.81‰, respectively; the average values for H. caspica were -53.7‰ and -4.47‰, ranging from -57.6‰ to -47.8‰ and -5.04‰ to -3.47‰, respectively; the average values for N. sibirica were -64.4‰ and -7.49‰, ranging from -70.8‰ to -53.7‰ and -8.91‰ to -4.92‰, respectively; and the average values for P. euphratica were -75.1‰ and -10.18‰, ranging from -80.4‰ to -69.6‰ and -11.52‰ to -7.51‰, respectively. On average, the water stable isotope value for H. caspica was the largest, followed by N. sibirica, H. ammodendron, and P. euphratica. The variation range for the isotope values showed that H. ammodendron and H. caspica had smaller ranges than N. sibirica and P. euphratica. The seasonal differences in the water isotope values for the different plants varied. The one-way ANOVA showed that the isotope values for H. ammodendron and P. euphratica vegetation were significantly different in spring, summer, and autumn (P < 0.05), whereas the isotope values for H. caspica and N. sibirica in summer and autumn were not significantly different (P > 0.05). Furthermore, the isotopic values for spring, summer, and autumn were generally significantly different (P < 0.05). The seasonal variation in plant water isotope values is closely related to the soil water content. In summer, the shallow soil water content was low, but the deep soil water content was relatively high. The isotope composition gradually decreases with increasing depth, and the groundwater isotope value was the lowest, which was consistent with the low isotope value for plant water. However, there does not appear to be a direct relationship with the seasonal variation in precipitation. The summer precipitation was large and the isotope value was high, which was inconsistent with the low value for plant water isotopes. The plant water isotope data reflects the isotope composition of different water sources after mixing, but the seasonal variation in plant water isotopes reflects the different water sources used by vegetation in different growing seasons.
Figure 3 Monthly variation of xylem water δ2H and δ18O in the four plants of the Ebinur Lake basin

3.4 Changes in the proportions of potential water sources absorbed by desert vegetation and its influencing mechanisms

Depending on the different vegetation habitats, water absorption sources include soil water, groundwater, and river water. The utilization ratios of different potential water sources that can be absorbed by vegetation are shown in Figure 4. H. ammodendron vegetation mainly uses groundwater over its entire growth period, followed by deep soil water. However, it uses almost no intermediate layer and shallow soil water. The highest proportion of groundwater was used in summer. The average values in June, July, and August were 83%, 88%, and 79%, and ranged from 66% to 96%, 76% to 97%, and 60% to 94%, respectively. The proportion of groundwater utilized in spring and autumn was slightly lower than that in summer, while the proportion of deep soil water was slightly higher. In April, the proportion of groundwater utilized decreased to 48% and the proportion of deep soil water utilized increased to 28%. In September, the proportion of groundwater utilized was 59% and the proportion of deep soil water utilized was 26%. It can be seen that H. ammodendron mainly used groundwater in summer, whereas it also used deep soil water in spring and autumn. The proportion of water sources used by N. sibirica vegetation varied considerably throughout the growing season. In March and April, shallow soil water was mainly used with contribution rates of 94% and 80%, respectively. In May, the intermediate level soil water was gradually used along with the surface soil water with utilization rates of 28% and 41%, respectively. Deep soil water was mainly used in June, July, and August, and the proportion of groundwater gradually increased. In these three months, the proportions of deep soil water and groundwater were 33% and 29%, 36% and 34%, and 31% and 27%, respectively. In autumn, the utilization ratios for the shallow and intermediate soil water layers gradually increased to 23% and 33%, and 27% and 36%, respectively, in September and October. It can be seen that the water source is mainly groundwater and shallow, intermediate, and deep layer soil water, but it depends on the season. The water sources used by H. caspica vegetation throughout the growing season were mainly the shallow and intermediate layer soil water. In March, soil water in the 20-40 cm layer was mainly used, accounting for 94% of the water utilized. In April, the proportion of soil water from the 40-60 cm layer was 60%, and the proportion of soil water from the intermediate layer increased to 20%. In summer, the shallow soil water proportion began to decline, and the intermediate layer soil water began to increase. In June, July, and August, the shallow soil water proportions were 46%, 29%, and 51%, respectively, and the intermediate layer soil water proportions were 24%, 36%, and 20%, respectively.
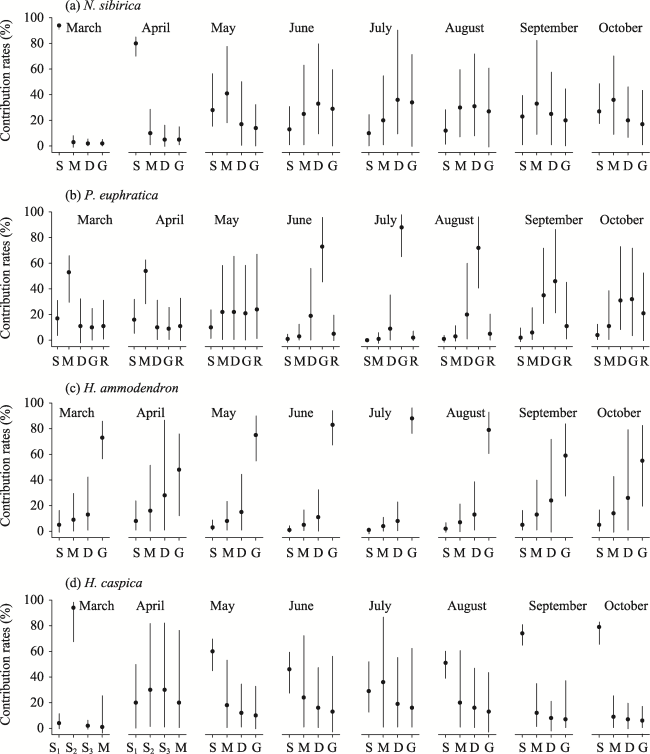
Figure 4 Contribution rates of water consumption from different water sources of the Ebinur Lake basin (S1, S2, S3, S, M, and D represent the soil water in depth of 0-20 cm, 20-40 cm, 40-60 cm, 0-60 cm, 60-140 cm, and 140-200 cm, respectively. G and R represent groundwater and river water. The black dots represent mean values, and the vertical lines represent the range of contribution rates)

4 Discussion

4.1 Environment effect on water use by desert vegetation

The proportion of water sources absorbed by desert vegetation changes with the growth period. This suggests that the plants have different water requirements depending on the season and reflects the adaptations made by vegetation to changes in the dryland environment, especially changes in available water, as a result of the synergistic, co-evolution of vegetation and the environment. Although different vegetation types use different amounts of water during their growth periods, they all show similar trends. In spring, due to snow cover and melting, the soil surface water content is high and desert vegetation preferentially uses shallow soil water. In summer, soil water content decreases and vegetation (especially deep root vegetation) begins to use deep water sources, such as deep soil water and groundwater. In autumn, soil water content increases compared to summer and the intermediate layer soil water proportion increases. The results from this study are consistent with those for desert shrubs in the southern margin of the Gurbantunggut Desert (Sprenger et al., 2016). The utilization of different water sources during the various growth periods indicates that the vegetation roots selectively absorb water from different sources in different seasons and can adapt to the seasonal transformation of available water sources through the rapid growth, activation, or dormancy of roots at different depths (Dai et al., 2015). Soil temperature and water content vary during the three seasons. In summer, the soil temperature is higher (dune and salt marsh surface temperatures reached 40.5-45.6℃, Table 5) and soil water content is lower (shallow soil water content was 2.9%-5.2%, Table 3), which may lead to surface root dormancy or fine root dehydration death under temperature and drought stress. This may stimulate the growth of deep soil roots to absorb and utilize sufficient deep water sources. In this study, H. ammodendron in dune habitats mainly used groundwater in summer, H. caspica in the salt marsh used intermediate and deep layer soil water in summer, and the water source for N. sibirica in the desert habitat used deep soil water in summer. Therefore, desert vegetation has the ability to redistribute root functions at different depths, which allows it to selectively absorb and utilize water sources in the desert vegetation-water system for vegetation growth. The degree to which surface soil is affected by salinization can also induce changes in the available water sources for plants (Kathleen et al., 2008). Due to the strong evaporation effect, the soil surface layer in the arid areas showed high salinization, especially in the salt marsh land and desert habitats (the total salt content of the surface soil was 38.3 g/kg and 26.5 g/kg, respectively, Table 5). In order to reduce the damage caused by salt stress, H. caspica and N. sibirica usually stop absorbing surface soil water and instead absorb deep soil water with a low salt content, while P. euphratica absorbs river water and groundwater with low salt contents. In low-salinization areas, such as riparian habitats, P. euphratica also absorb and utilize more surface and intermediate layer soil water in spring.
Table 5 Temperature, salinity and pH values of soil profile in different habitats of the Ebinur Lake basin
Habitat 0-20 cm 20-40 cm 40-60 cm
Temperature (℃) pH Salinity
(g/kg)
Temperature (℃) pH Salinity
(g/kg)
Temperature (℃) pH Salinity (g/kg)
Sand dune 45.6±3.4 - - 40.3±3.5 - - 32.2±2.9 - -
Salt marsh 40.5±3.6 9.33±0.34 38.3±5.6 36.2±2.9 8.92±0.25 24.5±3.5 29.6±2.1 8.85±0.14 13.5±2.4
Desert 33.4±4.4 8.82±0.21 26.5±4.8 27.5±3.2 8.73±0.15 15.6±4.1 23.4±2.6 8.75±0.13 9.7±1.9
River bank 28.3±2.7 8.75±0.23 12.2±3.6 24.6±2.3 8.68±0.17 9.3±2.6 18.3±1.8 8.63±0.15 6.4±1.8

Note: The data indicate mean value ± standard deviation, the sign “-” represents no values, and the sample time was June in 2018.

Plants grow in the soil and soil water is a direct source of plant water. The process by which plant roots absorb soil water controls plant growth and water status. Groundwater is an important source of water for most desert vegetation types. Changes in groundwater depth can directly affect the distribution of soil moisture and nutrients causing competition among vegetation for water resources, thereby affecting the distribution, growth, and population succession of desert vegetation (Bahejiayinaer et al., 2018). The groundwater depth in the study area was relatively deep, reaching 5 m (Xu, 2018). Therefore, deep rooted vegetation was more successful. In the study area, H. ammodendron showed the highest proportion of groundwater utilization throughout the growing season, but they also use soil water in a relatively humid spring. H. caspica mainly uses shallow soil water, especially in spring, with a ratio of 94%, but the amount of intermediate layer soil water used increases in summer. Similar to N. sibirica, the proportion of shallow soil water used in spring and autumn was the highest, but in summer, the main water used was deep soil water. P. euphratica was dependent on groundwater throughout the growing season, especially in summer. It is worth noting that although they grew on the bank of the Bortala River, they did not show dependence on river water utilization according to the isotope observations, and the maximum proportion of river water utilization was just 24%.

4.2 Effects of vegetation root distribution on water use

The distribution of plant roots determines the water use strategy used by plants. The physiological responses of plants to water deficiency are closely related to their water use strategy, and the responses and adaptations shown by plants to an environment that limits their survival are determined by root function types (Figure 5). H. ammodendron is a deep rooted plant with a large root system that can reach the groundwater layer (Dai et al., 2015). Groundwater is a stable water source that can meet the needs of vegetation throughout the growing season. In addition, the root-crown ratio for H. ammodendron and the corresponding absorbing root are large. More photosynthetic products are distributed in the roots, which may be required if deep rooted plants are to use deep soil water and groundwater. According to this study, the straight root can reach 2 m, the horizontal roots extend 4-6 m, and 2/3 of the total root area is limited to the 40 cm in the upper soil profile (Zhang et al., 2017). The N. sibirica root distribution suggests that it can absorb moisture from the entire soil profile. Therefore, based on the water content of the soil profile, N. sibirica adopts the following survival strategy: it preferentially uses surface soil water in spring and then transfers to deep soil water and groundwater in summer and autumn. There is no detailed data for H. caspica roots, but information can be inferred from the roots produced by Reaumuria songonica, which is also a small shrub living in the same habitat. Its root distribution range is 0-80 cm and 93% of the total absorbed root area is distributed in the 0-60 cm soil profile (Xu and Li, 2009). It can be seen that the root distribution of semi-shrubs, such as H. caspica, is relatively shallow and that it mainly uses water in the shallow and middle soil layers. Therefore, in arid desert areas, H. caspica is strongly resistant to saline-alkali and drought stress. According to this study, P. euphratica grows well on the river bank where the groundwater depth is less than 4 m and it has a water redistribution function (Yang and Lv, 2011). Furthermore, P. euphratica mainly used soil water in spring, which may be due to the low groundwater depth and high soil moisture content. In summer, with the increase in river runoff recharge to groundwater, the plants use more groundwater. This shows that river water is not the main source throughout the entire growth season, indicating that P. euphratica has adopted an optimal water utilization strategy (Si et al., 2014). The seasonal changes in river water mean that P. euphratica can still use river water as an auxiliary water source.
Figure 5 Water sources and their proportions of the four desert vegetation species of the Ebinur Lake basin

5 Conclusions

(1) The hydrogen and oxygen stable isotope composition of precipitation in the Ebinur Lake basin shows significant seasonal variation, with enrichment in summer, dilution in winter, and middle values in spring and autumn. The hydrogen and oxygen isotopic compositions in soil water were enriched in the surface layers of the different habitats and gradually decreased with the increase in soil depth.
(2) Based on the comparison of the stable isotope values for plant water, H. caspica had the highest isotope values in the different seasons, followed by N. sibirica, H. ammodendron, and P. euphratica. The seasonal variation in hydrogen and oxygen values for the different plants was basically the same, with the highest values occurring in spring, the lowest in summer, and gradually increasing in autumn.
(3) The proportion of potential water sources absorbed by desert vegetation varied during different growth periods. H. ammodendron mainly used groundwater throughout the growth period. The proportion of water sources used by N. sibirica varied greatly throughout the growing season. In spring, surface soil water was mainly used, but the proportion of deep soil water and groundwater increased in summer and autumn. In spring, the 20-60 cm soil water was the main water source for H. caspica, but the proportion of soil water in the intermediate layer increased slightly in summer and shallow soil water was used in autumn. P. euphratica mainly used intermediate layer soil water in spring and groundwater in summer, while the utilization of river water was low. In autumn, the utilization proportions of deep soil water, groundwater, and river water began to increase. The root distribution of desert vegetation and water availability determine the water use strategies of desert vegetation.
[1]
Bahejiayinaer T, Min X J, Zang Y X et al., 2018. Water use patterns of co-occurring C3 and C4 shrubs in the Gurbantonggut Desert in northwestern China. Science of the Total Environment, 634: 341-354.

DOI

[2]
Barbeta A, Mejía C, Ogaya R et al., 2015. The combined effects of a long-term experimental drought and an extreme drought on the use of plant-water sources in a Mediterranean forest. Global Change Biology, 21(3): 1213-1225.

DOI PMID

[3]
Brooke A S, Kate L H, Tanya M D, 2014. Water use strategies of two co-occurring tree species in a semi-arid karst environment. Hydrological Processes, 28: 2003-2017.

DOI

[4]
Chen Dingshuai, Dong Zhengwu, Gao Lei, 2017. Water-use process of two desert shrubs along a precipitation gradient in Horqin Sandy Land. Chinese Journal of Plant Ecology, 41(12): 1262-1272. (in Chinese)

DOI

[5]
Chen J, Xu Q, Gao D et al., 2016. Differential water use strategies among selected rare and endangered species in West Ordos Desert of China. Journal of Plant Ecology, 10(4): 660-669.

[6]
Chen Shujiang, Hou Ping, Li Wenhua et al., 2006. Comprehensive Scientific Investigation of Aibi Lake Wetland Nature Reserve in Xinjiang. Urumqi: Xinjiang Science and Technology Press, 1-5. (in Chinese)

[7]
Chen Yaning, Li Zhi, Fang Gonghuan et al., 2017. Impact of climate change on water resources in the Tianshan Mountains, Central Asia. Acta Geographica Sinica, 72(1): 18-26. (in Chinese)

DOI

[8]
Dai Y, Zheng X, Tang L, 2015. Stable oxygen isotopes reveal distinct water use patterns of two Haloxylon species in the Gurbantonggut Desert. Plant Soil, 389: 73-87.

DOI

[9]
Eggemeyer K D, Awada T, Harvey F E et al., 2008. Seasonal changes in depth of water uptake for encroaching trees Juniperus virginiana and Pinus ponderosa and two dominant C4 grasses in a semiarid grassland. Tree Physiology, 29(2): 157-169.

DOI

[10]
Ellsworth P Z, Williams D G, 2007. Hydrogen isotope fractionation during water uptake by woody xerophytes. Plant Soil, 291(2): 93-107.

DOI

[11]
Huo G, Zhao X, Gao X, 2018. Seasonal water use patterns of rainfed jujube trees in stands of different ages under semiarid Plantations in China. Agriculture, Ecosystems and Environment, 265: 392-401.

DOI

[12]
Ines K B, Jadranka B, Andreja S, 2020. Isotope composition of precipitation, groundwater, and surface and lake waters from the Plitvice Lakes, Croatia. Water, 12: 2414.

DOI

[13]
Kathleen D, Tala A, Edwin H, 2008. Seasonal changes in depth of water uptake for encroaching trees Juniperus virginiana and Pinus ponderosa and two dominant C4 grasses in a semiarid grassland. Tree Physiology, 29: 157-169.

DOI

[14]
Liu Jianrong, Song Xianfang, Yuan Guofu, 2008. Characteristics of δ18O in precipitation over Northwest China and its water vapor sources. Acta Geographica Sinica, 63(1): 12-22. (in Chinese)

[15]
Liu Shubao, Chen Yaning, Chen Yapeng et al., 2016. Response of Populus euphratica at different ages to rainfall pulses in the desert riparian forest of the lower reaches of the Heihe River. Arid Zone Research, 33(1): 172-178. (in Chinese)

[16]
Pang Zhonghe, 2014. Mechanism of water cycle changes and implications on water resources regulation in Xinjiang Uygur Autonomous Region. Quaternary Sciences, 34(5): 907-917. (in Chinese)

[17]
Phillips D L, Gregg J W, 2003. Source partitioning using stable isotopes: Coping with too many sources. Oecologia, 136(2): 261-269.

PMID

[18]
Qian Yibing, Wu Zhaoning, Chang Yishen et al., 2013. South-north differences of vegetations and soils in the Aibi Lake area. Arid Land Geography, 36(5): 781-789. (in Chinese)

[19]
Schultz N M, Griffis T J, Lee X H, 2011. Identification and correction of spectral contamination in 2H/1H and 18O/16O measurement in leaf, stem, and soil water. Rapid Communications in Mass Spectrometry, 25(21): 3360-3368.

DOI

[20]
Schwendenmann L, Pendall E, Sanchez-Bragado R et al., 2015. Tree water uptake in a tropical plantation varying in tree diversity: Interspecific differences, seasonal shifts and complementarity. Ecohydrology, 8(1): 1-12.

DOI

[21]
Si J, Feng Q, Cao S, 2014. Water use sources of desert riparian Populus euphratica forests. Environmental Monitoring and Assessment, 186(9): 5469-5477.

DOI

[22]
Sprenger M, Leistert H, Gimbel K, 2016. Illuminating hydrological processes at the soil-vegetation-atmosphere interface with water stable isotopes. Reviews of Geophysics, 54(3): 674-704.

DOI

[23]
Wang Yanli, Liu Lichao, Gao Yanhong, 2016. Analysis of water sources of plants in artificial sand-fixation vegetation area based on large rainfall events. Chinese Journal of Applied Ecology, 27(4): 1053-1060. (in Chinese)

DOI PMID

[24]
Chen Hui, Zhu Jianjia et al., 2014. Water sources of five dominant desert plant species in Nuomuhong area of Qaidam Basin. Acta Ecologica Sinica, 34(21): 6277-6286. (in Chinese)

[25]
Xu Guiqing, Li Yan, 2009. Roots distribution of three desert shrubs and their response to precipitation under co-occurring conditions. Acta Ecologica Sinica, 29(1): 130-137. (in Chinese)

DOI

[26]
Xu Li, 2014. The research of soil and lake level changes for different plant communities in the Ebinur Lake wetland[D]. Urumqi: Xinjiang Normal University. (in Chinese)

[27]
Yang Xiaodong, Lv Guanghui, 2011. Estimation of hydraulic redistribution of Populus euphratica in Ebinur Lake wetland. Chinese Journal of Plant Economy, 35 (8): 816-824. (in Chinese)

[28]
Zhang C, Li X, Wu H, 2017. Differences in water-use strategies along an aridity gradient between two coexisting desert shrubs (Reaumuria soongorica and Nitraria sphaerocarpa): Isotopic approaches with physiological evidence. Plant Soil, 419: 169-187.

DOI

[29]
Zhao X, Li F D, 2018. Stable isotope evidences for identifying crop water uptake in a typical winter wheat-summer maize rotation field in the North China Plain. Science of the Total Environment, 618: 121-131.

DOI

[30]
Zhou Hai, Zhao Wenzhi, He Zhibin, 2017. Water sources of Nitraria sibirica and response to precipitation in two desert habitats. Chinese Journal of Applied Ecology, 28(7): 2983-2092. (in Chinese)

Outlines

/