
Journal of Geographical Sciences >
Ecological changes and the tradeoff and synergy of ecosystem services in western China
|
Niu Linan (1996-), PhD Candidate, specialized in Geographic Information System applications. E-mail: niuln.18b@igsnrr.ac.cn |
Received date: 2022-01-14
Accepted date: 2022-02-28
Online published: 2022-08-25
Supported by
Strategic Priority Science and Technology Special Project of Chinese Academy of Sciences(XDA23100203)
National Key Research and Development Program of China(2017YFC0506501)
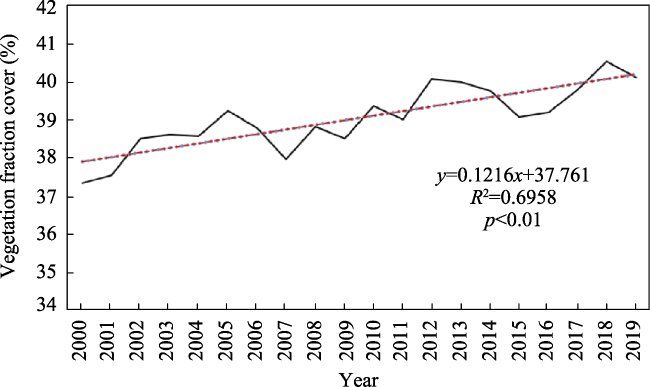
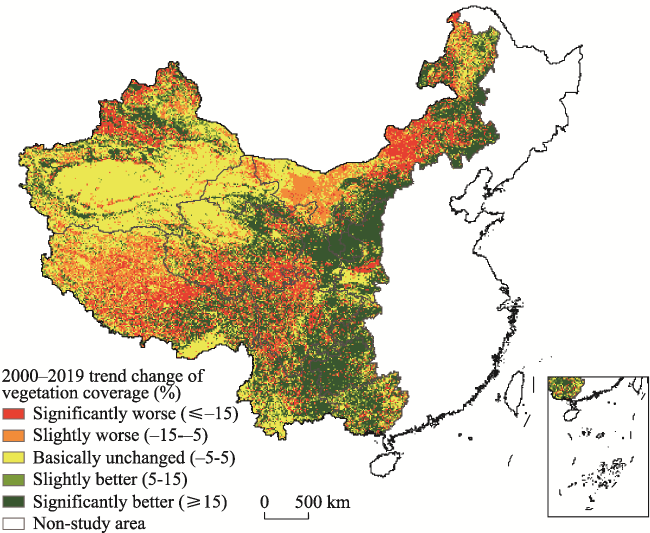
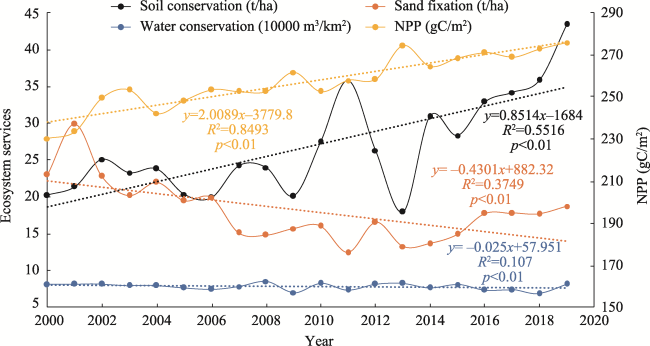
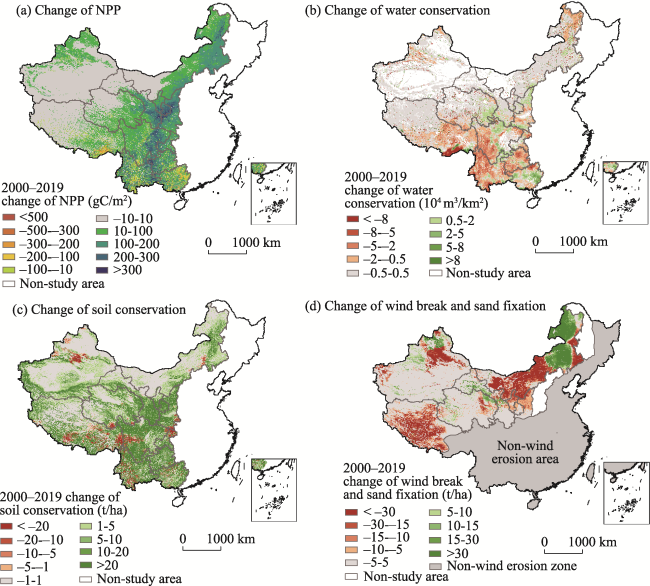
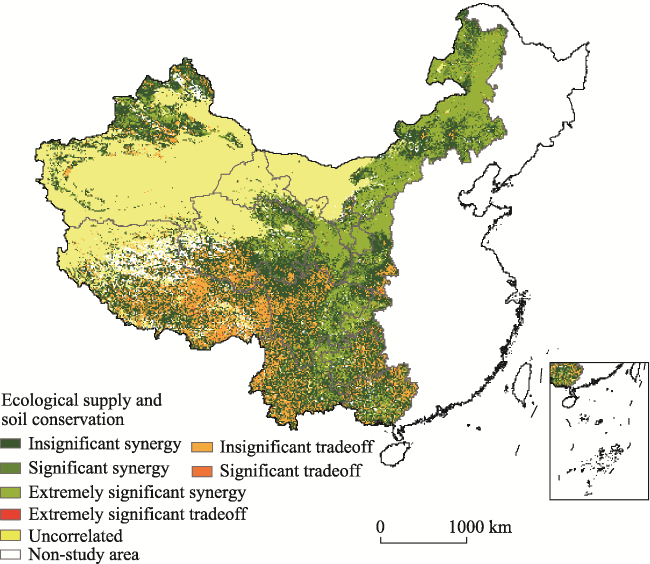
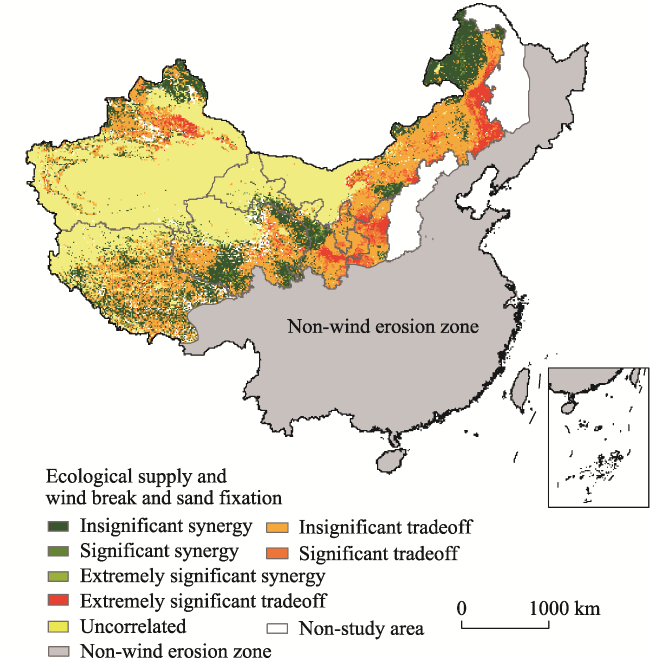
Since the implementation of the Development of Western Regions in 2000, a series of major ecological construction projects have been implemented, leading to a series of changes in the ecological conditions and ecological services of western China. This study calculated the amount of ecosystem services in total in the western region from 2000 to 2019, and analyzed ecological changes and the characteristics of spatio-temporal variations in ecological services. A relevant analysis method was applied to explore the tradeoff and synergy of service. It was found that the area of settlements and wetland ecosystems in the western region increased significantly from 2000 to 2015, whereas grassland showed a downward trend year by year. The vegetation fraction showed a decreasing belt-like distribution from south to north. It showed a fluctuating increase during 2000 to 2019, with inter-annual and large spatial differences. The water conservation service (WCS) had a slight downward trend from 2000 to 2019, and the main decreasing areas were distributed in southeastern Tibet, the western part of the Three Rivers Source region, and the karst rocky desertification area. The soil conservation service (SCS) showed an increasing but fluctuating trend, with the greatest increases observed in the Loess Plateau region, western Sichuan and Yunnan, northwest Tibet, and southeast Tibet. The windbreak and sand fixation service (SFS) showed a downward trend, and the sharp decline was mainly in the central and western parts of Inner Mongolia, Tibet and parts of northern Xinjiang. Ecosystem supply and WCS, and SCS were mainly synergistic, which were found in areas north of the Qinling Mountains-Huaihe River (QM-HR) line, especially in Ningxia and Inner Mongolia. Ecosystem supply was mainly tradeoffs with SFS, and it was found in the agriculture-pastoral transition zone. The synergistic degree of ecosystem services in areas subjected to ecological engineering policy was greater than that in non-engineering areas. Quantitative assessment of ecosystem service changes and their tradeoffs is helpful for scientific ecological management and maximizing ecological benefits.
NIU Linan , SHAO Quanqin , NING Jia , HUANG Haibo . Ecological changes and the tradeoff and synergy of ecosystem services in western China[J]. Journal of Geographical Sciences, 2022 , 32(6) : 1059 -1075 . DOI: 10.1007/s11442-022-1985-6
Table 1 Statistics of changes in macro structure of ecosystem areas during 2000-2015 (104 km2) |
| Ecosystems | 2000 | 2005 | 2010 | 2015 | Change area from 2000-2015 | Rate of change (%) |
|---|---|---|---|---|---|---|
| Cropland | 66.38 | 67.86 | 68.20 | 70.19 | 3.81 | 5.74 |
| Forest | 112.97 | 116.10 | 115.78 | 115.57 | 2.60 | 2.30 |
| Grassland | 281.18 | 272.65 | 266.45 | 245.76 | -35.42 | -12.60 |
| Water bodies and wetland | 19.06 | 21.22 | 19.78 | 26.44 | 7.38 | 38.72 |
| Settlement | 1.37 | 1.57 | 2.12 | 5.76 | 4.39 | 320.43 |
| Desert | 127.63 | 128.36 | 127.59 | 128.68 | 1.05 | 0.82 |
| Other ecosystems | 63.15 | 63.08 | 72.15 | 75.65 | 12.50 | 19.79 |
Table 2 Change in terrestrial ecosystem types during 2000-2015 (104 km2) |
| 2000 | 2015 | ||||||
|---|---|---|---|---|---|---|---|
| Cropland | Forest | Grassland | Water bodies and wetland | Settlement | Desert | Others | |
| Cropland | 47.74 | 5.83 | 8.38 | 1.09 | 2.98 | 0.26 | 0.09 |
| Forest | 8.35 | 89.31 | 12.69 | 1.53 | 0.31 | 0.27 | 0.42 |
| Grassland | 11.74 | 18.17 | 194.60 | 8.84 | 1.02 | 21.15 | 25.61 |
| Water bodies and wetland | 0.52 | 0.32 | 2.62 | 11.93 | 0.09 | 0.83 | 2.72 |
| Settlement | 0.19 | 0.04 | 0.09 | 0.05 | 0.97 | 0.03 | 0.004 |
| Desert | 1.44 | 0.36 | 10.39 | 1.74 | 0.35 | 105.82 | 7.52 |
| Others | 0.20 | 1.48 | 16.91 | 1.21 | 0.04 | 4.06 | 39.23 |
Figure 1 Change in fractional vegetation cover (FVC) and its trend in western China during 2000-2019 |
Figure 2 Spatial distribution of fractional vegetation cover (FVC) trend change in western China during 2000-2019 |
Figure 3 Changes of ecosystem services in western China during 2000-2019 |
Figure 4 Spatial change of ecosystem services in western China during 2000-2019 |
Figure 5 Spatial distribution of the relationship between ecosystem supply and water conservation service (WCS) in western China during 2000-2019 |
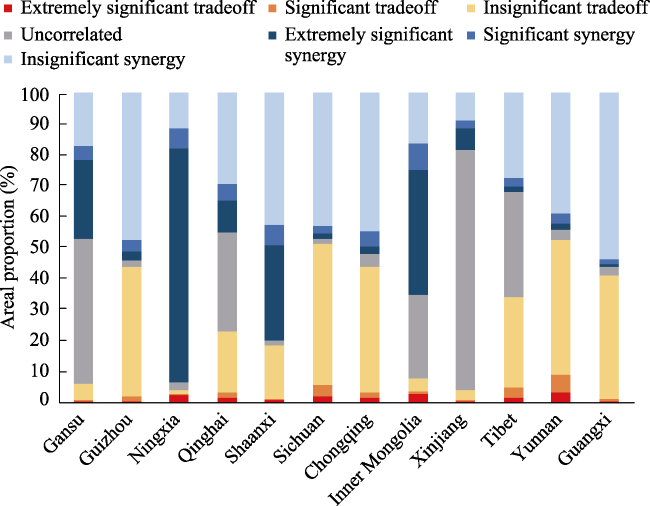
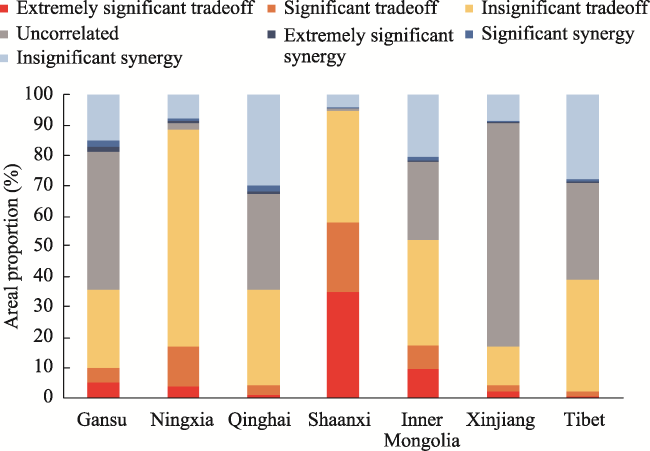
Figure 6 Areal proportion of tradeoff and synergy between ecosystem supply services and water conservation service (WCS) in western China during 2000-2019 |
Figure 7 Spatial distribution of the relationship between ecosystem supply and soil conservation service (SCS) in western China during 2000-2019 |
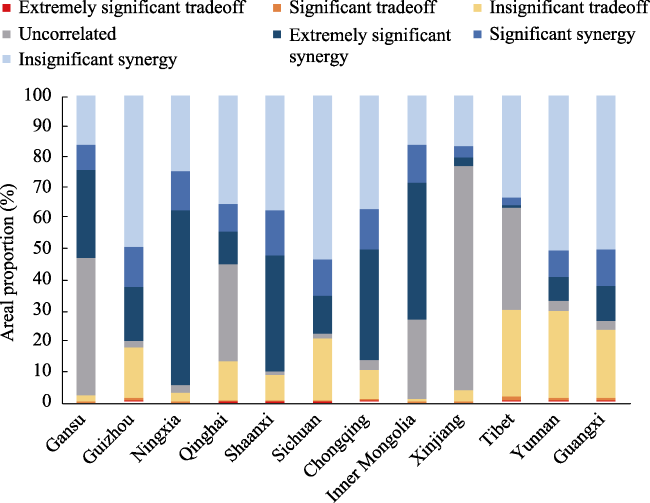
Figure 8 Areal proportion of tradeoff and synergy between ecosystem supply services and soil conservation service (SCS) in western China during 2000-2019 |
Figure 9 Spatial distribution of the relationship between ecosystem supply and wind prevention and sand fixation service (SFS) in western China during 2000-2019 |
Figure 10 Areal proportion of tradeoff and synergy between ecosystem supply services and wind prevention and sand fixation service (SFS) in western China during 2000-2019 |
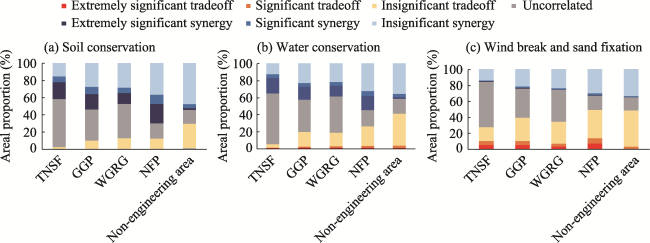
Figure 11 Areal proportion of tradeoff and synergy of ecosystem services in different ecological engineering areas of western China during 2000-2019 |
| [1] |
|
| [2] |
|
| [3] |
|
| [4] |
|
| [5] |
|
| [6] |
|
| [7] |
|
| [8] |
|
| [9] |
|
| [10] |
|
| [11] |
|
| [12] |
|
| [13] |
|
| [14] |
|
| [15] |
|
| [16] |
|
| [17] |
|
| [18] |
|
| [19] |
|
| [20] |
|
| [21] |
|
| [22] |
|
| [23] |
|
| [24] |
|
| [25] |
|
| [26] |
|
| [27] |
|
| [28] |
|
| [29] |
|
| [30] |
|
| [31] |
|
| [32] |
|
| [33] |
|
| [34] |
|
| [35] |
|
| [36] |
|
| [37] |
|
| [38] |
|
| [39] |
|
| [40] |
|
| [41] |
|
| [42] |
|
| [43] |
|
| [44] |
|
| [45] |
|
| [46] |
|
/
| 〈 |
|
〉 |
