
Journal of Geographical Sciences >
Spatio-temporal patterns and driving mechanism of farmland fragmentation in the Huang-Huai-Hai Plain
|
Zheng Yuhan (1994-), PhD Candidate, specialized in urban-rural development and land use. E-mail: zhengyh.19b@igsnrr.ac.cn |
Received date: 2021-08-26
Accepted date: 2022-01-27
Online published: 2022-08-25
Supported by
National Natural Science Foundation of China(41731286)
National Natural Science Foundation of China(41971216)
Natural Science Foundation of Guangxi Zhuang Autonomous Region(2018GXNSFDA281032)
Program of Science and Technology Plan of Guangxi Zhuang Autonomous Region(AD19110158)
The Bagui Scholars Program of Guangxi Zhuang Autonomous Region
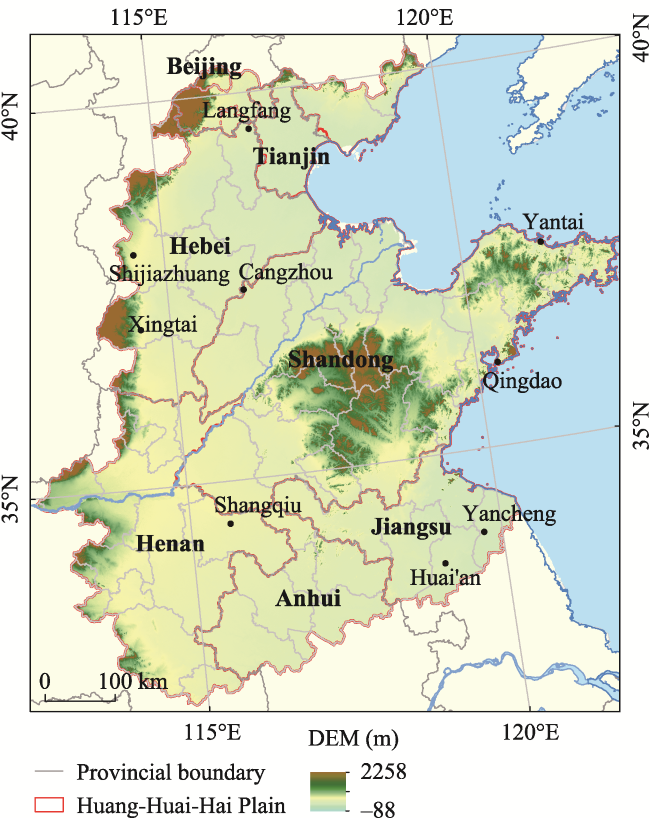
Exploring the spatio-temporal variations of farmland landscape patterns in a traditional agricultural region can provide scientific support for decision-making on sustainable rural land use and rural vitalization development. This study established a comprehensive evaluation index for farmland fragmentation with multiple aspects (dominance, integrity, aggregation, regularity, and connectivity) at the county scale. The goal was to identify the evolution of farmland fragmentation in the traditional agricultural region of the Huang-Huai-Hai Plain during 2000-2015 and investigate underlying drivers using panel data of 359 counties. Results showed an accelerating but fluctuating fragmentation pattern of the farmland landscape. The indexes of dominance, integrity, and aggregation of farmland decreased most sharply, while the index of connectivity increased. Furthermore, the evolution of the farmland fragmentation pattern showed significant spatio-temporal heterogeneity, which is similar to the trajectory of urbanization and land use transition. Farmland fragmentation in municipal districts also emerged earlier and was more severe than in county-level cities and counties. Factors influenced by advancing urbanization include the proportion of artificial land, population density, and proportion of primary industry; these factors drove the evolution of farmland fragmentation. In contrast, the increase in income of rural residents and production efficiency of farmland were the key factors contributing to the improvement in farmland connectivity.
ZHENG Yuhan , LONG Hualou , CHEN Kunqiu . Spatio-temporal patterns and driving mechanism of farmland fragmentation in the Huang-Huai-Hai Plain[J]. Journal of Geographical Sciences, 2022 , 32(6) : 1020 -1038 . DOI: 10.1007/s11442-022-1983-8
Figure 1 Location of the Huang-Huai-Hai Plain (HHHP) |
Table 1 The comprehensive evaluation system of farmland landscape patterns in the Huang-Huai-Hai Plain |
| Target level | Standard level | Indicators | Impact | Weight |
|---|---|---|---|---|
| Index of farmland fragmentation (FFI) | Farmland dominance index (FDI) | Largest patch index (LPI) Percentage of landscape (PLAND) | + + | 0.254 |
| Farmland integrity index (FII) | Patch density (PD) Area-weighted mean patch area (AREA_AM) | - + | 0.080 | |
| Farmland regularity index (FRI) | Area-weighted shape index (SHAPE_AM) Edge density (ED) | - - | 0.106 | |
| Farmland aggregation index (FAI) | Landscape shape index (LSI) Landscape division index (DIVISION) | - - | 0.291 | |
| Farmland connectivity index (FCI) | Connectance index (CONNECT) | + | 0.269 | |
| Interspersion juxtaposition index (IJI) | + | |||
| Splitting index (SPLIT) | - |
Table 2 Driving variables in the multiple linear regression model and their definitions |
| Criterion | Indicators | Data description | Unit |
|---|---|---|---|
| Geographic factors | Temperature (TEMP) | Average annual air temperature | ℃ |
| Precipitation (PRE) | Average annual precipitation | mm | |
| Demographic factors | Proportion of rural population (PRP) | $\frac{\text { Rural population }}{\text { Total population }}$ | |
| County’s population density (CPD) | 1 km × 1 km raster | people/km2 | |
| Average farmland area per household (FAH) | $\frac{Area of farmland}{Number of rural households}$ | ha/household | |
| Socio-economic factors | The proportion of primary industry in GDP (PPI) | $\frac{ GDP in primary industry }{GDP} $ | |
| Proportion of artificial land area (PAL) | $\frac{Artificial surfaces in county i}{Area of county i}$ | ||
| Per capita disposable income of rural residents (PIR) | China Statistical Yearbook (county level) | yuan | |
| Farmland production efficiency (FPE) | $\frac{GDP in the primary industry in county i}{Area of farmland in county i}$ | 104 yuan/ha | |
| Administrative level factor | Administrative divisions | Dummy variables: Municipal districts, county-level city, county, 1 or 0 |
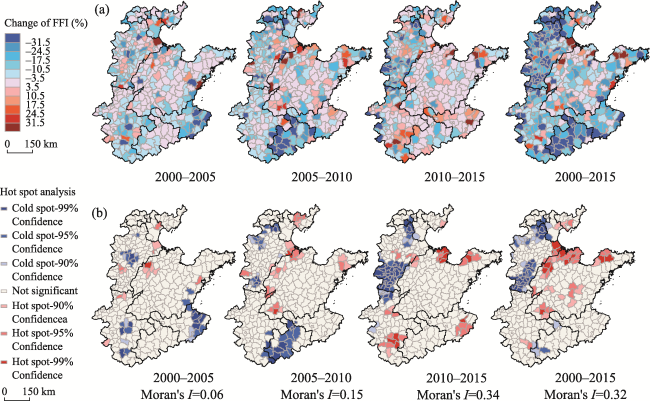
Figure 2 Distribution and hot spot analysis of the interannual variation of index of farmland fragmentation in the Huang-Huai-Hai Plain |
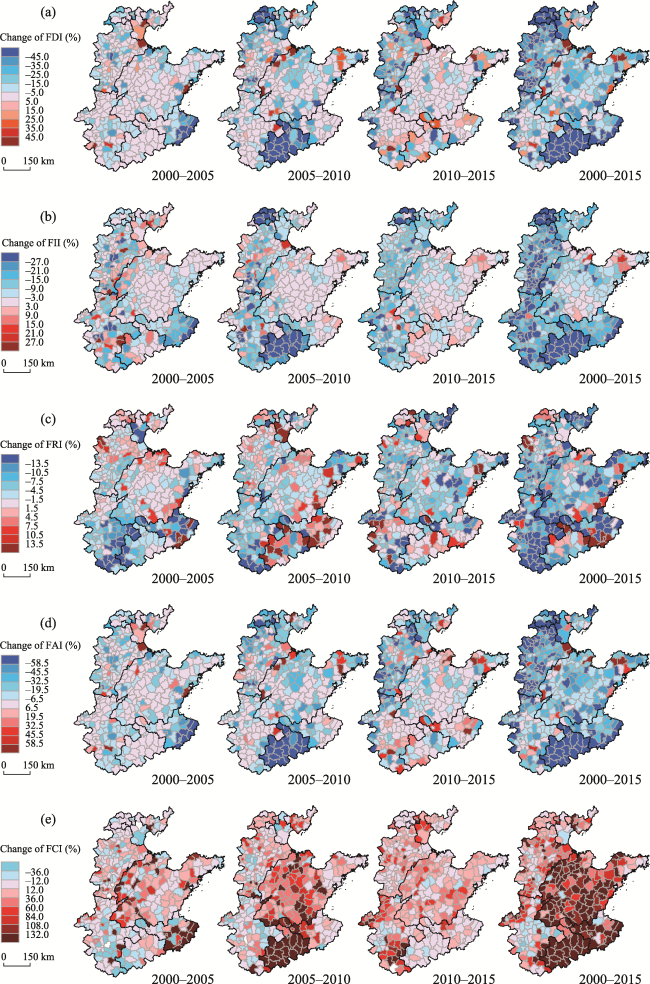
Figure 3 Distribution of interannual variation of multidimensional evaluation indexes in the Huang-Huai-Hai Plain |
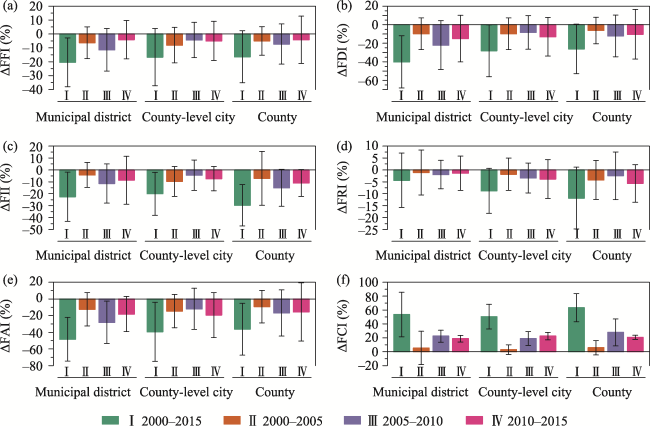
Figure 4 Statistics on interannual variations of evaluation indexes in municipal districts, county-level cities, and counties in the Huang-Huai-Hai Plain |
Table 3 The estimation results of multiple regression on farmland landscape evolution and the driving factors in the Huang-Huai-Hai Plain from 2000 to 2015 |
| Farmland fragmentation index, FFI | Farmland dominance index | Farmland integrity index | Farmland regularity index | Farmland aggregation index | Farmland connection index | |
|---|---|---|---|---|---|---|
| PRP | 0.0933*** | 0.1310*** | 0.0771*** | 0.0769*** | 0.2035*** | -0.0505 |
| (-3.54) | (-2.66) | (-3.29) | (-3.78) | (-3.9) | (-1.37) | |
| PPI | 0.0739*** | 0.1746*** | 0.1244*** | 0.0697*** | 0.2272*** | -0.2007*** |
| (-2.64) | (-3.34) | (-5.00) | (-3.23) | (-4.1) | (-5.12) | |
| PAL | -0.8169*** | -1.8754*** | -0.0358 | 0.3770*** | -1.3329*** | 0.0398 |
| (-4.90) | (-6.02) | (-0.24) | (-2.93) | (-4.04) | (-0.17) | |
| TEMP | -0.0287*** | -0.0483*** | -0.0228*** | 0.0047 | -0.0459*** | -0.0064 |
| (-4.56) | (-4.12) | (-4.08) | (-0.97) | (-3.69) | (-0.73) | |
| In(PRE) | 0.0328** | 0.0500* | 0.0535*** | 0.0615*** | 0.0737*** | -0.0452** |
| (-2.38) | (-1.95) | (-4.37) | (-5.78) | (-2.7) | (-2.35) | |
| In(CPD) | -0.0573*** | -0.0765*** | -0.0213* | 0.009 | -0.0972*** | -0.0329* |
| (-4.34) | (-3.10) | (-1.81) | (-0.88) | (-3.71) | (-1.78) | |
| FAH | 0.1538*** | 0.3046*** | 0.1772*** | 0.0921*** | 0.3976*** | -0.2352*** |
| (-4.13) | (-4.38) | (-5.36) | (-3.2) | (-5.39) | (-4.52) | |
| PIR | -0.0726*** | -0.1855*** | -0.0660*** | -0.0967*** | -0.2119*** | 0.1926*** |
| (-5.06) | (-6.92) | (-5.17) | (-8.72) | (-7.45) | (-9.59) | |
| FPE | 0.0007* | 0.0002 | -0.0002 | -0.0001 | 0.0007 | 0.0017*** |
| (-1.8) | (-0.26) | (-0.56) | (-0.46) | (-0.97) | (-3.19) | |
| Constant | 0.9624*** | 1.3737*** | 0.2404* | 0.1226 | 1.0533*** | 1.0205*** |
| (-5.89) | (-4.5) | (-1.65) | (-0.97) | (-3.25) | (-4.46) | |
| Observations | 1436 | 1436 | 1436 | 1436 | 1436 | 1436 |
| R-squared | 0.288 | 0.348 | 0.287 | 0.269 | 0.367 | 0.322 |
Notes: *, **, and *** represent 10%, 5%, and 1% significance levels, respectively; t values are in parentheses. PRP: Proportion of rural population. PPI: the proportion of primary industry in GDP. PAL: Proportion of artificial land area. TEMP: Temperature. PRE: Precipitation. CPD: County’s population density, FAH: Average farmland area per household, PIR: Per capita disposable income of rural residents, FPE: Farmland production efficiency. |
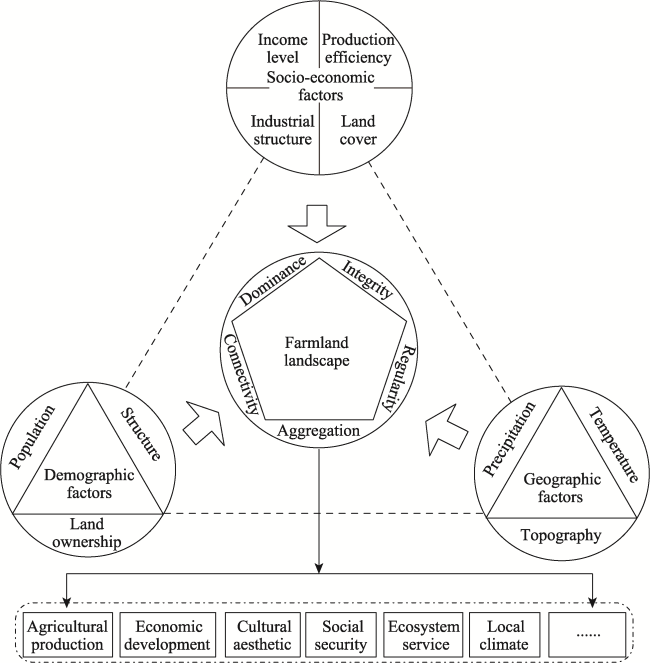
Figure 5 The conceptual framework of the driving mechanism |
| [1] |
|
| [2] |
|
| [3] |
|
| [4] |
|
| [5] |
|
| [6] |
|
| [7] |
|
| [8] |
|
| [9] |
|
| [10] |
|
| [11] |
|
| [12] |
|
| [13] |
|
| [14] |
|
| [15] |
|
| [16] |
|
| [17] |
|
| [18] |
|
| [19] |
|
| [20] |
|
| [21] |
|
| [22] |
|
| [23] |
|
| [24] |
|
| [25] |
|
| [26] |
|
| [27] |
|
| [28] |
|
| [29] |
|
| [30] |
|
| [31] |
|
| [32] |
|
| [33] |
|
| [34] |
|
| [35] |
|
| [36] |
|
| [37] |
|
| [38] |
|
| [39] |
|
| [40] |
|
| [41] |
|
| [42] |
|
| [43] |
|
| [44] |
|
| [45] |
|
| [46] |
|
| [47] |
|
| [48] |
|
| [49] |
|
| [50] |
|
| [51] |
|
| [52] |
|
| [53] |
|
| [54] |
|
| [55] |
|
| [56] |
|
| [57] |
|
| [58] |
|
| [59] |
|
| [60] |
|
| [61] |
|
| [62] |
|
| [63] |
|
| [64] |
|
/
| 〈 |
|
〉 |