Research Articles

Spatial evolution and growth mechanism of urban networks in western China: A multi-scale perspective

  • YANG Liangjie , 1 ,
  • WANG Jing 1 ,
  • YANG Yongchun 2
Expand
  • 1. School of Geography and Environmental Sciences, Northwest Normal University, Lanzhou 730070, China
  • 2. School of Resources and Environmental, Lanzhou University, Lanzhou 730070, China

Yang Liangjie (1977-), PhD and Associate Professor, specialized in urban ecology and city networks research. E-mail:

Received date: 2021-05-25

  Accepted date: 2021-11-17

  Online published: 2022-05-25

Supported by

National Natural Science Foundation of China(41501176)

National Natural Science Foundation of China(41961030)

Abstract

Globalization and informatization promote the evolution of urban spatial organization from a hierarchical structure mode to a network structure mode, forming a complex network system. This study considers the coupling of “space of flows” and “spaces of places” as the core and “embeddedness” as the link and a relevant theoretical basis; then we construct a conceptual model of urban networks and explore the internal logic of enterprise networks and city networks. Using the interlocking-affiliate network model and data from China’s top 500 listed companies, this study constructs a directed multi-valued relational matrix between cities in western China from 2005 to 2015. Using social network analysis and the multiple regression of quadratic assignment program model (MRQAP), this study adopts a “top-down” research perspective to analyze the spatio-temporal evolution and growth mechanism of the city network in western China from three nested spatial scales: large regions, intercity agglomerations, and intracity agglomerations. The results show the following: (1) Under the large regional scale, the city network has good symmetry, obvious characteristics of hierarchical diffusion, neighborhood diffusion, and cross-administrative regional connection, presenting the “core-periphery” structural pattern. (2) The network of intercity agglomerations has the characteristics of centralization, stratification, and geographical proximity. (3) The internal network of each urban agglomeration presents a variety of network structure modes, such as dual-core, single-core, and multicore modes. (4) Administrative subordination and economic system proximity have a significant positive impact on the city network in western China. The differences in internet convenience, investment in science and technology, average time distance, and economic development have negative effects on the growth and development of city networks. (5) The preferential attachment is the internal driving force of the city network development.

Cite this article

YANG Liangjie , WANG Jing , YANG Yongchun . Spatial evolution and growth mechanism of urban networks in western China: A multi-scale perspective[J]. Journal of Geographical Sciences, 2022 , 32(3) : 517 -536 . DOI: 10.1007/s11442-022-1959-8

1 Introduction

The world is currently transitioning from industrialism to informationism, which promotes the organizational reform of geo-space to form a new spatial pattern from the core-periphery model to the network pattern beyond geographical distance (Sun et al., 2009; Li, 2015). An increasing number of cities are being integrated into the world city network, gradually forming a multi-scale, multilevel complex network system (Zhou, 2006; Cao et al., 2018). Since the 1990s, the development of the “network research paradigm” (Castells, 1996) in the social sciences has prompted planners and geographers to study city networks at different spatial scales (Leng et al., 2011; Li, 2019). Globalization and World Cities Research Network(http://www.lboro.ac.uk/gawc) represented by scholars such as Taylor described the world city network by using the intra-enterprise connections of advanced producer services (Taylor et al., 2001, 2002). Subsequently, the types of connections among world cities have gradually expanded to social and cultural connections (Taylor, 2005), transportation connections, and innovation connections (Matthiessen, 2010).
Many scholars have investigated national and regional city networks (Wei et al., 2018). Inter-city connections are mainly focused on firms, with the increasing availability of data. Firm linkages can be divided into intra-firm and inter-firm links. For intra-firm linkages, intra-firm link data, and headquarters-branch linkages of large manufacturing firms are used to explore urban networks in China, most inter-firm linkages are directly built as inter-firm cooperation relationship data based on a questionnaire (Ma et al, 2011; Yeh et al., 2015) or as inter-firm service relationship data present in IPOs (Pan et al., 2017). Inter-firm linkages are studied less frequently because of the struggle to obtain data and the low percentage of obtained samples, deviating from objective reality. Inter-city connections include transport links (Wang et al., 2018; Mina et al., 2020), social network (Zhen et al., 2012; Ashkezari-Toussi et al., 2019), and information and innovation connections (Hu et al., 2020). Comparing other studies, the organizational structure of multilocation and multi-department enterprise is the core force for the growth and development of urban networks (Liu et al., 2013; Sheng, 2018, 2020; Chong et al., 2020), as well as the research method conceptually closest to the actual formation process of city networks (Derudder et al., 2005). Zhao et al. (2019) constructed an eclectic network model that reflects the hierarchical nature of the connections between enterprises. However, research on urban networks based on enterprise networks mainly focuses on advanced production services and lacks the analysis of other industries. Therefore, we research all industries based on city networks, which will benefit city networks’ research methods and objects.
Presently, research on city networks based on enterprise networks mainly focuses on the global city network or the city network of economically developed areas. In China, the Pearl River Delta, Yangtze River Delta, Beijing-Tianjin-Hebei, and other regions have become hotspots for city network research. In contrast, there is a lack of research on city networks in underdeveloped western regions. Furthermore, research on city networks mainly focuses on the spatial structure and its dynamic changes, multicenter models, etc. (Cervero et al., 1998; Li et al., 2018). Most studies consider a single-scale perspective. There are only a few studies on the characteristics of the city network structure and its multi-scale based growth mechanism. Li (2019) analyzed the structural characteristics of the innovation network of the Yangtze River Delta from three regional, national, and global scales. Xu et al. (2019) explained the reconstruction of regional spatial systems by focusing on high-speed railways developed in urban agglomerations. Sun et al. (2020) studied the centrality of Chinese cities from different scales.
Most studies examining the influencing factors of city networks used attribute data to analyze the influencing factors, but there is a lack of research on the dynamic mechanisms of city networks that applied relational data. Li (2014) attempted to measure structural parameters as variables to determine influences. Kang et al. (2020) explored the influencing factors based on the attribute data. Sheng (2019) quantitatively identified the influences and dynamic mechanisms of city network evolution by combining attribute data with relational data. Song et al. (2018) combined attribute and relational data to analyze factors using directional relational data. Yuan et al. (2019) explored important factors affecting trade networks by using a relationship matrix. The essential feature of an urban network is the intercity connection. The complexity and diversity of the connections between cities drive research on its development mechanisms and should be explored from a relational perspective. However, current research on the growth mechanisms of city networks is restricted by the endogeneity of relational data. Existing research on city network influences mainly focuses on the correlation analysis of social and economic environments and other attribute data. Studies on the mechanisms of city networks using relational data are rare. Therefore, research on the growth mechanisms of urban networks from the perspective of relationships is urgently needed.
This study has three purposes: (1) to illustrate the internal logic between enterprise and city networks; (2) to show how these reflect/constitute power relativities between cities in western China and the changing trends of the network structure at different spatial scales; and (3) to generate discussions on the mechanisms of city networks on an empirical basis.
The backward areas are “dropped off” the research map, which has the defect of biasing theory towards developed regional centers. Western China is relatively backward, but its developmental potential is great. Moreover, research in the western region will have a significant impact on the development of China as a whole. This will fill the gap in the study of less-developed areas in developing countries. Exploring the spatial structure, developmental trend, and growth mechanisms of city networks can help us understand the characteristics of urban development and the mechanisms of city networks in western China.
The remainder of this paper is organized as follows: The second section offers a theoretical summary of city networks and scale reconstruction. The third section introduces the data and methods. The fourth section introduces the network structure characteristics of western China, urban agglomeration, and inner-city agglomeration. The fifth section uses the multiple regression of quadratic assignment program (MRQAP) to discuss the growth mechanism of city network relations. The last section concludes with a discussion.

2 Theoretical basis

2.1 City network conceptual model

A city is a complex, self-organizing system in which each subsystem interacts to form a higher-level urban system, that is, a city within an urban system (Berry, 1964; Li, 2012). In this system, there are very complex interactions among material, energy, and information, forming various “space of flows.” In a “space of flows,” various critical human activities are completed in the “space carrier” via “actor carriers” in the form of various factor flows (Castells, 2007). Cities are the most important “space carriers” for various social and economic activities. There is a close division of labor and cooperation within the city region, and through the industrial chain, a cooperative and complementary relationship is developed to form an interrelated production and city network (Ren et al., 2009).
In the past 30 years, studies on city networks based on the perspective of enterprise networks have been increasing (Rozenblat, 2010; Sheng, 2020). There are two streams of literature centers: one is centered around the GaWC group with Taylor taking the lead, and the other is the research carried out by Alderson and Beckfield (2004) and Derudder (2006). Although Taylor and Alderson both started from the enterprise organizational relationship based on spatial interaction theory and the “space of flows” theory, they introduced the social network analysis method into the study of city networks, which entails obvious shortcomings (Liu et al., 2013; Zhao et al., 2016). Moreover, most of the existing studies on city networks from the perspective of enterprise networks are empirical studies, and it is rare to find in-depth analyses of the intrinsic logical connections between enterprise and city networks.
Based on these, we construct a conceptual framework of city networks by coupling “space of flows” and “spaces of places” as the foundation and using “Embed” as the link, respectively. We use spatial interaction, space of flows, and actor-network theory as the basic theories and propose an interlocking-affiliate network model with the world city network model. Moreover, we use social network analysis as the basic method, which combine the advantages of the interlocking network model and headquarters-branch network model. The conceptual framework provides a new perspective for constructing a comprehensive city network model (Figure 1).
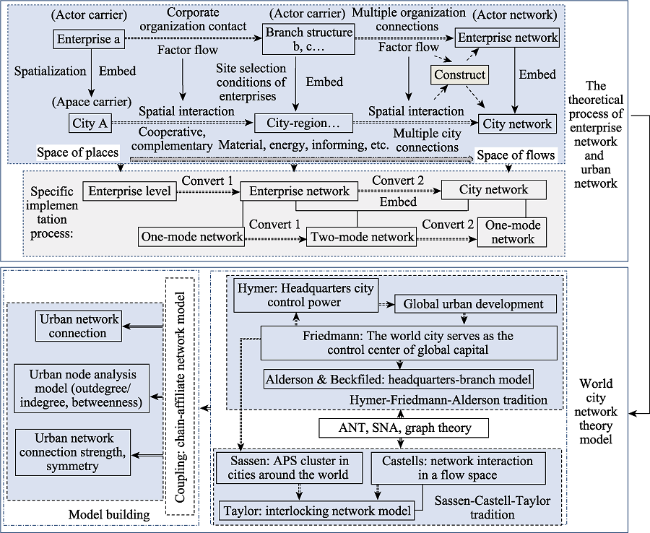
Figure 1 Conceptual framework for city network research

2.2 Multi-scale based city network analysis

The scale is one of the core concepts of human geography. Early human geographers believed that scales had a vertical and nested relationship (Taylor, 1982; Smith, 2000). The “global-national-local” scale framework proposed by Taylor signified the mainstream understanding of this perspective. However, the scale construction of vertical connections easily separates the internal relationship between local and global connections and tends to be a static description. For this reason, a horizontal scale construction based on relations and networks has been proposed to understand scales (Kelly, 1999). It uses important places as nodes and relations as links to construct a three-dimensional networked scale system. The most typical representative of this system is the global production network (Coe et al., 2004). Scale reconstruction is the redistribution of power and control within the scale, including the bottom-up and top-down approaches. The superior subject defines the development boundary of the lower scale through control, disintegrate (scale down), and the lower scale establishes alliances to seek its own development (scale push), such as the European Union. Connections and elements drive each other, and flow is the intrinsic force between them. Rapid economic globalization and capital expansion have prompted cities to reorganize, and new subnational regional structures, such as urban agglomerations, have emerged, playing an increasingly important role in national development strategies. Scale reconstruction is a dynamic and constantly evolving process that supports research and advancement in regional and urban development.
We built a multi-scale network analysis framework (Figure 2) based on a multi-scale perspective. The framework proposed in this study is an attempt to embed the internal mechanism of the space of flows theory into the city network and develop a comprehensive multi-scale and multi-element coupling research framework that emphasizes the mutual construction of multi-scale city networks.
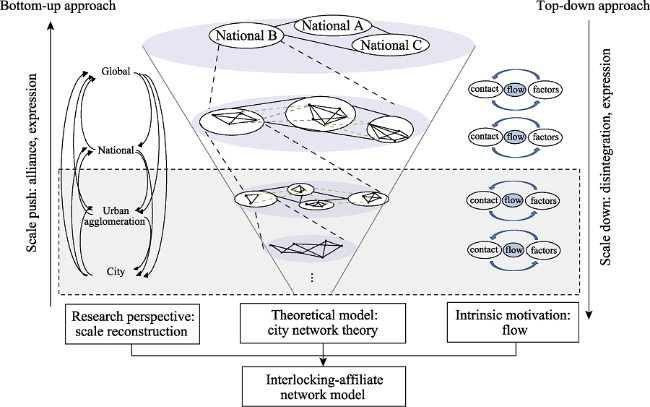
Figure 2 The multi-scale based city network research framework

3 Data source and methodology

3.1 Study area

Our analysis starts with 131 western Chinese cities at the prefectural level and above (Figure 3). By the end of 2018, the total population of this area was approximately 380 million, accounting for 27.2% of the total population. According to the “5 + 9 + 6” urban agglomeration pattern proposed by Fang (2015, 2019), the Chengdu-Chongqing urban agglomeration (state-level urban agglomeration), Guanzhong Plain urban agglomeration, Beibu Gulf urban agglomeration (regional medium-sized urban agglomerations), and Lanzhou-Xining urban agglomeration (regional urban agglomeration) are selected as typical urban agglomerations in western China (Figure 3).
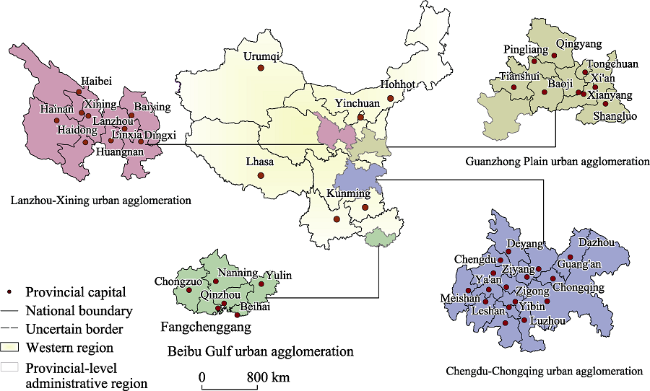
Figure 3 Geographical location of western China

3.2 Data source and processing

The data used in this study include enterprise, vector, socio-economic, and time distance datasets.
(1) Enterprise dataset: Information on China’s top 500 companies from 2005, 2010, and 2015 is available on Fortune’s Chinese website(http://www.fortunechina.com/), China Industry Information Network(http://www.chyxx.com/), China Economic Network(http://www.ce.cn/), and other official websites. The enterprise information includes the business registration information from the administration for industry and commerce and information about the branch of the enterprise, such as the enterprise name, address, type, and hierarchical level. The address of the enterprise is only collected for the level of cities at the prefecture-level and above (including the surrounding areas), and the cities below the prefecture-level are considered part of the prefecture-level cities. The top 500 enterprises in China, with branches in at least two cities, are selected. Based on enterprise relationships and service scope, the enterprise branches are divided into headquarters, regional headquarters, subsidiary, son of a subsidiary, great-grandson (joint venture/consortium), and great-great-grandson (offices, agents, supermarkets, stores, sales office, etc.). The six grades are ordinally assigned values from 6 to 1, respectively.
(2) Vector dataset: Including 1:100,000 vector administrative boundary data provided by the National Basic Geographic Information Center and boundary data of the four typical city agglomerations.
(3) Socio-economic dataset: The socio-economic data of each city are collected from the China City Statistical Yearbooks and Statistical Bulletins for 2005, 2010, and 2015. The neighborhood relationship of the economic system is determined using the audit and announcement data of Chinese development zones, with national development zones and provincial development zones or parks assigned values of 2 and 1, respectively.
(4) Time distance dataset: Characterized by the average travel time by highway and railway, the time distance by highway is the driving time between two municipal governments according to the Baidu map, and the time distance by railway is based on the travel time data of the railway 12306 ticket website. If there is a direct train between the cities, the time for the direct train is chosen; otherwise, the principle of the shortest time and shortest path is followed. There are no railway stations such as Tibet, Yunnan, and Xinjiang, so highway time data are used instead.

3.3 Methodology

3.3.1 City network model - Interlocking-affiliate network model
Based on the enterprise organizational chain, we adopted the interlocking-affiliate network model proposed by Yang (2019) to calculate intercity network connections. This model is constructed according to Taylor’s interlocking model (Taylor et al., 2001), Alderson’s headquarters-branch model (Alderson et al., 2004), and Li’s (Li et al., 2014) method of enterprise affiliation. The calculation for the interlocking-affiliate network model considers the connections among enterprises at different levels and the connections among enterprises at the same level. By calculating the assigned value and the number of branches of different grades, the information loss in the calculation process is minimized. The specific calculation model is as follows:
$\overline{C_{a b, i}}=\underset{R=1}{\mathop \sum }\,\underset{r=1}{\mathop \sum }\,{{V}_{ai\left( R \right)}}\times {{V}_{bi\left( r \right)}},R\ne r,R>r\ \ R,r\in [1,6]$
$\overline{C_{a b}}=\sum_{i=1}^{N} \overline{C_{a b, i}}$
$C_{a b}=\overline{C_{a b}}+\overline{C_{b a}}$
Where $\overline{C_{a b, i}}$ represents the connection of enterprise i from the city a to city b, ${{V}_{ai\left( R \right)}}$ and ${{V}_{bi\left( r \right)}}$ represent the service values of the branches of enterprise i in cities a and b, respectively. R and r are branch levels, $\overline{C_{a b}}$ is the connection intensity of all enterprises from the city a to city b, N is the number of enterprises, and ${{C}_{ab}}$ is the total connection intensity between cities a and b.
3.3.2 Defining and measuring network polycentricity
This study considers cities’ positions in city networks through a combination of degree centrality, out-degree/in-degree, betweenness centrality, and node symmetry analysis (Liu, 2009). The calculation formulae are presented in Table 1.
Table 1 Calculation formula of the decomposition index of centrality
Calculation formula Remarks
Degree centrality ${{C}_{a}}=\underset{b=1}{\overset{M}{\mathop \sum }}\,{{C}_{ab}}$ (4)
$C=\underset{a=1}{\overset{M}{\mathop \sum }}\,\underset{b=1}{\overset{M}{\mathop \sum }}\,{{C}_{ab}}$ (5)
${{\text{{C}'}}_{\text{a}}}=\frac{{{\text{C}}_{\text{a}}}}{\text{j}-1}$ (6)
${{C}_{a}}$ refers to the degree of node city a, ${{C}_{ab}}$ is the total connection intensity between city a and city b, $C$ is the total connection intensity of the whole network, and $M$is the number of cities. ${{{C}'}_{a}}$ is the relative centrality of node a, and $j-1$ is the maximum possible link.
Out-degree and in-degree $C_{a}^{out}=\underset{b=1}{\overset{M}{\mathop \sum }}\,~$ (7)
$C_{a}^{in}=\underset{b=1}{\overset{M}{\mathop \sum }}\,~$ (8)
$C_{a}^{O}=\frac{C_{a}^{out}}{j-1}$ (9)
$C_{a}^{I}=\frac{C_{a}^{in}}{j-1}$ (10)
$C_{a}^{out}$ is the point outdegree of city a, $\text{ }\!\!~\!\!\text{ }C_{a}^{in}$ is the point indegree of city a, $C_{a}^{o}$ and $C_{a}^{I}$ are, respectively, the relative point outdegree and relative point indegree of city a.
Betweenness centrality ${{C}_{B}}\left( {{N}_{i}} \right)=\underset{j<k}{\overset{M}{\mathop \sum }}\,~\frac{{{g}_{jk}}\left( {{n}_{i}} \right)}{{{g}_{jk}}}$ (11) The shortest path through point i that exists between points j and k is expressed in terms of gjk(ni). CB(Ni) is the probability that i is in the shortest path between points j and k.
Node symmetry $S{{M}_{a}}=\text{C}_{\text{a}}^{\text{o}}-\text{C}_{\text{a}}^{I}$(12)
$SM=1-\frac{1}{2}\underset{a}{\mathop \sum }\,\left| C_{a}^{o}-C_{a}^{I} \right|$ (13)
SMa represents node symmetry, SM represents overall network symmetry.

Note: When SMa is greater than 0, the city is defined as a dominant city; when SMa is less than 0, it is a subordinate city; when SMa is equal to 0, it is an equivalent city, the closer the SM is to 1, the higher the overall network symmetry. The closer the SM is to 0, the more asymmetrical the overall network node.

3.3.3 Multiple regression of quadratic assignment program (MRQAP)
The MRQAP is the preferred choice for studying these relationships. This method can well exclude false structural relations and is mostly used for testing some relational propositions. The MRQAP adopts a 1-module matrix (N × N matrix) (Broekel, 2014), and the relationship regression model of the city network was constructed to analyze the growth mechanism of city networks (Sheng, 2019). Based on relevant research (Song et al., 2018) and the actual situation in western China, the following indicators are selected from the aspects of economy, administration, and science and technology (Table 2). The model is as follows:
$Y={{a}_{0}}+{{a}_{1}}{{X}_{1}}+{{a}_{2}}{{X}_{2}}+\cdots +{{a}_{7}}{{X}_{7}}$
where Y is the dependent variable of the city network relationship matrix, a0 is a constant, and a1-a7 are the regression coefficients. X1-X7 are explanatory factor relation matrices.
Table 2 The influencing factors of city networks in western China and related theoretical hypotheses
Target layer Index layer Index meaning Theoretical hypothesis
Y: city
network
X1: Industrial structure similarity Using the industrial structure similarity model to describe the economic industrial relations based on data of secondary and tertiary industries A negative influence on city networks
X2: Economic development gap relationship Using the per capita GDP difference to construct the economic development gap A positive influence on city networks
X3: Administrative relationship According to the national standard of city administrative grade classification to divide the grades of cities A positive influence on city networks
X4: Economic system proximity According to industrial parks above the provincial level to calculate the intercity economic proximity A positive influence on city networks
X5: Average time distance relationship By the average time distance between highway and railway to construct the distance relation between two cities A negative influence on city networks
X6: Internet gap Taking the difference in the number of Internet users per 10,000 people between two cities to build the difference in Internet convenience A negative influence on city networks
X7: Science and technology gap Taking the difference of expenditure on scientific undertakings between two cities to construct the differential relationship of scientific and technological innovation A negative influence on city networks
3.3.4 Industrial structure similarity model
The industrial structure similarity coefficient constructed by the United Nations Industrial Development Organization (1980) reflects the isomorphism of the industrial structure. The calculation formula is as follows:
${{S}_{ij}}=\underset{n}{\mathop \sum }\,{{X}_{in}}{{X}_{jn}}/\sqrt{\underset{n}{\mathop \sum }\,X_{in}^{2}\underset{n}{\mathop \sum }\,X_{jn}^{2}}$
where i and j are two comparable regions, Sij is the structural similarity coefficient of region i and region j, and Xin (Xjn) is the proportion of n industries in the entire industry in region i (region j) in the whole industry. The value of Sij changes between 0 and 1; a larger value indicates greater isomorphism of the industrial structure between the two regions, while a smaller value indicates a lower level of isomorphism.

4 Results and analysis

4.1 Spatio-temporal evolution of regional-scale city networks

4.1.1 Connection intensity
To reduce data redundancy, we extract components in order of importance, defined as the proportion of variance in the matrix, excluding cities with a variance of less than 20%. Then, we use the natural breakpoint method to divide city centrality into three grades, and according to connection intensities greater than 10,000, 10,000-5000, and 5000-1000 between two cities, we divide the correlation intensity into three grades. From 2005 to 2015, the spatio-temporal characteristics of the city networks in western China show three characteristics (Figure 4):
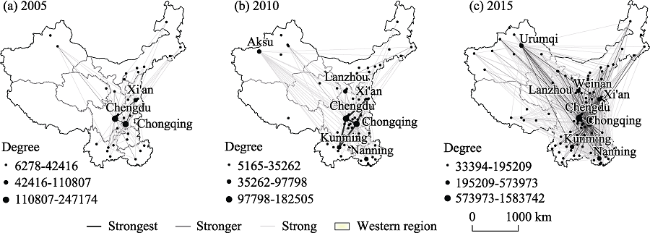
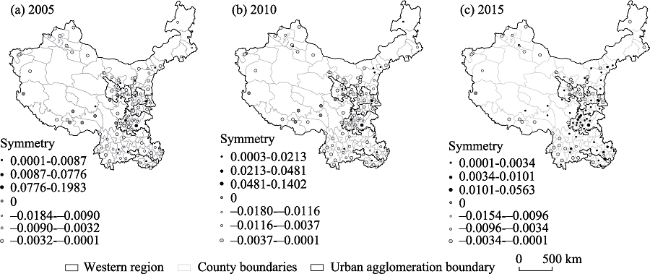
Figure 4 Spatial and temporal distribution of city networks in western China
(1) The hierarchical distribution is obvious, forming a diamond structure with Chengdu, Chongqing, Xi’an, and Kunming as the core. The core cities and other provincial capital cities are obviously stronger than other small cities, and the relationship among the large cities is stronger than the relationship between large and small cities. This shows an obvious preferred linkage.
(2) The adjacent diffusion effect is obvious, with Chengdu-Chongqing as the core, and the areas east of the Lanzhou-Chengdu-Kunming line form an obvious diffusion area. The major provincial capital cities, such as Chengdu, Chongqing, Xi’an, Nanning, and other high-grade cities, spread to the surrounding areas such as Chengdu-Chongqing, Beibu Gulf, and Guanzhong Plain urban agglomeration.
(3) The characteristics of trans-administrative regional connections are obvious, and the relationship between the core large cities is obviously stronger than that between other cities, and the relationship between the other cities and the core large cities is stronger than among the other cities. Moreover, the absolute superiority of core cities is gradually shared by other cities.
4.1.2 City networks centrality
The social network analysis tool (UCINET) is used to calculate the degree centrality, out-degree, in-degree, and betweenness centrality of the city network from 2005 to 2015 in western China (Figure 4).
(1) Degree: The city network hierarchy in western China is significant, with Chengdu, Chongqing, Xi’an, and Kunming consistently ranked at the top. The core position of Chengdu-Chongqing is significant, which is consistent with the results of Liu and Wu’s (2016) study on the multicenter structure of Chinese cities using economic data.
(2) Out-degree: The three core cities of Chengdu, Chongqing, and Xi’an were the core controllers in the city network. In 2005, 2010, and 2015, the out-degree of the three cities accounted for 62%, 41%, and 28% of the overall network, respectively. Although the proportion significantly reduces and the core control power decreases, these are still core cities in the overall network. The proportion of the top 20 cities decreases from 84% to 53%, indicating that the power of the city network presents a spatio-temporal process of great decentralization and a small concentration.
(3) Indegree: Chengdu, Chongqing, and Xi’an are the top three cities, forming a three-center structure. The degree of Chengdu first increases and then decreases, and the overall attraction decreases; Xi’an and Chongqing show an increasing trend, and Chongqing becomes the top city in 2015. The attraction of Chengdu is gradually dispersed, while Chongqing developed rapidly due to the increase in its attraction. From 2005 to 2015, the in-degree rate of the top 20 cities decreases from 59% to 47%, indicating a significant diffusion of attraction (prestige) on city networks.
(4) Betweenness: The centrality of city networks decreases, and the direct connection between cities strengthened. Xi’an, Chengdu, and Chongqing are consistently the top three cities, and the bridge effect is obvious. In 2015, the relative median value of each city is very small (0.001), and the role of bridges disappears.
In general, the centrality of cities in western China shows a trend of large dispersion and small agglomeration in terms of time and space. Chengdu, Chongqing, and Xi’an have the leading urban centrality, forming a three-core structure, indicating that the concentration of power is greater than the concentration of prestige. The betweenness of the western city network gradually decreases, and the direct connection is enhanced.
4.1.3 City networks symmetry
According to the node symmetry, we divide the cities into dominant cities (Co-Ci > 0), subordinate cities (Co-Ci < 0), and equivalent cities (Co-Ci = 0) (Table 3 and Figure 5).
Table 3 Urban node symmetry in western China (top 10)

2005 2010 2015
City Co-Ci City Co-Ci City Co-Ci
Dominant city Chongqing 0.1983 Chongqing 0.1402 Chongqing 0.0563
Xi’an 0.0776 Aksu 0.0898 Liuzhou 0.0101
Chengdu 0.0485 Xi’an 0.0481 Chengdu 0.0096
Wuhai 0.0267 Chengdu 0.0376 Hohhot 0.0071
Kunming 0.0087 Yibin 0.0213 Deyang 0.0068
Nanning 0.004 Kunming 0.0136 Xi’an 0.006
Hohhot 0.0033 Nanning 0.0092 Guilin 0.005
Bayingolin 0.0007 Urumqi 0.0081 Xianyang 0.0047
Yinchuan 0.0002 Ordos 0.0036 Mianyang 0.0044
Gannan 0.0002 Liuzhou 0.0012 Kunming 0.0044
Equivalent city Huangnan 0 Huangnan 0 Huangnan 0
Golog 0 Golog 0 Ngari 0
Ganzi 0 Yushu 0 Beihai 0
Changdu 0 Kizilsu 0
Nyingchi 0 Changdu 0
Shannan 0 Shannan 0
Nagqu 0 Nagqu 0
Ngari 0 Ngari 0
Bijie 0 Liupanshui 0
Bijie 0
Subordinate city Xianyang -0.0184 Hechi -0.018 Weinan -0.0154
Tongliao -0.0181 Guang’an -0.0171 Urumqi -0.013
Urumqi -0.0132 Hezhou -0.0116 Zhangye -0.0096
Guiyang -0.0121 Yuxi -0.0097 Laibin -0.0065
Lanzhou -0.0101 Nanchong -0.0083 Wuwei -0.0064
Nanchong -0.01 Wuhai -0.0081 Jiuquan -0.0062
Yuxi -0.0096 Tianshui -0.0078 Zunyi -0.0058
Deyang -0.009 Suining -0.0078 Qujing -0.0049
Qujing -0.0071 Guiyang -0.0075 Xining -0.0049
Xining -0.0071 Qujing -0.0072 Lanzhou -0.0044
Symmetry 0.63 0.63 0.75
Figure 5 Symmetry diagram of city networks in western China
The results of the symmetry analysis show that the overall symmetry of western China’s city network is high and on the rise. The number of dominant cities in the city network has increased significantly, being mainly distributed in the areas east of the Lanzhou- Chengdu-Kunming line. These areas are adjacent to the relatively developed regions in the east and are the driving forces of economic development in the west. The number of equivalent cities and subordinate cities decreased as a whole, indicating that the development of western cities presents a trend of export-oriented economic development, and there is large development potential.
Table 3 displays that: (1) The dominant cities are mainly provincial capitals and other prefecture-level cities with better economic development, and they experienced a significant increase in the number, being from 10 to 53. Chongqing, Xi’an, Chengdu, and Kunming are the dominant cities, and the gap between attraction and control decreases. (2) The symmetry is weakened. The number of equivalent cities is mainly composed of cities on the western periphery of China with a low out-degree and low in-degree, and their number decreases each year. (3) The number of subordinate cities, including general provincial capitals and other prefecture-level cities, occupies a large proportion in the city network of western China and has been decreasing each year from 81% to 57%.
The overall symmetry values of network nodes in western China are all greater than 0.5, showing an overall increasing trend, which indicates that the city network structure in western China has a good symmetry and a balanced development.

4.2 Spatio-temporal evolution of city networks on urban agglomeration scale

The relationship intensity between the four typical urban agglomerations is obtained by superpositioning the contact intensity between cities (Table 4). Contact intensity was divided into grades 1, 2, and 3 using the natural breakpoint method. They are represented in the figure by the red, blue, and black arrows, respectively (Figure 6).
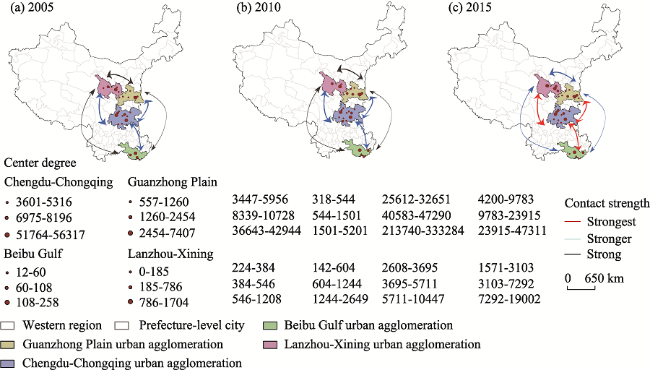
Table 4 Network contact among urban agglomerations in western China
Urban agglomerations 1 Urban agglomerations 2 2005 2010 2015
Lanzhou-Xining Chengdu-Chongqing 33728 27610 210694
Lanzhou-Xining Guanzhong Plain 8272 8629 67382
Lanzhou-Xining Beibu Gulf 1937 4271 35036
Chengdu-Chongqing Guanzhong Plain 79017 59175 428342
Chengdu-Chongqing Beibu Gulf 28025 27852 212851
Guanzhong Plain Beibu Gulf 5909 7711 67043
Figure 6 Spatial and temporal distribution of the network among urban agglomerations in western China
The network connections between urban agglomerations in western China present the spatio-temporal characteristics of centralization, stratification, and geographical proximity.
(1) Network centralization among urban agglomerations. Chengdu-Chongqing urban agglomeration is the center (Figure 6). The relationship between the Chengdu-Chongqing urban agglomeration and the others is strong. The contact intensity at all levels increased, reflecting a strong attraction and obvious characteristic of network concentration.
(2) There is obvious stratification of the networks among urban agglomerations. The strength of ties between Chengdu-Chongqing and Guanzhong Plain is always on the top rank, and the ties between Beibu Gulf and Lanzhou-Xining are the weakest. In 2005, 2010, and 2015, the strongest associations are 40.79, 13.86, and 12.23 times as strong as the weakest.
(3) The network connections between urban agglomerations show geographical proximity. The Lanzhou-Xining urban agglomeration is geographically closer to the Chengdu- Chongqing urban agglomeration, so the relationship between Chengdu and Lanzhou-Xining is stronger than that between Chengdu and the Beibu Gulf. The Guanzhong Plain urban agglomeration and Beibu Gulf urban agglomeration are both medium-sized regional urban agglomerations, but the relationship between Guanzhong Plain and Chongqing is stronger than that between the Beibu Gulf and Chongqing. This shows that geographical proximity has a positive role in promoting connections between urban agglomerations.

4.3 Spatio-temporal evolution of city networks within urban agglomerations

Figure 7 shows that the characteristics of the internal network structure of the four typical urban agglomerations in western China are quite different, showing the dual-core mode, single- core mode, multicenter mode, etc. As the urban agglomeration grew and matured and the connection between the core cities and the surrounding cities at all levels strengthened, the links between well-developed sub-cities also strengthened.
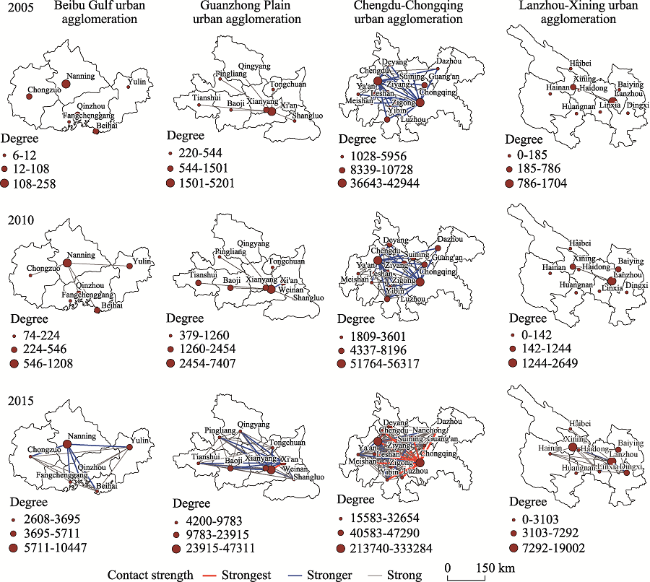
Figure 7 Spatial and temporal distribution of the inner network of city agglomerations in western China
The city networks in the Beibu Gulf urban agglomerations are weak, and Nanning is the core city. The city network gradually evolves from a single-center radial structure to a single-center network structure, and the city network has obvious characteristics of connection and agglomeration.
The core city of the Guanzhong Plain urban agglomeration is Xi’an, and the network structure tends to be complex, evolving from a single center to a multicenter network structure. The intensity and density of city network connections increased significantly. The contact intensity of Xi’an and Xianyang increased to the first level, and the degree centrality of Baoji and Weinan increased as they became sub-core centers. The dispersion effect is obvious, and the balance of the city network increased. However, it still showed a trend of concentration.
A dual-core network structure is in the Chengdu-Chongqing urban agglomeration. Chengdu and Chongqing are the centers, and the network structure inclines toward perfection. As two major hub cities, Chengdu and Chongqing accounted for 55.93%, 65.66%, and 57.6% of the connections in the whole urban agglomeration in 2005, 2010, and 2015, respectively, showing a significant trend of centralization in the city networks. The links between other cities and hub cities are increasing. Chongqing and its neighboring cities represent mostly first-level links, accounting for 87.5% of the total first-level links, while Chengdu and its neighboring cities represent mostly second-level links, accounting for 85.7% of the total second-level links. The overall network links are dense and complex.
With Lanzhou and Xining as the core cities, the network is incomplete, and the network equilibrium is increased. The overall connection and development level of the network is lower than that of other urban agglomerations, having great potential for development.
Overall, small and medium-sized cities in western China's urban agglomerations develop slowly and lack the ability to fully utilize network resources but benefit more from large regional networks. The city networks of these urban agglomerations are driven by the core cities that promote economic development within the agglomerations. The main network connection is between provincial capitals and their surrounding cities, and all urban agglomerations show obvious core-periphery structural characteristics.

4.4 The growth mechanism of city networks

The development of city networks in western China is influenced by many factors. From the perspective of the spatial correlation of comprehensive strength among cities and with the help of the MRQAP, we construct a regression model by applying relational data regarding the economy, administration, time distance, internet, and science and technology gaps among cities and city network relational data. Thus, we analyze the growth mechanism of the overall city network. The nonparametric test was also performed to avoid the problem of multicollinearity.
According to the regression results in Table 5, the seven matrices in the model for 2010 can explain 37% of the variance of the city network, and 48% of the variance of the city network can be explained in the model for 2015. This has explanatory significance. In 2010 and 2015, excluding the similarity of industrial structures that did not pass the significance test of 10%, the other relational matrices are significantly correlated with the city network. Among them, the administrative relationship, internet development gap, and science and technology investment gap significantly influence the city network.
Table 5 Regression results of influencing factors of the city network in western China
Influencing factor Regression coefficient
2010 2015
Industrial structure similarity
Economic development gap relationship
-0.0003
-0.0254*
0.0101
-0.0230*
Administrative relation 0.6998*** 0.6709***
Economic systems proximity -0.0850* 0.0908**
Average time distance relationship -0.0499** -0.0333*
Internet gap relationship -0.1394*** -0.1649***
Science and technology gap relationship -0.0812*** -0.0740***
R2 0.37 0.48

Note: * p < 0.1; ** p < 0.05; *** p < 0.01

The city network has a significant positive correlation with the administrative relationship. The correlation coefficient is high, which means that administrative subordination has an important impact on urban development. The higher the administrative level, the greater the political rights, the more convenient the political resources, and the better the access to relevant policy information (Defever, 2006). This provides a favorable investment and development environment for many enterprises, improves the city's status in the city network, and conforms to the theoretical hypothesis. The relationship of economic systems proximity is negatively related to the city network correlation beginning in 2010 and present a significant positive correlation in 2015, suggesting that the connection has been strengthened with the continuous narrowing of the scale gap of industrial parks between cities. As the size of the industrial park increases, enterprises need to coordinate development to promote industrial cooperation among cities, conforming to the theoretical hypothesis.
The internet development gap, technology investment gap, average time distance, and economic development gap have significant negative correlations with the city network. Network resources and knowledge capital enhance labor productivity (Li et al., 2015). A larger gap between internet development and science and technology investment shows that the more unbalanced the labor efficiency, the more cities in city networks tend to cooperate with high production efficiency. The distance decay law between the time distance and city network connection is applicable here. Geographical distance clearly obstructs the development of city networks (Duan et al., 2018). The rapid development of modern transportation has expanded the spatial distance of connections and reduced the time and financial costs of economic activity (Harvey, 1990). The higher the accessibility, the more significant the improvement in city network rights and status. The more significant the gap in regional economic development levels, the more unfavorable the environment for intercity connectivity, which, to some extent, limits regional development.

5 Discussion and conclusions

The globalization of the economy and the informatization process realize and accelerate the cross-regional flow of economic factors, promote the evolution of the spatial organization of enterprises, and form a multilocation and multisector enterprise spatial connection network. Affected by the regional development background and development stage, different cities with different economic situations benefit differently from the network. Based on exploring the internal connections between enterprise and city networks, this study constructs a theoretical framework and mathematically analyzes the city network based on enterprise networks. This study also constructs a multi-scale city network analysis framework and takes cities in western China as an empirical research object. Furthermore, the spatio-temporal evolution characteristics of city networks in western China are explored considering the three spatial scales of large regions: western China, urban clusters, and inner urban agglomerations. Based on the MRQAP, a relationship regression model is constructed to explore the growth and development mechanism of city networks and provide support for the formulation of urban development strategies. The main conclusions are as follows:
(1) On a regional scale in western China, the city networks show the following characteristics: 1) The hierarchical diffusion effect is significant, with Chengdu, Chongqing, Xi’an, and Kunming as the core cities, forming a four-core rhombus structure; 2) the adjacent diffusion effect is obvious, with the area east of the Lanzhou-Chengdu-Kunming line forming an obvious diffusion area; and 3) the characteristics of cross-administrative regional connections are obvious. Overall, the network structure tends to be dispersed and balanced with good symmetry, and the “core-periphery” spatial structure pattern is presented.
(2) Under the scale of urban agglomeration, the network of urban agglomeration has the characteristics of centralization, stratification, and geographical proximity. The Chengdu- Chongqing urban agglomeration has obvious geographical advantages and a good economic base. It holds the central position connecting the other urban agglomerations and can dominate and utilize network resources.
(3) The characteristics of the internal network structure of the urban agglomeration are quite different, showing the dual-core, single-core, and multicenter modes. The Chengdu- Chongqing urban agglomeration presents a dual-core network structure; the Beibu Gulf urban agglomeration has gradually evolved from a single-center radial structure to a single-center network structure; the Guanzhong Plain urban agglomeration has evolved from a single-center network structure to a multicenter network structure; the Lanzhou-Xining urban agglomeration has a dual-core structure. The urban agglomeration city network is evolving from a hierarchical system to a network system.
(4) The study of city network growth mechanisms shows that administrative subordinate relationships and economic system proximity have a significant positive influence on city networks in western China. In contrast, differences in internet convenience, science and technology input gaps, average time distances, and economic development gaps have a significant negative influence on city network growth and development. The preferential attachment is an important internal force for the development of city networks.
Industrial isomorphism has no significant influence on enterprise connections in the western region. In the context of the fast flow of factors of production, the proximity effect of time distance is increasing. Cities with large economic scales, rich political resources, network accessibility, and higher investment rates of science and technology show stronger competitiveness and have obvious advantages of preferential connection.
China is a developing country. China’s western region is less developed, and it is also the key region for the Belt and Road Initiative. Therefore, studying the western region is of great significance in narrowing the differences between the east and the west of the country and contributing to the sustainable socio-economic development of the entire country. To some extent, the perfection of the urban network in western China reflects the strategic significance of China’s western development. The study of the western city network fills the gap between the global network and the less developed regions of developing countries. The historical pattern deeply affects the development trend of the enterprise network in the whole western region. A few cities with good economic foundations play an important role, exerting strong control and attraction. In contrast, many periphery node cities are not sufficiently present in the whole network competition. Over time, the network connection tends to become more complex. It involves the participation of an increasing number of cities. However, it still presents a network relationship where the strong becomes stronger while the weak becomes weaker. The agglomeration economy has an obvious influence on the differentiation of the network space, and strengthening the network status of the dominant cities is an important form of the agglomeration economy. The development of the city network tends towards a multicore network structure, driving the joint development of small and medium-sized cities. It integrates isolated cities into the overall network development, gradually reducing regional development differences and improving economic development efficiency and social equity. Second, there are many aspects to be improved in this study’s city networks; for example, the topological analysis of city networks is not discussed in-depth, and scale construction needs to be improved. In the exploration of the growth mechanism, not every scale is considered in detail. As a complex, giant system, the city network has many influencing factors, some of which are difficult to fully consider in relational data. In addition, while intra-firm linkages cannot fully reflect inter-city connections in the real world, inter-firm linkages are important in modern society. Subsequent studies will consider more inter-firm studies. Future efforts may consider logistics networks, transportation networks, and innovation networks in the research of city networks to study the coupling of multiple networks and the growth mechanism.
[1]
Akhavan M, Ghiara H, Mariotti I et al., 2020. Logistics global network connectivity and its determinants. A European city network analysis. Journal of Transport Geography, 82: 102624.

DOI

[2]
Alderson A S, Beckfield J, 2004. Power and position in the world city system. American Journal of Sociology, 109(4): 811-851.

DOI

[3]
Ashkezari-Toussi S, Kamel M, Sadoghi-Yazdi H, 2019. Emotional maps based on social networks data to analyze cities emotional structure and measure their emotional similarity. Cities, 86: 113-124.

DOI

[4]
Berry B J L, 1964. Cities as systems within systems of cities. Papers in Regional Science, 13(1): 147-163.

DOI

[5]
Broekel T, Balland P A, Burger M et al., 2014. Modeling knowledge networks in economic geography: A discussion of four methods. The Annals of Regional Science, 53(2): 423-452.

DOI

[6]
Cao G, Derudder B, Peng Z W, 2018. Comparing the physical, functional and knowledge integration of the Yangtze River Delta city-region through the lens of inter-city networks. Cities, 82: 119-126.

DOI

[7]
Castells M, 1996. The Rise of the Network Society. Cambridge, MA: Blackwell.

[8]
Castells M, 2007. Centrality in the space of flows. Built Environment, 33(4): 482-485.

DOI

[9]
Cervero R, Wu K L, 1998. Sub-centring and commuting: Evidence from the San Francisco Bay Area, 1980-90. Urban Studies, 35(7): 1059-1076.

DOI

[10]
Chong Z, Pan S, 2020. Understanding the structure and determinants of city network through intra-firm service relationships: The case of Guangdong-Hong Kong-Macao Greater Bay Area. Cities, 103: 102738.

DOI

[11]
Coe N M, Hess M, Yeung H W C et al., 2004. 'Globalizing' regional development: A global production networks perspective. Transactions of the Institute of British Geographers, 29(4): 468-484.

DOI

[12]
Defever F, 2006. Functional fragmentation and the location of multinational firms in the enlarged Europe. Regional Science and Urban Economics, 36(5): 658-677.

DOI

[13]
Derudder B, 2006. On conceptual confusion in empirical analyses of a transnational urban network. Urban Studies, 43(11): 2027-2046.

DOI

[14]
Derudder B, Witlox F, 2005. On the use of inadequate airline data in mappings of a global urban system. Journal of Air Transport Management, 11(4): 231-237.

DOI

[15]
Duan D Z, Du D B, Chen Y et al., 2018. Spatial-temporal complexity and growth mechanism of city innovation network in China. Scientia Geographica Sinica, 38(11): 1759-1768. (in Chinese)

[16]
Fang C L, 2015. Important progress and future direction of studies on China’s urban agglomerations. Journal of Geographical Sciences, 25(8): 1003-1024.

DOI

[17]
Fang C L, 2019. The basic law of the formation and expansion in urban agglomerations. Journal of Geographical Sciences, 29(10): 1699-1712.

DOI

[18]
Harvey D, 1990. Between space and time: Reflections on the geographical imagination. Annals of the Association of American Geographers, 80(3): 418-434.

DOI

[19]
Hu X Q, Wang C, Wu J J et al., 2020. Understanding interurban networks from a multiplexity perspective. Cities, 99: 102625.

DOI

[20]
Kang J J, Xu W, Yu L, Ning Y M, 2020. Localization, urbanization and globalization: Dynamic manufacturing specialization in the YRD mega-city conglomeration. Cities, 99: 102641.

DOI

[21]
Kelly P F, 1999. The geographies and politics of globalization. Progress in Human Geography, 23(3): 379-400.

DOI

[22]
Leng B R, Yang Y C, Li Y J et al., 2011. Spatial characteristics and complex analysis: A perspective from basic activities of urban networks in China. Acta Geographica Sinica, 66(2): 199-211. (in Chinese)

[23]
Li D D, Wang T, Wei Y H et al., 2015. Spatial and temporal complexity of scientific knowledge network and technological knowledge network on China’s urban scale. Geographical Research, 34(10): 525-540. (in Chinese)

[24]
Li J, Dong S C, Huang Y B et al., 2014. Multi-scale spatial structure analysis of urban network based on local IT enterprise network in China. Geography and Geo-Information Science, 30(1): 110-115. (in Chinese)

[25]
Li X D, 2012. Research of urban network based on firm network. Shanghai: East China Normal University, (in Chinese)

[26]
Li X D, 2014. Spatial structure of the Yangtze River Delta urban network based on the pattern of listed companies network. Progress in Geography, 33(12): 1587-1600. (in Chinese)

[27]
Li X D, 2015. Structure and Evolution of Urban Network. Beijing: Science and Technology Press. (in Chinese)

[28]
Li Y, Monzur T, 2018. The spatial structure of employment in the metropolitan region of Tokyo: A scale-view. Urban Geography, 39(2): 236-262.

DOI

[29]
Li Y C, 2019. A preliminary analysis on urban innovation network of metropolitan region and its characteristics. Planning Studies, 43(6): 27-33, 39. (in Chinese)

[30]
Liu J, 2009. Lecture on Whole Network Approach:A Practical Guide to UCINET. Shanghai: Truth and Wisdom Press. (in Chinese)

[31]
Liu X, Derudder B, 2013. Analyzing urban networks through the lens of corporate networks: A critical review. Cities, 31: 430-437.

DOI

[32]
Liu X, Derudder B, Wu K, 2016. Measuring polycentric urban development in China: An intercity transportation network perspective. Regional Studies, 50(8): 1302-1315.

DOI

[33]
Ma H T, Fang C L, 2011. Spatial organization of production networks in city-region based on enterprises relationship: A case of apparel production in urban agglomeration of eastern Guangdong Province. Scientia Geographica Sinica, 31(10): 1172-1180. (in Chinese)

[34]
Matthiessen C W, Schwarz A W, Find S, 2010. World cities of scientific knowledge: systems, networks and potential dynamics. an analysis based on bibliometric indicators. Urban Studies, 47(9): 1879-1897.

DOI

[35]
Pan F H, Bi W K, Lenzer J, Zhao S, 2017. Mapping urban networks through inter-firm service relationships: The case of China. Urban Studies, 54 (12): 3639-3654.

DOI

[36]
Ren Y, Chen X M, 2009. The Ere of Global City-regions. Shanghai, China: Shanghai Fudan University Press. (in Chinese)

[37]
Rozenblat C, 2010. Opening the black box of agglomeration economies for measuring cities’ competitiveness through international firm networks. Urban Studies, 47(13): 2841-2865.

DOI

[38]
Sheng K R, Wang Y J, Fan J, 2019. Dynamics and mechanisms of the spatial structure of urban network in China: A study based on the corporate networks of top 500 public companies. Economic Geography, 39(11): 84-93. (in Chinese)

DOI

[39]
Sheng K R, Zhang H X, Lv D D, 2018. Progress and prospect of urban networks research through the lens of corporate networks. Human Geography, 33(2): 11-18. (in Chinese)

[40]
Sheng K R, Zhang J, Zhang H X, 2020. Network embedding and urban economic growth in China: A study based on the corporate networks of top 500 public companies. Acta Geographica Sinica, 75(10): 1-17. (in Chinese)

[41]
Smith M P, 2000. Transnational Urbanism: Locating Globalization. Malden, MA: Wiley-Blackwell.

[42]
Song Q, Zhao X Z, Li T S et al., 2018. Spatial structures and influencing factors of multiple urban networks based on the perspective of directed-multivalued relation. Progress in Geography, 37(9): 1257-1267. (in Chinese)

[43]
Sun T, Lv Y Q, 2020. Employment centers and polycentric spatial development in Chinese cities: A multi-scale analysis. Cities, 99: 102617.

[44]
Sun Z W, Lu Z, He J L, 2009. Research on spatial pattern and organization mechanism of international internet information flows. Human Geography, 24(4): 43-49. (in Chinese)

[45]
Taylor P J, 1982. A materialist framework for political geography. Transactions of the Institute of British Geographers, 7(1): 15-34.

DOI

[46]
Taylor P J, 2001. Urban hinterworlds: Geographies of corporate service provision under conditions of contemporary globalisation. Geography, 86(1): 51-60.

[47]
Taylor P J, 2005. Leading world cities: Empirical evaluations of urban nodes in multiple networks. Urban Studies, 42(9): 1593-1608.

DOI

[48]
Taylor P J, Catalano G, Walker D R F, 2002. Measurement of the world city network. Urban Studies, 39(13): 2367-2376.

DOI

[49]
Wang L, Duan X, 2018. High-speed rail network development and winner and loser cities in megaregions: The case study of Yangtze River Delta, China. Cities, 83: 71-82.

DOI

[50]
Wei Y, Song W, Xiu C L et al., 2018. The rich-club phenomenon of China’s population flow network during the country’s spring festival. Applied Geography, 96: 77-85.

DOI

[51]
Xu J, Zhang M, Zhang X L et al., 2019. How does city-cluster high-speed rail facilitate regional integration? Evidence from the Shanghai-Nanjing corridor. Cities, 85: 83-97.

DOI

[52]
Yang L J, Yang Y C, Pan J H, 2019. Network structure evolution and the spatial-temporal pattern of China western cities participating in global and national competition. Economic Geography, 39(10): 43-53. (in Chinese)

[53]
Yeh A G O, Yang F F, Wang J J, 2015. Producer service linkages and city connectivity in the mega-city region of China: A case study of the Pearl River Delta. Urban Studies, 52(13): 2458-2482.

DOI

[54]
Yuan H L, Xin N, 2019. Global trade network pattern and influencing factors of advanced manufacturing in China. Economic geography, 39(6): 108-117. (in Chinese)

[55]
Zhao M X, Li Z F, Zhong Y et al., 2016. Polycentric network topology of urban agglomerations in China. Progress in Geography, 35(3): 376-388. (in Chinese)

[56]
Zhao X Z, Li Q P, Rui S et al., 2019. The characteristics of urban network of China: A study based on the Chinese companies in the fortune global 500 list. Acta Geographica Sinica, 74(4): 694-709. (in Chinese)

[57]
Zhen F, Wang B, Chen Y X, 2012. China’s city network characteristics based on social network space: An empirical analysis of Sina Micro-Blog. Acta Geographica Sinica, 67(8): 1031-1043. (in Chinese)

[58]
Zhou Z H, 2006. Logistic relation of globalization, global urban network and global cities. Journal of Social Sciences, (10): 17-26. (in Chinese)

Options
Outlines

/