Research Articles

The poverty evolution of typical countries along the Belt and Road and implications from China’s poverty reduction experiences

  • SHI Linna , 1, 2 ,
  • WANG Yongsheng 1 ,
  • LIU Yansui , 1, 2, * ,
  • LI Yuheng 1, 2
Expand
  • 1. Key Laboratory of Regional Sustainable Development Modeling, Institute of Geographic Sciences and Natural Resources Research, CAS, Beijing 100101, China
  • 2. College of Resources and Environment, University of Chinese Academy of Sciences, Beijing 100190, China
* Liu Yansui (1965-), Professor, specialized in human-earth science and rural sustainability. E-mail:

Shi Linna (1991-), PhD Candidate, specialized in urban-rural Integration and rural poverty alleviation. E-mail:

Received date: 2021-07-15

  Accepted date: 2021-12-20

  Online published: 2022-05-25

Supported by

National Natural Science Foundation of China(41931293)

Abstract

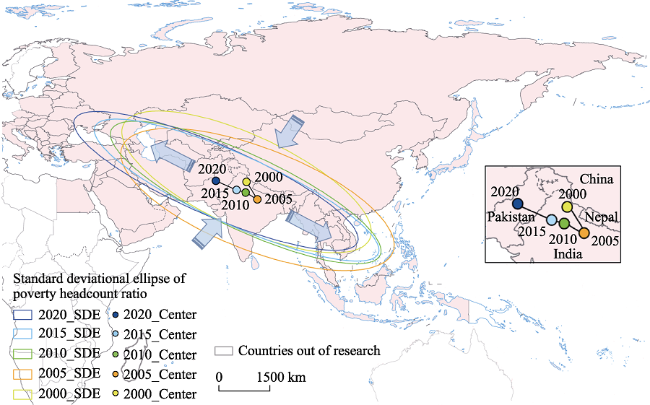
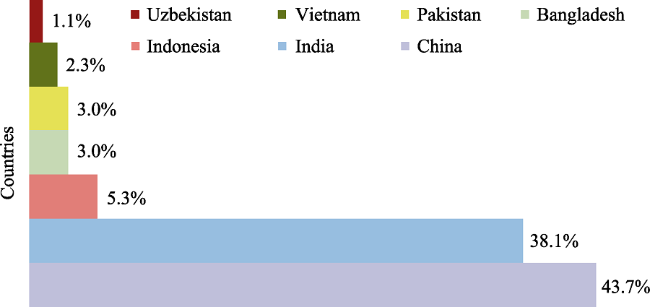
The world is facing a poverty crisis. Despite the great achievements that have been made in poverty alleviation over the past two decades, the extent of poverty in countries along the Belt and Road is still high. Successful poverty reduction in these countries is crucial to meeting the 2030 SDGs. Improving governance to eradicate poverty is a shortcoming that needs to be addressed urgently in poverty reduction pathways along the Belt and Road. In this study, the Standard Deviational Ellipse method was used to study the spatial trajectory of the poverty gravity center. Results showed that the poverty gravity center moved from east to west by 87.60 km annually, while the poverty population decreased by 1211.14 million along the Belt and Road from 2000 to 2020. In addition, the trajectory of the center has shifted due to the different effects of poverty reduction. Among the countries situated along the Belt and Road, China is the most significant contributor to poverty reduction. Accordingly, this study examined the implications of China’s successful poverty reduction strategies in order to understand how other countries can effectively respond to poverty. Ultimately, we propose that sustainable poverty alleviation development strategies should be established with the objectives of promoting social equity and improving the wellbeing of all people.

Cite this article

SHI Linna , WANG Yongsheng , LIU Yansui , LI Yuheng . The poverty evolution of typical countries along the Belt and Road and implications from China’s poverty reduction experiences[J]. Journal of Geographical Sciences, 2022 , 32(3) : 458 -476 . DOI: 10.1007/s11442-022-1953-1

1 Introduction

Poverty eradication is the first objective among the 17 Sustainable Development Goals (SDGs) proposed by the United Nations (Tollefson, 2015). Eliminating poverty across the world has always been a challenge (Glauben et al., 2012; Manish, 2012). The extreme poverty standard has been set at 1.90 USD per day by the World Bank and is acknowledged as the world poverty line. Individuals who face extreme poverty have difficulty surviving, and there were 742 million people living below the extreme poverty line in 2020(https://worldpoverty.io/headline). At its worst, this level of poverty can result in hunger to the extent of starvation as well as inadequate shelter, housing, or clothing. Countries across the world have different degrees of poverty, and extreme poverty is still common in many Third World countries in Africa and Asia (Bicaba et al., 2017). Consequently, conducting research that allows us to better assess the poverty reduction strategies in these regions is an important step towards achieving the 2030 SDGs. As the world has continued to grapple with issues of poverty, human-earth system science has emerged as an important area of study (Liu, 2020). Human-earth system science is the intersection of modern geographic science and earth system science, and it studies the coupling mechanism, evolution process, and complex interaction effect of the human-earth system. Under the guidance of the human-earth system, it is necessary to consider the coordination between the human-earth system and regional sustainable developments in different countries (Liu, 2020). Consequently, this approach encourages us to focus on poverty reduction mechanisms and find sustainable paths.
China launched the Silk Road Economic Belt and 21st Century Maritime Silk Road initiatives (the Belt and Road Initiative) in 2013 to safeguard the open world economic system (Liu, 2015). The Belt and Road Initiative takes the Eurasian developing countries that are located along the ancient silk road as key cooperation areas to build an open platform for international and regional economic cooperation (Liu and Dunford, 2016; Andornino, 2017; Mahmud Titumir and Zahidur Rahman, 2019). The initiative aims to provide more effective poverty alleviation paths for eligible countries and move 7.6 million people out of extreme poverty (SCIO, 2021). Our study found that, as of 2020, the poverty population in the countries along the Belt and Road had accounted for nearly 8.9% of the world’s poverty. The success of poverty reduction along the Belt and Road is thus connected to the realization of the global zero poverty goal established by the United Nations.
Because they face diverse national conditions and stages of development, countries located along the Belt and Road have adopted different poverty reduction criteria, methods, and approaches. Consequently, these countries have witnessed a decrease in poverty, but to varying extents. The evolution of poverty degree is primarily determined by two types of measures: single income poverty and its derivative measure method (Dang and Lanjouw, 2018; Ren et al., 2018; Purwono et al., 2021), the Multidimensional Poverty Index (Alkire and Santos, 2014). Several studies have analyzed poverty reduction experiences that have taken place in countries along the Belt and Road. For example, Bangladesh, China, and Vietnam have witnessed a notable level of poverty reduction and achieved remarkable results (Ravallion and Chen, 2004; Chen, 2018; Binh and Ha, 2019). Multiple measures to reduce poverty were implemented in these countries, including improving the development level of poverty-stricken areas by supporting the growth of local industries, restoring rural “hematopoietic function” (Sharma et al., 2021), and instituting ecological poverty reduction measures aimed at sustainable development (Liang et al., 2017; Liu and Wang, 2019; Zhou et al., 2019). However, the nature of poverty reduction strategies has changed as these types of efforts have transitioned from the realm of folk charity to government institutions and, finally, to an extended collaborative governance model that exists between the government, businesses, and non-profit organizations (Hipsher, 2013). In other words, poverty reduction strategies have taken on different shapes as countries have moved from a relief model to a development model and, finally, to a participatory model (Chen, 2018).
Countries have used large-scale and high-intensity economic stimulus, investment, and import-export trade to foster economic growth, but the marginal effect of these models has gradually decreased. Meanwhile, the COVID-19 pandemic and economic suspension caused a world-wide recession in advanced economies, emerging markets, and developing economies, which crippled the global poverty reduction process (Fernandes, 2020; World Bank, 2020b). The World Bank has stated that poverty reduction and development strategies urgently need to promote the opening of advanced economies (World Bank, 2020a). Updating national poverty reduction strategies is essential, but existing research that focuses on the countries along the Belt and Road lacks horizontal comparison. The characteristics of poverty evolution and experiences of effective reduction in the countries along the Belt and Road thus remain unclear.
In this context, clarifying the characteristics of poverty evolution and effective experiences of Belt and Road countries can promote poverty reduction and human well-being. Previous research used case studies that took place on national or smaller scales to analyze poverty reduction experiences and thus do not provide a holistic analysis of the Belt and Road, quantitative poverty reduction contributions within the region, or China’s strategies. China, in particular, is an important focus of study because it was able to eradicate extreme poverty, and some countries have already tried to learn from its poverty reduction experiences (Ravallion, 2011; Zhang, 2019). Moreover, China’s eradication of extreme poverty was a significant step towards the fulfillment of the SDGs. The implications of China’s poverty reduction experiences thus need to be emphasized.
The International Poverty Reduction Center in China was established in 2005 to lead China’s international exchange in poverty reduction. Since the 1990s, some popular topics that have been discussed by scholars include the so-called China miracle, China phenomenon, China experience, China path, and China model (Hang and Qin, 2015; Jiang and Zhang, 2016; Liu and Xu, 2016). Most literature on this topic has been written in Chinese, however, and it was not until 2019 that studies about China’s practical experiences were published in English (Zuo, 2019). Our study aims to contribute to this critical discussion by exploring the poverty evolution of the Belt and Road region and promoting the poverty reduction pathway through the experiences of China. Our research also provides valuable insights that could help promote the Belt and Road Initiative.
Specifically, the core objectives of this study are as follows: 1) identify the overall poverty evolution process of typical countries located along the Belt and Road; 2) clarify the contribution that each country has made to the poverty gravity center movement; 3) analyze the challenges of poverty reduction in typical countries along the Belt and Road, and explore the implications of poverty reduction from the perspective of China.

2 Materials and methods

2.1 Site description and data sources

The Belt and Road Initiative is open and inclusive international regional economic cooperation networks. Their spatial ranges are not fully defined, and countries that wish to be part of them are free to join (Liu, 2015). Distinct climate conditions, social ideologies, cultures, customs, and habits resulted in the emergence of different poverty reduction challenges in these countries. Based on the “Vision and Actions on Jointly Building the Silk Road Economic Belt and 21st Century Maritime Silk Road” statement released by the Chinese government in 2015, this paper identifies 65 Belt and Road countries (Table 1) according to the basic data column provided on the Belt and Road website(https://www.yidaiyilu.gov.cn/jcsjpc.htm). Data about poverty populations was collected from the World Bank and the United Nations’ Sustainable Development Solutions Network. In particular, the data from 2010 to 2020 was collected from the 2020 Sustainable Development Report (Sachs et al., 2020) and the World Bank’s reports on poverty(https://www.worldbank.org/en/topic/poverty). The adjacent interpolation method was used to fill in missing data. The maps used in this study were collected from the Resource Environment Science and Data Center(https://www.resdc.cn) and the Standard Map Service website(http://bzdt.ch.mnr.gov.cn/index.html).
Table 1 Major countries in the Belt and Road region
Name of region Countries within the region No. of countries
China-Mongolia-Russia China, Mongolia, Russia 3
Southeast Asia Singapore, Indonesia, Malaysia, Thailand, Vietnam, Philippines, Cambodia, Myanmar, Laos, Brunei, East Timor 11
South Asia India, Pakistan, Sri Lanka, Bangladesh, Nepal, Maldives, Bhutan, 7
West Asia and North Africa United Arab Emirates, Kuwait, Turkey, Qatar, Oman, Lebanon, Saudi Arabia, Bahrain, Israel, Yemen, Egypt, Iran, Jordan, Syria, Iraq, Afghanistan, Palestine, Azerbaijan, Georgia, Armenia 20
Central and Eastern Europe Poland, Albania, Estonia, Lithuania, Slovenia, Bulgaria, Czech Republic, Hungary, Northern Macedonia, Serbia, Romania, Slovakia, Croatia, Latvia, Bosnia and Herzegovina, Montenegro, Ukraine, Belarus, Moldova 19
Central Asia Kazakhstan, Kyrgyzstan, Turkmenistan, Tajikistan, Uzbekistan 5

2.2 The spatio-temporal evolution of poverty

2.2.1 Poverty gravity center detection
The extreme poverty headcount ratio standard of living was created by the World Bank to represent the poverty level of a country. The higher the ratio is, the greater the prevalence of poverty within a given country. The Standard Deviational Ellipse (SDE) was used in this study to detect the spatial evolution of poverty in countries along the Belt and Road.
The Standard Deviation Ellipse is one of the classic methods used to analyze the directional characteristics of spatial distribution. It can reveal the spatial distribution of research elements from various angles, such as the gravity center, axis, direction, and oblateness (Li et al., 2017; Yang and Grigorescu, 2017). The gravity center reflects the relative spatial position of the most impoverished places (Li et al., 2021). The long axis illustrates the main trend direction of the distribution of poverty, and the short axis represents the range of data distribution. This study used first-level Standard Deviation, and the formulas for the standard deviation ellipse are as follows:
$\text{Center:}\ {{\bar{X}}_{w}}=\frac{\mathop{\sum }_{i=1}^{n}{{w}_{i}}{{x}_{i}}}{\mathop{\sum }_{i=1}^{n}{{w}_{i}}};\ \ \ \overline{{{Y}_{w}}}=\frac{\mathop{\sum }_{i=1}^{n}{{w}_{i}}{{y}_{i}}}{\mathop{\sum }_{i=1}^{n}{{w}_{i}}}$
$x\text{ }\!\!~\!\!\text{ standard}\ \text{deviation:}\ {{\sigma }_{x}}=\sqrt{\frac{\mathop{\sum }_{i=1}^{n}{{\left( {{w}_{i}}{{{\tilde{x}}}_{i}}\cos \theta -{{w}_{i}}{{{\tilde{y}}}_{i}}\sin \theta \right)}^{2}}}{\mathop{\sum }_{i=1}^{n}w_{i}^{2}}}$
$\begin{matrix} y~\text{standard}\ \text{deviation: }\ {{\sigma }_{y}}=\sqrt{\frac{\mathop{\sum }_{i=1}^{n}{{({{w}_{i}}{{{\tilde{x}}}_{i}}\sin \theta -{{w}_{i}}{{{\tilde{y}}}_{i}}\cos \theta )}^{2}}}{\mathop{\sum }_{i=1}^{n}w_{i}^{2}}} \\\end{matrix}$
$Oblateness: S=\frac{(yx)}{y}$
where ($\overline{{{X}_{w}}}$, $\overline{{{Y}_{w}}}$) represents the spatial location of the poverty gravity center, wi represents the weight, (xwi, – ywi) represents the weighted center, θ is the azimuth of the ellipse, ${{\tilde{x}}_{i}}$and ${{\tilde{y}}_{i}}$ represent the coordinate deviation from the average center of each research object location, and σx and σy represent the standard deviation of x-axis and y-axis, respectively.
The oblateness (long axis minus short axis/long axis) reflects the spatial distribution of poverty; the larger the oblateness, the more concentrated the poverty.
2.2.2 Poverty gravity center movement
The distance of the poverty center’s movement represents the degree of changes that occurred with respect to the regional poverty of each country during a certain period. This is jointly determined by changes in poverty headcount ratios within all of the countries in the research area. The calculation of this distance is as follows (Sun et al., 2020):
${{d}_{(k+1)-k}}=C\times \sqrt{{{({{X}_{k+1}}-{{X}_{k}})}^{2}}+{{({{Y}_{k+1}}-{{Y}_{k}})}^{2}}}$
where C is a constant equal to 111 km that represents the coefficient of conversion from the coordinate unit of the earth’s surface (degree) to the plane distance (km). ${{X}_{k+1}}-{{X}_{k}}$ and ${{Y}_{k+1}}-{{Y}_{k}}$ represent the changes in the longitude and the latitude of the gravity center coordinates between year k and year k+1, respectively, and d(k+1)k represents the distance that a gravity center moved between year k and year k+1.
Mean velocity is equal to the distance made in equation (5) divided by time. The higher the mean velocity, the more drastically the poverty degree changes in space.
We calculated the contributions that each country’s poverty headcount ratio made to the movement of the poverty gravity center. The contribution model enables the direct separation of a specific index from the overall growth of an area (Sun et al., 2020). In this study, we used the contribution model to identify the individual contribution of each country to the total region. The calculation is as follow:
$g_{i}=\frac{G_{i}}{\sum_{i=1}^{n} G_{i}} \times 100 \% \quad\left(G_{i}=Y_{1}-Y_{0}\right)$
where Y0 and Y1 represent the base and current period, respectively, Gi represents the poverty headcount ratio, and i represents the countries examined. The direct influence of country i on the specified index of the study area is represented by gi.

3 Results

3.1 Spatial trajectory of poverty gravity centers

From 2000 to 2020, the poverty gravity center was consistently located in the border region between China, India, Nepal, and Pakistan. The center moved continuously from west to east and south to north. The longitude changed by 8.42°, and the latitude shifted by 0.27°, which indicates that the movement in the east-west direction was greater than the movement in the north-south direction. Before 2005, the center moved from northwest to southeast, but since then, the center has been on a northwestward trajectory. This change in trajectory was closely connected to the poverty population decrease in China and Southeast Asian countries. In 2000, the poverty gravity center of the Belt and Road was located in Gawalgaun, India, and it reached Ahmadi Dirga, Pakistan in 2020 (Figure 1). During that period, the poverty gravity center moved to the southwest by 800.69 km at the speed of 87.60 km each year (Figure 1 and Table 2). The rate of change during each of these periods was different in that the shifts that took place between 2000-2005 and 2015-2020 were much faster than those that occurred at other times (Table 2). This is because the poverty headcount ratio changed more rapidly during these stages. The coverage of the ellipses gradually narrowed and moved southwest, which indicates that poverty became more concentrated in the Belt and Road countries. The standard deviation oblateness increased 0.11 from 2000 to 2020, and the poverty agglomerated in the northeast-southwest axis (Figure 1 and Table 2).
Figure 1 Evolution of the poverty gravity center movement and SDEs for Belt and Road countries from 2000 to 2020

Note: Map Content Approval Number: GS (2016) 1666, no modification

Table 2 Variation of standard deviational ellipse parameters along the Belt and Road from 2000 to 2020
Year Direction Mean velocity
(km/a)
Mean movement
distance of gravity (km)
Change of
oblateness
2000-2005 southeast 99.23 595.40 -0.01
2005-2010 northwest 63.28 379.70 0.10
2010-2015 northwest 42.63 255.77 0.03
2015-2020 northwest 101.47 608.79 -0.01
2000-2020 northwest 87.60 800.69 0.11

3.2 Contributions of typical countries to the poverty gravity center movement

The rose plot was used to qualitatively illustrate the contribution of major countries to the movement of the poverty center. The length of the color band represents how much a given country contributed to the shift (Figure 2). Over the past 20 years, the contribution that western European countries made to the movement of the center was less than that of countries in Central, South, and Southeast Asia. From 2000 to 2005, Tajikistan contributed the most with 14.60% of the cumulative contribution to the poverty gravity center movement, followed by Nepal, Kyrgyz Republic, China, and Moldova. From 2005 to 2010, the contribution of Mongolia accounted for 15.5%, followed by Albania at 15.1%. From 2015 to 2020, the contribution of Bangladesh accounted for 14.1%, followed by Turkmenistan at 13.9% (Figure 2).
Figure 2 The cumulative contribution (%) of major countries to the poverty gravity center movement from 2000 to 2020

3.3 Spatio-temporal evolution characteristics of poverty reduction

From 2000 to 2020, a significant reduction in poverty occured. Countries in East and Southeast Asia experienced the largest poverty reduction. Among them, the poverty population decreased the most in China, followed by India (Figure 3f). In contrast, Greece and Poland saw an increase in poverty (Figure 3). Obviously, the poverty reduction effect in the west was not as significant as it was in the east (Figure 3).
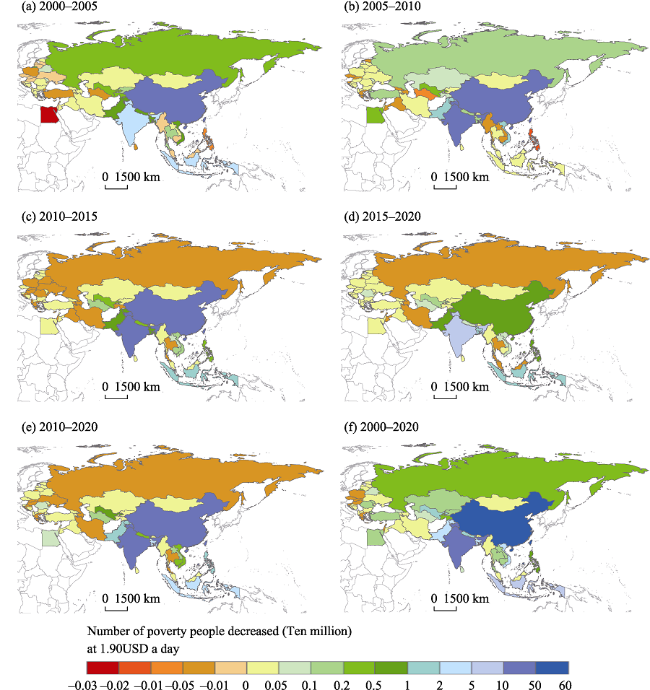
Figure 3 Distribution of the poverty reduction from 2000 to 2020
The poverty reduction effect varies greatly in countries along the Belt and Road (Figure 3). From 2000 to 2020, the poverty population decreased from 1277.9 million to 66.5 million. Among the countries located in this region, China, India, Indonesia, Bangladesh, Pakistan, Vietnam, and Uzbekistan accounted for more than 96% of the total decrease (Figure 4). The cumulative number of people who moved out of poverty in China was 528.9 million and accounted for 43.7% of the total reduction in the study area (Figure 4).
Figure 4 Proportions of poverty population alleviation in major countries to the total (%) of the Belt and Road region from 2000 to 2020
From 2000 to 2020, poverty populations were mainly distributed in nine countries that accounted for more than 90% of the total sample (Figure 5). Among them, the poverty population in China has sharply declined, and the proportion of impoverished populations decreased there from 41.63% to 4.33% (Figures 5 and 6). The proportion of the poverty population in India has always been around 45%, and this number is typically around 10% to 15% in Indonesia and Bangladesh, showing an upward trend. The proportion of poverty populations in the Philippines, Nepal, Uzbekistan, Pakistan, and Myanmar have all slightly increased (Figure 5). As of 2020, the remaining poverty population along the Belt and Road was mainly concentrated in countries in South Asia and Southeast Asia. The poverty population in India, Indonesia, and Bangladesh accounted for 15.02%, 47.75%, and 10.60% of the total poverty population in the Belt and Road region, respectively (Figure 5).
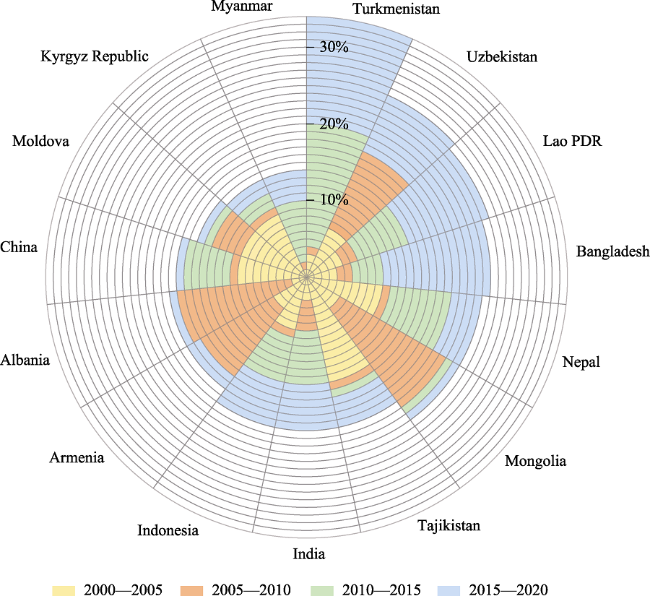
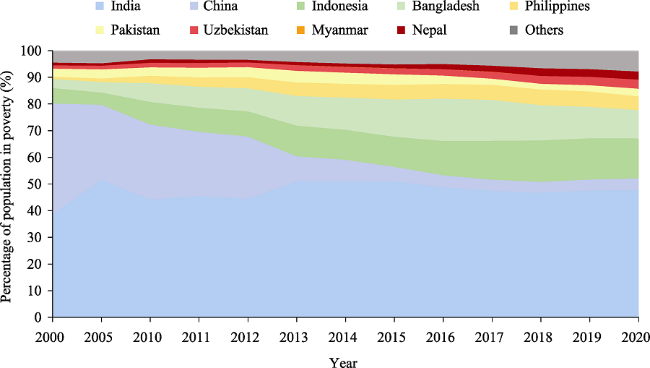
Figure 5 Percentage of countries’ populations in poverty from 2000 to 2020
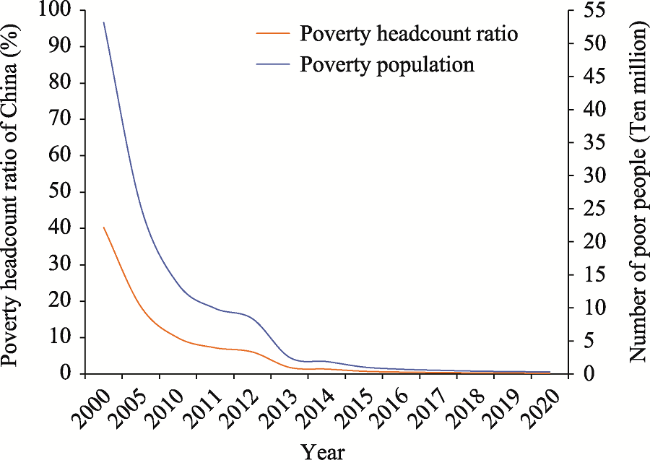
Figure 6 Poverty evolution in China from 2000 to 2020

4 Discussion

4.1 The relationship between the poverty gravity center trajectory and poverty
reduction

The poverty gravity center of the Belt and Road shifted to the northwest along the China- India border from 2000 to 2020, and the poverty spatial agglomeration increased (Figure 1). The movement of the poverty gravity center was caused by varying changes of poverty degree in different countries within the region (Figure 2). Countries with higher poverty headcount ratios contributed more to the movement of the center (Figure 2); the poverty gravity thus tended to move towards deeply impoverished countries. It has been well established that poverty reduction significantly affects a country’s poverty headcount ratio. From 2000 to 2020, countries in Central Asia showed sustained high poverty headcount ratios and achieved less poverty reduction than those in East and South Asia (Figure 3). This resulted in the movement of the poverty gravity center from the east to the west of the Belt and Road from 2000 to 2020 (Figure 3). Meanwhile, China has effectively reduced its poverty headcount ratio and made outstanding contributions to regional poverty reduction (Figures 3-6). China’s poverty reduction accounted for 43.8% of the total poverty reduction in the Belt and Road from 2000 to 2020 (Figure 4). The poverty headcount ratio in China decreased from 40.3% to 0.2% during the study period with an average annual decline of 1.91%, and the Chinese poverty population decreased by 528.9 million (Figures 3 and 6). Therefore, studies that specifically investigate poverty reduction in China may be able to help address poverty reduction challenges in other countries.

4.2 China’s poverty reduction progress and comparison with other countries

China has struggled against poverty for decades but has achieved great success in its efforts to address this challenge (Figures 3 and 6). Poverty reduction effects in countries along the Belt and Road, however, were not as significant as the changes that have taken place in China (Figures 3 and 4). In fact, the poverty population in some countries even increased (Figure 3), and the World Bank has estimated that COVID-19 may have driven as many as 100 million people back into extreme poverty. Because of this, there is a growing need to understand the poverty reduction strategies that have been implemented in China (Table 3) and compare the Chinese experience with that of other countries.
Table 3 Progress for poverty reduction assessed in China from 2000 to 2020
Year Policy Policy measures Effect
2001 Development-Driven Poverty Alleviation in Rural Areas (2001-2010) • List priority region
• The entire-village advancement poverty alleviation
• Abolish agricultural tax
• Fully implement the subsistence allowance system
• Poverty population reduced by half
• Poverty headcount ratio decreased from 40.3% to 9.92% from 2000 to 2010
2013 Targeted poverty
alleviation
• Accurate identification
• Register in information platform
• Dispatch resident working teams
• Targeted measures
• Establish poverty exit mechanism
• Eradicated extreme poverty
• Poverty headcount ratio deceased from 1.79% to 0.24% from 2013 to 2019
2020 Five-year transition period policy to consolidate poverty alleviation achievements • Monitor and prevent population return to poverty
• Build a system to provide regular aid to the poverty population
• Prevented large scale return of impoverished households to poverty
• Poverty headcount ratio keeps within 0.2%
The poverty alleviation process that took place in China from 2000 to 2020 can be divided into three stages. In 2001, the Development-Driven Poverty Alleviation in Rural Areas Program (2001-2010) was issued. This initiative shifted the poverty reduction focus from the county level to the village level (Wang et al., 2007). During this period, China prioritized its central and western regions, and 148,200 thousand poverty-stricken villages were identified. The new plan also emphasized the development of rural infrastructure and social and cultural services (Chirac, 2004). Additionally, business development, skill training, labor absorption, and relocation were implemented. Agricultural tax was abolished to relieve the burden on farmers. In addition, a series of rural social security systems, such as the new cooperative medical care system, was established. In 2008, China took the lead in achieving the millennium development goal of halving the poverty population.
In 2013, the Strategy of Targeted Poverty Alleviation (TPA) was proposed (Zhou et al., 2018). Since then, China’s anti-poverty strategies have shifted towards targeted poverty alleviation (Liu et al., 2020). Unlike previous measures, this policy highlighted the importance of accurate poverty identification (Liu et al., 2017). First, impoverished households were accurately identified based on their incomes with consideration given to other factors, such as housing, health, and education. Second, every impoverished household registered their poverty causes and needs in the government electronic archives. Third, resident working teams were formed to assign officials into villages. From 2013 to 2020, about 255,000 teams were sent to all the poverty-stricken villages in China, and nearly three million resident officials were appointed to contact every impoverished household (SCIO, 2021). Fourth, categorized and targeted measures were adopted to reduce poverty. Specific measures have been implemented that are tailored to each household’s needs, especially as they relate to the reconstruction of shabby buildings, education, hygiene, and drinking water safety (Li et al., 2016; Liu et al., 2017). Finally, a deregistration mechanism was established for populations that were lifted out of poverty.
At the end of 2014, there were still 70.17 million rural people living below the government’s official poverty line of RMB 2300 (362.5 USD) per capita annual net income (Li et al., 2016). However, by 2020, China had lifted all rural residents out of poverty. In 2021, a five-year grace period was implemented to consolidate the achievements in poverty alleviation with efforts to promote rural revitalization in China and help prevent newly alleviated households from returning to poverty (Liu et al., 2020).
Compared with other countries, China's poverty reduction reflects the progress of human rights and efforts to reduce inequality. China has achieved remarkable results in poverty reduction, which are reflected in the fundamental changes that have taken place in poverty-stricken areas and the remarkable improvement in the living standards of impoverished people. For instance, the population in India has unequal access to key social services, particularly health care and schooling (Ravallion, 2011). The poverty reduction strategies in China were developed in a way that prioritized human rights and fostered the subjectivity of citizens through the promotion democratic participation and pluralistic governance (Zheng, 2020). Because of this emphasis on human rights protection, multi-dimensional poverty alleviation measures were carried out for education, medical care, and housing in China. The basic old-age insurance, health insurance, and subsistence allowance standards have been raised as well as the income level.

4.3 The implications about poverty reduction from China’s experiences

Countries have adopted diverse strategies to reduce poverty and address inequality. According to the data that can be obtained from the countries located along the Belt and Road, the number of people who transitioned out of poverty in the region between 2000 and 2020 exceeded 1211.14 million. Among them, China, India, and several other countries (Table 3, Figures 3 and 4) have made remarkable progress in reducing poverty (Thorat and Fan, 2007; Binh and Ha, 2019). However, despite these successes, countries still face several challenges while working towards poverty reduction (Table 4).
Table 4 Challenges of poverty reduction in study countries with the highest poverty headcount ratios or the largest remaining poverty populations
Country Poverty population
in 2020 (million)
Poverty headcount
ratio in 2020 (%)
Challenges of poverty alleviation
Turkmenistan 1.61 26.56 Water shortage (Wang et al., 2012)
Lower levels of economic development and weaker infrastructure (Qi et al., 2019)
India 31.74 2.30 Huge population
Shortage of per capita resource (Rao et al., 2011;
Cronin et al., 2014)
Inequality in social class caused by caste group systems (Ravallion, 2011)
Rural-urban disparity (Das and Pathak, 2012)
Soil degradation (Bhattacharyya et al., 2015)
Indonesia 9.98 3.65 Laborers with limited levels of education
(Novianti et al., 2020)
High unemployment rate (Hafnati and Syahnur, 2018)
Large gap between the wealthy and the poor
Bangladesh 7.05 4.28 Frequent flooding disasters (Dewan and Tanvir, 2015)
Unequal social classes (DIBI, 2014)
Lack of strong and efficient bureaucracy (Sarker et al., 2017)
Pakistan 1.90 0.86 Uneven allocation of resources between urban and rural areas (Tanveer et al., 2020)
Unfair redistribution policies (Ahmed et al., 2015)
Climatic drought (Anjum et al., 2012)
Vietnam 0.61 0.63 Rural-urban disparity (Le, 2020)
Unsustainable poverty reduction policies and results (Chung et al., 2015; Tri, 2020)
High unemployment rate
Uzbekistan 2.27 6.79 Risk of stagflation in economy
Surplus laborers
High unemployment rate among young people
(Akhunov, 2021)
The new globalization strategy led by the Belt and Road Initiative has brought opportunities for global poverty reduction (Hu, 2018). Optimization of the international poverty reduction cooperation system is conducive to developing and enhancing the poverty reduction achievements of the Belt and Road (Liu et al., 2015; Liu and Dunford, 2016). After years of trial, China has created a way to promote human rights through development-oriented poverty reduction. As a facilitator of the movement to reduce poverty in the Belt and Road region, China has accumulated valuable experiences that could prove useful for other countries around the world. In fact, some of China’s poverty reduction measures emerged after officials assessed strategies that have been adopted in other countries and adapted them to Chinese conditions and cultural contexts (Rahman, 2011; Banerjee and Jackson, 2017). In a similar way, developing a better understanding of China’s experience of poverty reduction will contribute to global poverty reduction by providing a reference for other countries (Montalvo and Ravallion, 2010; Fang et al., 2020). China's poverty reduction experiences (Figure 7) should thus be publicized in order to help other countries that are trying to improve their poverty rates (Shuai et al., 2011).
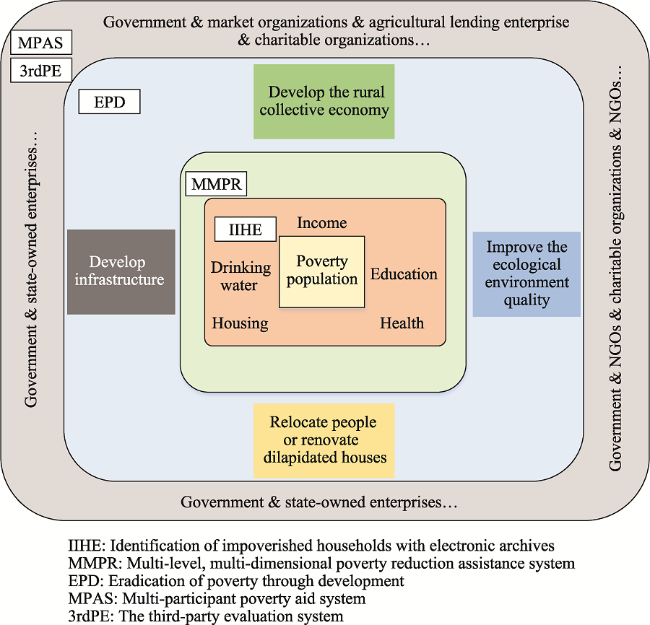
Figure 7 Implications from China’s poverty reduction experience
The first implication of China’s experience with poverty reduction is related to its decision to establish electronic archives and issue cards for every impoverished household (Li et al., 2016). During the final stage of the transition away from extreme poverty in China, impoverished households were registered and deregistered with dynamic management in electronic archives (Li et al., 2016; SCIO, 2021). These measures helped Chinese officials accurately identify poverty conditions, record family statuses, and ensure effective support, and they may also improve the accuracy of population identification in other countries. Officials from Thailand have already visited China to learn about poverty alleviation strategies and have followed this system of establishing a record for impoverished households and their family conditions. This method is more applicable to countries that face problems related to regional poverty, such as Pakistan (Table 4).
The second implication that has emerged from China’s experience is linked to its construction of a multi-level, multi-dimensional poverty reduction assistance system. Multi- level refers to the three levels of county-village-household assistance. At the impoverished county level, China aimed to improve medical quality and control the dropout rate in the compulsory education system. At the village level, China emphasized the development of rural industries, businesses, and the cultivation of collective economy. At the household level, China identified household multi-dimensional poverty types and created policies that fit the specific needs of a given context (Alkire and Santos, 2014). The Chinese government monitored the housing security (Lo et al., 2016), drinking water, medical conditions, education, and labor skills of impoverished households. This study proposes that China and India share several common characteristics in that both have seen rapid economic growth but rising levels of inequality (Ravallion, 2011).
Combating poverty in China would be difficult without addressing the issue of growing inequality in the country. However, China has been able to reduce inequality in health, education, and road access through multi-dimensional governance and adopt a new model for global poverty reduction (Figure 7). China’s multi-level, multi-dimensional poverty reduction assistance system will help safeguard the rights of the impoverished. This approach can be universally applied to promote the development of human rights while working towards the reduction of poverty. Hence, countries could try to address inequalities while combating poverty. For instance, India may need to start narrowing inequalities that exist between social classes or the rural-urban disparity to make up for the lack of a capability approach to addressing the poverty population (Table 4).
The third implication has to do with the multi-participant poverty aid system (Figure 7). China has formed a poverty reduction system that is led by the government and other organizations, such as non-governmental organizations (NGOs) and market organizations. Among them, the government has played a key role in the success of the system (Wu and Si, 2018). As the leading party, it has improved implementation efficiency and provided institutional guarantees. Supporting parties, such as state-owned enterprises, agricultural lending enterprises, and industry associations, have also made full use of their resources (Liao and Fei, 2019; Wu and Si, 2018), business districts, and brand advantages while providing assistance in the form of agricultural products and tourism services in poverty-stricken areas as a means of expanding the urban market (Zhao et al., 2018). Charitable organizations played a role in supplementary assistance by offering volunteer resources and social support. The success of China’s poverty alleviation has thus benefited from the comprehensive poverty aid system, which allowed the government, NGOs, and market to serve different roles (Li et al., 2016). This multi-participation model can reduce the burden on the government and enhance the anti-risk ability of the poverty aid system (Table 4).
The fourth implication of China’s poverty reduction strategy is linked to its attempts to eradicate poverty through development (Figure 7). China has found a development-centered path towards poverty reduction in the form of an assistance model that helps boost development (Zuo et al., 2019). The impoverished population in China was mainly concentrated in rural areas, therefore measures were adopted to promote rural development. China created the Rural Land Contractual Management Right in 2012 and reformed the rural collective property rights system in 2018 by separating ownership rights, contracting rights, and management rights. Land engineering also promoted the capitalization of land resources (Zhou et al., 2018; Liu and Wang, 2019). Promoting land engineering in similar areas of India (Table 4) may be an effective agricultural approach to dealing with soil degradation (Bhattacharyya et al., 2015), and land consolidation could help promote poverty alleviation and address the shortage of land, funds, and labor force output in rural areas (Zhou et al., 2019).
The strategies implemented in China could also be used to combat the challenges of soil degradation and climate disasters in Turkmenistan, India, Pakistan, and Bangladesh (Table 4). In addition, China explored a path to achieving ecological poverty alleviation by adopting strategies that use ecological resources to develop tourism, characteristic planting and breeding enterprises, and other ecological industries. These measures have helped reduce the risk of economic stagflation and increase levels of employment (Table 4). China has also launched international poverty alleviation cooperation projects. For instance, it jointly launched a rural poverty alleviation plan and carried out the East Asia Poverty Reduction Demonstration Cooperation Technical Assistance Projects program in rural communities in Laos, Cambodia, and Myanmar (SCIO, 2021). In fact, countries along the Belt and Road, such as Laos, Cambodia, Myanmar, and Uzbekistan, have officially signed an agreement with China that runs until the end of 2021.
The fifth implication that has emerged from China’s experience is related to the establishment of a third-party evaluation system mechanism (Figure 7). The third-party evaluation system gave full play to the role of social supervision (Liu et al., 2018), and the Chinese government has commissioned third-party researchers to create an annual assessment of poverty alleviation work that took place from 2015 to 2020. Assessments conducted by a third party will ensure the independence and objectivity of policy evaluation while making the evaluation results more accurate and poverty alleviation policies more effective. This model is worthy of promotion, but it requires firm scientific institutions and efficient bureaucracy.
Sustainable global poverty alleviation can foster the construction of “community with a shared future for mankind” (Liang and Zhang, 2019), and promote China’s experiences can help contribute to the actualization of this goal. China’s poverty reduction strategies have effectively narrowed urban-rural disparities and reshaped the urban-rural relationship. From 2000 to 2020, China’s rural areas experienced a transition from poverty to revitalization, and the urban-rural relationship shifted from deprivation to integration. Therefore, in the process of poverty reduction and the development of various countries, this mechanism provides a worthy reference.
This paper does have some limitations that need to be addressed, however. There are political, economic, and environmental differences in the countries located along the Belt and Road, so it is impossible to replicate China’s experience. For example, it is not feasible to establish electronic archives and issue cards in counties with long-term, large-scale poverty. In countries that face special circumstances, the first thing to do is to maintain social stability rather than target poverty alleviation. Therefore, it is necessary to adjust measures in ways that account for local characteristics. Certain strategies should be tested first and then gradually promoted on a larger scale.

5 Conclusions

This paper provides new evidence about the poverty evolution of the Belt and Road. Panel data that spanned 21 years was used to investigate the evolution of the poverty gravity center. As our results demonstrate, the poverty gravity center moved from the northwest to the east in South Asia from 2000 to 2020. This study also analyzed the contributions of typical countries to the poverty gravity center’s movement. The poverty gravity center shifted in the direction of countries with high headcount ratios and lower poverty reduction effects. Meanwhile, China contributed the most to regional poverty reduction, which also explains why the poverty gravity center moved to the northwest in the study region. Finally, implications about China’s poverty reduction experiences were summarized as a means of providing a reference for countries with large poverty populations or deep poverty headcount ratios.

The authors thank the editors and reviewers for peer-reviewing this manuscript, and the Alliance of Poverty Reduction and Development for funding in this work.

[1]
Ahmed V, Talpur M, Liaqat S, 2015. Towards a fair and just fiscal policy in Pakistan. Oxfam GB for Oxfam International. London: SDPI.

[2]
Akhunov M A, 2021. The economic significance of educating young people in the spirit of entrepreneurship in Modern Uzbekistan. International Journal of Progressive Sciences and Technologies, 24(7): 431-435.

[3]
Alkire S, Santos M, 2014. Measuring acute poverty in the developing world: Robustness and scope of the multidimensional poverty index. World Development, 59(1): 251-274.

DOI

[4]
Andornino G, 2017. The Belt and Road Initiative in China’s emerging grand strategy of connective leadership. China & World Economy, 25(5): 4-22.

[5]
Anjum S, Saleem M et al., 2012. An assessment to vulnerability, extent, characteristics and severity of drought hazard in Pakistan. Pakistan Journal of Science, 64(2): 85-96.

[6]
Banerjee S, Jackson L, 2017. Microfinance and the business of poverty reduction: Critical perspectives from rural Bangladesh. Human Relations, 70(1): 63-91.

DOI

[7]
Bhattacharyya R, Ghosh B N, Mishra P K et al., 2015. Soil degradation in India: Challenges and potential solutions. Sustainability, 7(4): 3528-3570.

DOI

[8]
Bicaba Z, Brixiová Z, Ncube M, 2017. Can extreme poverty in Sub-Saharan Africa be eliminated by 2030? Journal of African Development, 19(2): 93-110.

DOI

[9]
Binh T, Ha V, 2019. Poverty reduction in Vietnam and the role of public administration. Journal of Contemporary Asia, 49(1): 151-163.

DOI

[10]
Chen S, 2018. The poverty governance of Bangladesh: Experience and problems. Indian Ocean Economic and Political Review, (1): 107-122, 141. (in Chinese)

[11]
Chirac J, 2004. Scaling up poverty reduction: Global learning process and conference. Address for the opening of the World Bank Conference, 25-27.

[12]
Chung D K, Nguyen P L, Luu V D, 2015. Implementation of poverty reduction policies: An analysis of national targeted program for poverty reduction in the northwest region of Vietnam. International Journal of Business and Social Science, 6(9): 76-86.

[13]
Cronin A A, Prakash A, Priya S et al., 2014. Water in India: situation and prospects. Water Policy, 16(3): 425-441.

DOI

[14]
Dang H A, Lanjouw P F, 2018. Poverty dynamics in India between 2004 and 2012: Insights from longitudinal analysis using synthetic panel data. Economic Development and Cultural Change, 67(1): 131-170.

DOI

[15]
Das D, Pathak M, 2012. The growing rural-urban disparity in India: Some issues. International Journal of Advancements in Research & Technology, 1(5): 1-7.

[16]
Dewan T H, 2015. Societal impacts and vulnerability to floods in Bangladesh and Nepal. Weather & Climate Extremes, 7: 36-42.

[17]
Fang C, Gai Q, He C et al., 2020. The experience of poverty reduction in rural China. Sage Open, 10(4): 10.1177/2158244020982288.

[18]
Fernandes N, 2020. Economic effects of coronavirus Outbreak (COVID-19) on the world economy. IESE Business School Working Paper, No.WP-1240-E, Available at SSRN: https://ssrn.com/abstract=3557504 or http://dx.doi.org/10.2139/ssrn.3557504.

[19]
Glauben T, Herzfeld T, Rozelle S et al., 2012. Persistent poverty in rural China: Where, why, and how to escape? World Development, 40(4): 784-795.

DOI

[20]
Hafnati N, Syahnur S, 2018. Inflation, unemployment, and NAIRU estimate in Indonesia: Phillips curve approach. Economic Analysis, 51(3/4): 24-32.

DOI

[21]
Hang C, Qin Z, 2015. On targeted poverty reduction and poverty governance system building. Journal of China Executive Leadership Academy Yan’an, 8(1): 131-136. (in Chinese)

[22]
Hipsher S A, 2013. The Private Sector’s Role in Poverty Reduction in Asia. Oxford: Chandos Publishing.

[23]
Hu B, 2018. The Belt and Road Initiative and the transformation of globalization. Kwartalnik Nauk o Przedsiębiorstwie, 46(1): 30-37.

DOI

[24]
Jiang A, Zhang Q, 2016. A research on the mutual reference of China’s poverty reduction knowledge in the "Belt and Road" construction. China Business and Market, 30(4): 55-63. (in Chinese)

[25]
Le N P, 2020. Education, employment, and income: An overview of rural-urban gaps in Vietnam. Vietnam Journal of Agricultural Sciences, 3(2): 647-661.

DOI

[26]
Li D, Yu H, Li X, 2017. The spatial-temporal pattern analysis of city development in countries along the Belt and Road Initiative based on nighttime light data. Geomatics & Information Science of Wuhan University, 42(6): 711-720. (in Chinese)

[27]
Li Y, Su B, Liu Y, 2016. Realizing targeted poverty alleviation in China. China Agricultural Economic Review, 8(3): 443-454.

DOI

[28]
Li Y, Wu W, Wang Y, 2021. Global poverty dynamics and resilience building for sustainable poverty reduction. Journal of Geographical Sciences, 31(8): 1159-1170.

DOI

[29]
Liang H, Zhang Y, 2019. A new development idea: Leading the construction of a community with a shared future for mankind. In: The Theoretical System of Belt and Road Initiative, 9-14. Singapore: Springer.

[30]
Liang W, Zhong S, Khampheng B et al., 2017. Poverty and its reduction paradigm research in southeast Asia under the backdrop of the Belt and Road Initiative. Science & Technology for Development, 13(6): 463-471. (in Chinese)

[31]
Liao C, Fei D, 2019. Poverty reduction through photovoltaic-based development intervention in China: Potentials and constraints. World Development, 122: 1-10.

DOI

[32]
Liu M, Feng X, Wang S et al., 2020. China’s poverty alleviation over the last 40 years: Successes and challenges. Australian Journal of Agricultural and Resource Economics, 64(1): 209-228.

DOI

[33]
Liu Q, Yu M, Wang X, 2015. Poverty reduction within the framework of SDGs and post 2015 development agenda. Advances in Climate Change Research, 6(1): 67-73.

DOI

[34]
Liu W, 2015. Scientific understanding of the Belt and Road Initiative of China and related research themes. Progress in Geography, 34(5): 538-544.

[35]
Liu W, Dunford M, 2016. Inclusive globalization: Unpacking China’s Belt and Road Initiative. Area Development and Policy, 1(3): 323-340.

DOI

[36]
Liu Y, 2020. Modern human-earth relationship and human-earth system science. Scientia Geographica Sinica, 40(8): 1-14. (in Chinese)

[37]
Liu Y, Guo Y, Zhou Y, 2018. Poverty alleviation in rural China: Policy changes, future challenges and policy implications. China Agricultural Economic Review, 10: 241-259.

DOI

[38]
Liu Y, Liu J, Zhou Y, 2017. Spatio-temporal patterns of rural poverty in China and targeted poverty alleviation strategies. Journal of Rural Studies, 52: 66-75.

DOI

[39]
Liu Y, Wang Y, 2019. Rural land engineering and poverty alleviation: Lessons from typical regions in China. Journal of Geographical Sciences, 29(5): 643-657.

DOI

[40]
Liu Y, Xu Y, 2016. A geographic identification of multidimensional poverty in rural China under the framework of sustainable livelihoods analysis. Applied Geography, 73: 62-76.

DOI

[41]
Lo K, Xue L, Wang M, 2016. Spatial restructuring through poverty alleviation resettlement in rural China. Journal of Rural Studies, 47: 496-505.

DOI

[42]
Mahmud Titumir R A, Zahidur Rahman M, 2019. Economic implications of China’s Belt and Road Initiative (BRI): The case of Bangladesh. China and the World, 2(3): 1950021.

DOI

[43]
Manish B, 2012. World poverty: Sustainability is key to development goals. Nature, 489(7416): 367.

[44]
Montalvo J G, Ravallion M, 2010. The pattern of growth and poverty reduction in China. Journal of Comparative Economics, 38(1): 2-16.

DOI

[45]
Novianti L, Masbar R, Nasir M, 2020. What determines the poverty of paid workers in Indonesia. East African Scholars Journal of Economics, Business and Management, 3(1): 2617-7269.

[46]
Purwono R, Wardana W W, Haryanto T et al., 2021. Poverty dynamics in Indonesia: Empirical evidence from three main approaches. World Development Perspectives, 23: 100346.

DOI

[47]
Qi S, Peng H, Zhang X et al., 2019. Is energy efficiency of Belt and Road Initiative countries catching up or falling behind? Evidence from a panel quantile regression approach. Applied Energy, 253: 113581.

DOI

[48]
Rahman M W, 2010. Comparison of Microfinance Model in China and Bangladesh. Beijing: Social Science Electronic Publishing.

[49]
Rao M, Rao K D, Kumar A S et al., 2011. Human resources for health in India. The Lancet, 377(9765): 587-598.

DOI

[50]
Ravallion M, 2011. A comparative perspective on poverty reduction in Brazil, China, and India. The World Bank Research Observer, 26(1): 71-104.

DOI

[51]
Ravallion M, Chen S, 2004. China’s (uneven) progress against poverty. Journal of Development Economics, 82(1): 1-42.

DOI

[52]
Ren Q, Huang Q, He C et al., 2018. The poverty dynamics in rural China during 2000-2014: A multi-scale analysis based on the poverty gap index. Journal of Geographical Sciences, 28(10): 1427-1443.

DOI

[53]
Rogers S, 2014. Betting on the strong: Local government resource allocation in China’s poverty counties. Journal of Rural Studies, 36: 197-206.

DOI

[54]
Sachs J, Schmidt-Traub G, Kroll C et al., 2020. The Sustainable Development Goals and COVID-19. Sustainable Development Report 2020. Cambridge: Cambridge University Press.

[55]
Sarker M N, Bingxin Y, Sultana A et al., 2017. Problems and challenges of public administration in Bangladesh: pathway to sustainable development. International Journal of Public Administration and Policy Research, 3(1): 16-25.

[56]
Sharma M, Mohapatra G, Giri A K, 2021. Is tourism pro-poor in India? An empirical investigation using ARDL approach. Journal of Economic and Administrative Sciences, Vol. ahead-of-print No. ahead-of-print. https://doi.org/10.1108/JEAS-02-2021-0031.

[57]
State Council Information Office of the People’s Republic of China (SCIO), 2021. Poverty Alleviation: China’s Experience and Contribution. Beijing: The Information Office of the State Council.

[58]
Sun Z, Chen X, Xing H et al., 2020. Regional differences in socioeconomic trends: The spatiotemporal evolution from individual cities to a megacity region over a long time series. Plos One, 15(12): e0244084.

DOI

[59]
Tanveer H, Balz T, Sumari N S et al., 2020. Pattern analysis of substandard and inadequate distribution of educational resources in urban-rural areas of Abbottabad, Pakistan. GeoJournal, 85(5): 1397-409.

DOI

[60]
Thorat S, Fan S, 2007. Public investment and poverty reduction: Lessons from China and India. Economic & Political Weekly, 24: 704-710.

[61]
Tollefson J, 2015. UN approves global to-do list for next 15 years. Nature, 525(7570): 434-435.

DOI

[62]
Tri N M, 2020. Economic growth with poverty reduction in Vietnam. Journal of Critical Reviews, 7(8): 2527-2533.

[63]
Wang S, Li Z, Ren Y, 2004. s The 8-7 National Poverty Reduction Program in China: The national strategy and its impact. In: China Country Case Study for Shanghai Poverty Conference. New York: The World Bank.

[64]
Wang S, Park A, Chaudhuri S et al., 2007. Rural poverty alleviation and village poverty targeting in the new period of China. Management World, (1): 56-64. (in Chinese)

[65]
Wang X, Chen Y, Li Z et al., 2020. Development and utilization of water resources and assessment of water security in Central Asia. Agricultural Water Management, 240: 106297.

DOI

[66]
World Bank, 2020a. Global Economic Prospects. New York: World Bank and Oxford University Press.

[67]
World Bank, 2020b. Global Outlook: Pandemic, Recession: The Global Economy in Crisis. Washington, DC: World Bank Publications, 1-66.

[68]
Wu J, Si S, 2018. Poverty reduction through entrepreneurship: Incentives, social networks, and sustainability. Asian Business & Management, 17(4): 243-259.

[69]
Yang X, Grigorescu A, 2017. Measuring economic spatial evolutional trend of central and eastern Europe by SDE method. Contemporary Economics, 11(3): 253-267.

[70]
Zhao L, Cheng F, Mao C, 2018. Tourism and poverty reduction: An empirical evidence from China. Tourism Tribune, 33(5): 13-25.

[71]
Zhou Y, Guo Y, Liu Y et al., 2018. Targeted poverty alleviation and land policy innovation: Some practice and policy implications from China. Land Use Policy, 74: 53-65.

DOI

[72]
Zhou Y, Guo L, Liu Y, 2019. Land consolidation boosting poverty alleviation in China: Theory and practice. Land Use Policy, 82: 339-348.

DOI

[73]
Zuo C, 2019. The Evolution of China's Poverty Alleviation and Development Policy (2001-2015). Singapore: Springer.

Options
Outlines

/