Research Articles

Spatially explicit changes of forestland in Taiwan Province from 1910 to 2010

  • YANG Xuhong , 1 ,
  • JIN Xiaobin , 1, * ,
  • YANG Yongke 2 ,
  • SONG Jiani 1 ,
  • ZHANG Tong 1 ,
  • ZHOU Yinkang 1
Expand
  • 1. School of Geography and Ocean Science, Nanjing University, Nanjing 210023, China
  • 2. School of sciences, Central South University of Forestry and Technology, Changsha 410004, China
* Jin Xiaobin, PhD and Professor, E-mail:

Yang Xuhong, PhD and Assistant Professor, specialized in land use modelling and system simulation. E-mail:

Received date: 2021-08-10

  Accepted date: 2021-10-21

  Online published: 2022-05-25

Supported by

National Natural Science Foundation of China(41801065)

National Key R&D Program of China(2019YFA0606603)

National Undergraduate Training Program for Innovation and Entrepreneurship(202010284073Y)

Abstract

Reconstructing long-term changes of forest cover (FC) can provide reliable underlying data for carbon source/sink accounting and simulation of the effects of land use on the climate and environment. Historical maps contain a wealth of forest related information and can provide first-hand data for studying the changes in FC over a long time period. Taking the reconstruction of FC in Taiwan Province from 1910-2010 as the research object, we used map extraction and mining methods to extract forest distribution information from historical forest thematic survey maps, topographic and land cover maps, and reconstructed the spatiotemporal patterns of FC in Taiwan from 1910-2010. The results show that: first, the relative bias of the FC area extracted from the historical maps of Taiwan was below 8%, meaning the FC information contained in maps is highly accurate. Second, the FC of Taiwan has generally declined in the past 100 years. From 1910-2010, the forest area declined from 2.62×10⁶ ha to 2.47×10⁶ ha, with relatively obvious forest reduction having occurred. In stages, the forest area of Taiwan decreased by 26.39×10⁴ ha from 1910 to 1950; and increased by 10.53×10⁴ ha during the period 1950-2010. Forest reduction was obvious during the Japanese occupation period, while forest increase was remarkable during the Kuomintang period. Third, during the study period, the total area of patches maintained as forests was 2.17×10⁶ ha with little change in the overall pattern, and forests were mainly distributed in the mountain regions. The loss of forest mainly occurred in the plains, with expanding forest areas mainly in the mountain regions at high elevations and on steep slopes. Fourth, land clearing for agriculture during the Japanese occupation period has been the important driver of forest reduction in Taiwan over the past century. After retreated to Taiwan, the Kuomintang government introduced effective and remarkable reforms that led to effective restoration of forest vegetation in many areas where forests had previously disappeared.

Cite this article

YANG Xuhong , JIN Xiaobin , YANG Yongke , SONG Jiani , ZHANG Tong , ZHOU Yinkang . Spatially explicit changes of forestland in Taiwan Province from 1910 to 2010[J]. Journal of Geographical Sciences, 2022 , 32(3) : 441 -457 . DOI: 10.1007/s11442-022-1956-y

1 Introduction

Land use activities have significantly changed the earth’s surface energy budget and material circulation mechanism, which influence climate and environmental effects at regional and global scales (Houghton, 1999; Pongratz et al., 2008; Aleman et al., 2018). Climate and ecological effect models include time lag and process accumulation characteristics. To improve the coupling and prediction accuracies of the model, an effective means of better simulating effects can be done through enhancing the accuracy of the land use/cover change (LUCC) dataset used in modeling and extending the timespan of the dataset from an input perspective (Yang et al., 2016b; Goldewijk et al., 2017). In 1995, a LUCC study jointly initiated by the International Geosphere-Biosphere Program and the International Human Dimensions Program emphasized the need of adopting various methods to reconstruct the detailed history of LUCC, which led to an upsurge in land cover change research for historical periods (Ge et al., 2008; Goldewijk et al., 2011, 2017). Under the joint promotion of research projects such as Global Change and Terrestrial Ecosystem (GCTE), Global Land Project (GLP), Integrated Land Ecosystem-Atmosphere Processes Study (iLEAPS), Past Global Changes (PAGES) and Future Earth, significant progress has been made in the quantitative reconstruction of high-precision spatiotemporal dataset of historical land cover. These include the reconstruction of historical land cover data at global and intercontinental scales, including for Europe, North America, and Africa (Ramankutty and Foley, 1999; Pongratz et al., 2008; Goldewijk et al., 2011, 2017; Aleman et al., 2018); in addition, the spatial and temporal patterns of cropland, forestland, or grassland have been studied at national scales (e.g., China and India), and at provincial scales in China (Tian et al., 2014; Yang et al., 2015; Li et al., 2019; Wei et al., 2019; Yang et al., 2019a; Hou et al., 2020; Lian et al., 2020).
Forests serve as an important part of land cover and the world’s important carbon sink; forest cover (FC) provides two to four times the carbon storage per unit area than that of an open ecosystem such as cropland or grassland (Houghton et al., 1983; Yang et al., 2019b). Because forestland is not a primary source of tax income for governments, systematic records of tax produced by forestland are often not available when compared with the availability of tax records on cropland and on domestic and foreign historical production (He et al., 2015). Meanwhile, the reconstruction and analysis of the spatial pattern of historical land use has mostly focused on cropland and grassland (Ramankutty and Foley, 1999; Pongratz et al., 2008; Goldewijk et al., 2011, 2017; Yang et al., 2019a). A reconstruction of the historical scale and spatial patterns of forestland is needed at a higher spatiotemporal scale to accurately evaluate the effects of changes in land use on the carbon cycle of the ecosystem (Miao et al., 2013; Yang et al., 2016a).
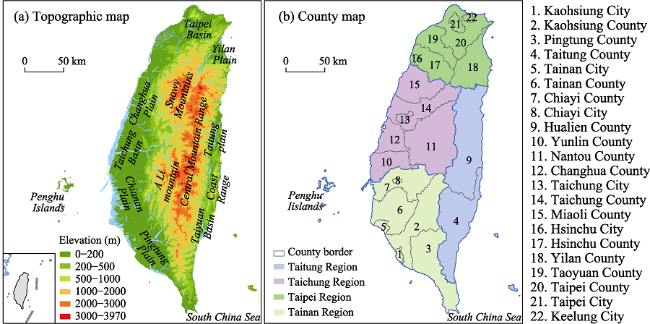
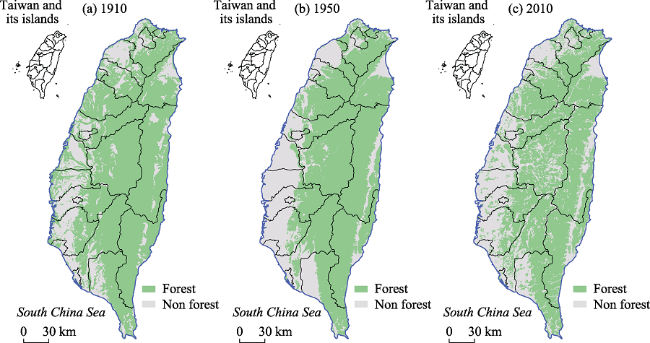
Researchers have explored various methods used to recover the spatiotemporal patterns of the long-term historical forestland cover before the existence of remote sensing satellites, which can be summarized in the following three aspects. The first is the forest area reconstruction method, which relies on statistical yearbook or literature to reconstruct the area change characteristics of forestland. For example, Esser et al. (1999) estimated the changes in FC in Europe from 1000 to 1850. Based on historical documents and statistical yearbook, some studies have conducted both qualitative and quantitative research on the area of historical forests of China (Lin, 1983; Shi, 1991; Fan and Dong, 2001) or America (Clawson, 1979). Based on historical documents of Qing Dynasty, He et al. (2007) combined modern statistical methods and changes in woodlands and population trends; they reconstructed a provincial forestland dataset with a time scale of 50 years starting in 1700. By analyzing historical literature, previous potential vegetation restoration, and driving forces, Ye et al. (2009) reconstructed the forest and grassland cover of each county in Northeast China over the past 300 years. The second method involves spatial pattern reconstruction using a model to recover forestland cover patterns. With the forest area as the limitation of the amount or rate of forest in grid units, this method uses environmental factors affected forestland distribution to establish the forest distribution potential suitability, and then construct a spatial-grid allocation model and quantitatively reconstruct the distribution pattern of forestland. For example, Kaplan et al. (2009) used population as a substitute factor to create gridded forestland data with a spatial resolution of 5′×5′ in the 1000 years prior to European industrialization through the interaction between agriculture and forestry. Steyaert and Knox (2008) used county-level forest statistics as an area control factor, combined with land cover, potential vegetation, and soil data to generate a gridded product of land cover with a spatial resolution of 20 km in the eastern United States in 1650-1992. Liu and Tian (2010) and Tian et al. (2014) generated the spatial patterns of historical cropland, forestland, and built-up land in China and India, respectively. By assuming that the interaction between cropland and forestland as well as assuming the spatial pattern of historical forest did not exceed the outer boundary of the potential natural forest vegetation, Li et al. (2014) and He et al. (2014) reconstructed forest in the past 300 years with a spatial resolution of 10 km in northeast and southwest China, respectively. Based on the above approach, He et al. (2015) further gridded China’s forest spatial pattern since 1700 using a temporal resolution of 20 years and a spatial resolution of 10 km. By comprehensively considering the behavioral characteristics of the individual in converting forestland for agricultural land and farming, cutting down forests for lumber and timber, Yang et al. (2018) constructed a forest distribution reconstruction model. That study reconstructed China’s gridded forestland dataset in 1661-1952 with a spatial resolution of 1 km. The third method involves image or map-based extraction of land use. Using high-precision atlases (e.g., historical thematic maps and topographic maps), after location registration, vectorization, and attribute correction, the long-term historical patterns of change in forestland use can be directly reconstructed. Ciupa et al. (2016) used historical maps, soil maps, and a digital elevation to model the FC changes occurring in the Holy Cross Mountains from 1800-2011. Based on digital forest maps or black and white orthophoto maps produced in 1868-2005, Cervera et al. (2020) reconstructed the forest distribution pattern in the Mediterranean area. Brandolini et al. (2020) modeled the landscape pattern of the Upper Rhone Valley in the past 200 years based on historical maps and GIS technology. Szypula (2020) adopted paleotopographic maps to recover the land use patterns of the Upper Silesian Industrial Region in 1890-2014. Chen
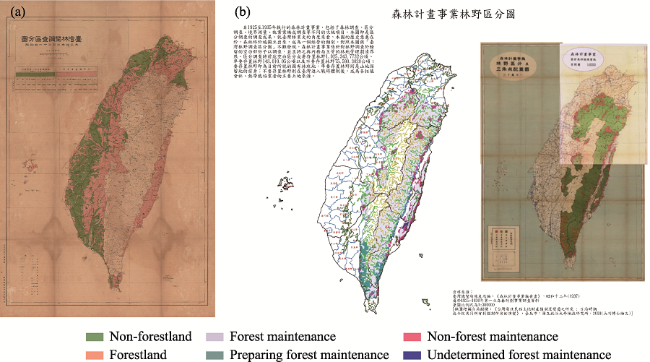
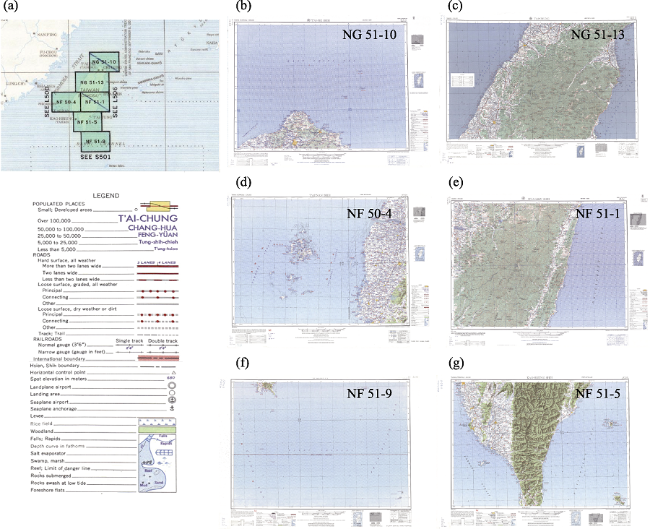
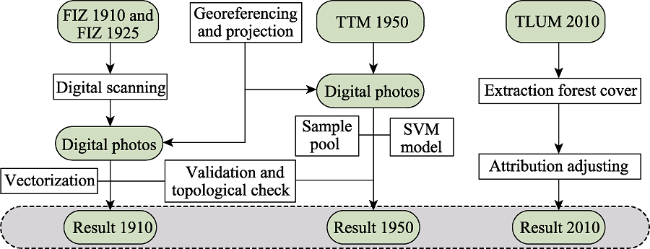
 et al. (2019) have reconstructed Taiwan’s land cover changes during 1904-2015 by means of historical maps and satellite images at a grid of 500 m. Among the above methods, the map extraction method has recently been widely used to recover historical land use information based on first-hand dataset. If the quality of an atlas data source is reliable, the reconstructed land use information will contain high spatiotemporal resolution as well as being reliable. This method has become widely used by the academic community (Jiang, 2015; Han et al., 2016; Wan et al., 2018).
Many historical thematic survey maps and topographic maps from the 1900s have been preserved during the Japanese and Kuomintang occupations in Taiwan Province where the forest is rich and tropical forest vegetation have high biomass density and storage. These atlases feature high resolution with clear and rich features. They provide an original data source for studying the changes in land cover that have occurred in Taiwan during the past century. Among them, a forest survey atlas and topographic maps contain abundant FC information for Taiwan, which can provide first-hand data for studying the forest changes in Taiwan in the past 100 years. In view of this, taking forest changes in Taiwan in the past 100 years as the research object, this study adopted map extraction and data mining methods to extract forest distribution information from historical forest thematic survey maps, topographic maps, and land cover maps; the spatiotemporal patterns of forest changes in Taiwan were reconstructed for the period 1910-2010. Then, we analyzed the driving forces of forest change in Taiwan in order to better comprehend the characteristics and patterns of historical land change processes on the west coast of the Taiwan Straits. The main purposes of this study are to (1) reconstruct the spatiotemporal patterns of forest change in Taiwan during the past 100 years; (2) explore the characteristics of forest changes in Taiwan at different stages of forest growth; and (3) investigate the main driving forces behind forest change in Taiwan.

2 Materials and method

2.1 Study area

Taiwan Province is located to the southeast of the Asian continent, facing Fujian Province of the Chinese mainland across the Taiwan Straits at 21°45′-25°56′N, 119°18′-124°34′E (Figure 1). This island is 394 km from north to south, 142 km wide from east to west; and has a total land area of 3.6×10⁴ km2, covering Taiwan’s main island and its appurtenant islands. The main island is surrounded by sea, topographically high in the middle and low on both sides. About one third of the main island is covered by plains and basins suitable for living and farming, while the remaining two thirds of the territory is covered by the Central Mountain Range and other mountains. The central range stretches across the island in a northeast-southwest direction. Northern Taiwan is characterized by a subtropical monsoon climate, while the southern part experiences a tropical monsoon climate. Taiwan has an average annual temperature and precipitation of 23.6°C and above 2000 mm, respectively. With suitable conditions for the growth of forest, the main island mainly supports broad- leaved, coniferous, mixed broadleaved-coniferous, and bamboo forests. Some mainland coastal residents migrated to Taiwan to engage in farming as early as the Three Kingdoms Period (220-280 AD) along with during the Tang (618-907 AD) and Song (960-1279 AD) dynasties. Historical records contain abundant information related to the population, taxes, and paddy fields of Taiwan. However, the spatial and temporal records of Taiwan’s forests were less complete until modern times. After the Sino-Japanese War of 1894-1895 broke out, the Qing Dynasty was defeated. The Qing Dynasty was forced to cede Taiwan in the following year. It was not until the end of World War II that Taiwan ended its colonial history. During the colonial period, Japanese invaders performed a detailed survey of the forests in Taiwan in 1910-1914 and again in 1925-1930; they compiled an atlas of forestry survey divisions in Taiwan. In 1949, the Kuomintang government retreated to Taiwan and has been governing the territory until now. During this period, the U.S. Army Map Service prepared the Basic Topographic Maps of Taiwan, China in 1951 (the remaining two sets of atlases were the Basic Topographic Maps of North and South China and the Basic Topographic Maps of Northeast China). The 1951 atlas of Taiwan listed above contains 36 topographical maps with detailed geographical elements (e.g., contours, rivers, forests, arable lands, and water bodies) in Taiwan. It provides some first-hand data for studying the spatial and temporal patterns of forests in Taiwan in the past century. Given the lack of information on the islands surrounding Taiwan, this study focuses on the main island of Taiwan.
Figure 1 The topographic map (a), the county map of Taiwan Province (b)

2.2 Map data sources

Based on multi-source data fusion and data mining technology, this study used a historical atlas and contemporary remote sensing data to recover the spatial and temporal patterns of forests in Taiwan in the past 100 years. The basic data here include a forest survey zoning map, basic topographic maps, and LUCC data.
(1) Forest survey zoning maps of Taiwan (FIZ 1910 and FIZ 1925, see Figure 2). In 1910-1914, the Land Reclamation Bureau of the Governor’s Office of Taiwan conducted a forest survey in Taiwan. The bureau published a forestry survey report in 1917, which presented the forest survey zoning map of Taiwan (FIZ 1910). It organized the first forest planning survey of Taiwan in 1925-1930. Based on that, the Office published a forest planning survey report in 1937, which included the Taiwan forestry survey zoning map (FIZ 1925).
Figure 2 Forest survey zoning maps for 1910 (a) and 1925 (b)
The FIZ1910 records the forest survey results of Taiwan (except the Central Mountain Range) with a scale of 1:500,000. The registered land before the forest survey and the newly surveyed land are distinguished using green and pink colors, respectively. They account for 45.05% and 54.95% of the total land area surveyed, respectively. The atlas records the areas of different land types in the form of a table. Forest area only accounts for 6.96% of the registered land area of 79.83×10⁴ Kah (where Kah is unit of area in traditional measure and 1 Kah ≈ 0.69 ha) (Li, 1997). By contrast, forest area constitutes 95.55% of the newly surveyed land area of 97.37×10⁴ Kah. Since the land use classification is not further refined in the atlas, it is difficult to distinguish non-forestland types; the newly surveyed land (marked by pink color) is identified as forest. The forest areas in the surveyed land and the non-forestland area in the newly surveyed land cover similarly sized areas of 3.86×10⁴ ha and 3.01×10⁴ ha, respectively. Their only difference is in the spatial pattern location. This approximation does not affect the accuracy of the results despite the lack of literature.
The FIZ1925 dataset can fill the blank section of FIZ1910 because it recorded the results of a forestland survey in the Central Mountain Range of Taiwan with a scale of 1:300,000 where almost no one lived and forest density was very high. The original atlas uses green, orange, and red to mark the plots for reserve forest, future planned reserve forest, and unwanted forest, respectively. Reserve forest is the land that was mapped as forest at the time of the survey and the plan was for this to be continuously retained as forest. Future planned reserved forest was the mountainous area to be preserved as reserve forest in the future. The unwanted forest was to be cleared for farming and tropical agriculture. In 1925, the areas of reserve forest, future reserve forest, and unwanted forest were 102.53×10⁴ ha, 14.30×10⁴ ha, and 7.56×10⁴ ha, respectively. This study excluded the unwanted forest as part of the forest distribution, and combined with FIZ1910 data to generate the forest distribution pattern in Taiwan during 1910. Some of the blank areas not covered by the map are mainly located in the core high mountain region of the Central Mountain Range. Following Chen et al. (2019), those areas are classified as forests.
(2) Topographic maps of Taiwan, China (TTM1950, see Figure 3). The TTM1950 data cover the whole territory of Taiwan. It was originally a medium-scale military topographic map of the USA Army Map Service. It was produced in 1951 and declassified for global use in 2007. The TTM1950 maps consist of 36 topographic maps (i.e., six basic topographic maps, 30 large-scale maps or schematic diagrams of other important cities), all of which used the Hayford ellipsoid as the basic ellipsoid system and the transverse Mercator projection to construct a coordinate system with a scale of 1:250,000. They were prepared using the aerial photogrammetry mapping method. The main data sources of TTM include (1) a Chinese topographic map compiled by Japanese army prior to surrender; (2) topographic maps prepared by the U.S. Army Map Service and U.S. Aeronautical Chart and Information Center; and (3) aerial photographs or topographic maps provided by the Kuomintang government. The timespan of TTM may have spread no earlier than the year of 1951 and no later than 1945 due the shortage of specific time information, so we view these maps time as the year of 1950. According to Liao (2016), the atlas was printed in full color with clear points, lines, and polygons on the map. The roads, dams, river systems, and contours were detailed with English annotations, and different colors or symbols were used. Other features (e.g., forest vegetation, arable land, water bodies, and urban land) were also clearly marked in the atlas.
Figure 3 Basic topographic maps of Taiwan for 1950 (a is the sheet, and b-g represent part of the 1950 topographic map)
(3) Land use and cover change data in Taiwan (TLUM 2010). The TLUM2010 data is an important part of the LUCC dataset in China since 1980 developed by the Chinese Academy of Sciences. This dataset uses Landsat Thematic Mapper digital imagery supplemented by the HJ-1 satellite as the data source, and adopted a rapid extraction method for remote sensing information through human-computer interaction. This approach enables the extraction of the LUCC data every five years since the 1980s. The land use types include six first-level categories and 25 second-level categories with a scale of 1:100,000. The accuracies of the comprehensive evaluation of the primary and secondary types reached 94.30% and 91.20%, respectively (Liu et al., 2003, 2014). We have also checked FC of TLUM 2010 with remote sensing imageries in 2010 in whole Taiwan Province, and found that the spatial distribution pattern of TLUM 2010 is very similar to the macro pattern on Landsat imageries. Meanwhile, there are some small differences in the low density of FC where the agricultural vegetation, rural and urban land has been covered on the large scale. This data is given in Table 1.
Table 1 Maps used to analyze the FC in Taiwan
Map/Abbreviation Year Scale Covered area Forest representation Sources
Topicality Period
The forest investigation zone in Taiwan Province
(FIZ1910)
1910 1910-1915 1:500 000 Broad part of Taiwan Province except the Central Mountain Range Colored polygon filled with green or pink; dotted line boundaries http://thcts.ascc.net/htwn_ch.htm
the data list name is the rd 03-2, -3, -4 and -7.
The forest investigation zone in Taiwan Province
(FIZ1925)
1925 1925-1930 1:300 000 Central Mountain Range Colored polygon filled with green, orange, or red*; dotted line boundaries
Taiwan topo-
graphic maps
(TTM1950)
1950 1945-1950 1:250 000 The whole of Taiwan Province Colored polygon filled with pale green; dotted line boundaries, contour line and rivers; dotted features symbol http://www.utexas.edu/
Taiwan land use map (TLUM2010) 2010 2010 1:100 000 The whole of Taiwan Province Forest type polygon Liu et al., 2014

*Green, orange, and red marked plots for reserve forest, future planned reserve forest, and unwanted reserve forest, respectively.

2.3 Reconstruction method

The above four types of maps contain different data formats, expressions, and coordinate systems. To facilitate subsequent data comparison and analysis, the historical maps were unified in terms of data format, coordinate system, and expression methods according to the processing method depicted in Figure 4. The Krasovsky_1940_Albers projection system was used for the above dataset, and the GCS_Krasovsky_1940 coordinate system was adopted. The data were all in shp file format.
Figure 4 The framework of reconstruction processing of forest cover during 1910-2010
(1) The FIZ 1910 and FIZ1925 are paper maps that contain graticule information. First, the two maps were digitized and scanned into full-color electronic images in JPG format. Second, according to the graticule information on the maps, the georeferencing tool of ArcGIS 10.3 was used for spatial registration of the images. By referring to the administrative boundaries of Taiwan and location information of main features, the images are corrected. Next, the geographic elements of the historical maps were digitally interpreted using GIS technology. The FIZ1910 data focused on the interpretation of pink plots, while FIZ1925 focused on digitizing green and orange plots. The interpretation results were then stored as vector data. Finally, the digitized results of FIZ1910 and FIZ1925 were combined. After a series of processes (e.g., topological inspection, boundary correction, and attribute correction), the result was regarded as the forest distribution pattern of Taiwan in 1910, referred to as TLUM 1910.
(2) The TTM1950 is a full-color electronic image (JPG format) containing graticule information. Due to the high mapping accuracy, large scale, and finer outline of the element information, direct digital processing might cause a loss of some detailed forest information. Therefore, this study used a support vector machine (SVM) in ENVI software to refine the extraction of forest information after performing spatial registration and position correction on the map. First, we constructed six sample sets of forestland (green), water body (blue), residential area (orange), and other ground features (grey) according to the rendering colors of the ground features of the map; next, a certain number of samples were selected through the region of interest tool. Second, we input the constructed sample library into the SVM classifier of the supervision tool; then, an SVM was used to perform supervised classification on the map in order to obtain the classification results of different features. Next, we extracted the forestland in the classification results. We compared and evaluated the forestland, and manually corrected any inconsistent areas between the classification results and the actual map. Through a series of processes (e.g., ground feature correction, hole filling, map fusion, topological analysis), the Taiwan Forestland Vector Dataset in 1950 was obtained. The point-to-point and distribution pattern analyses on the map indicate the accuracy of the interpretation results is above 98%, which can be used for research.
(3) The TLUM2010 data was in vector format. According to the difference in canopy density and type, forestlands were divided into four secondary categories: woodland, shrubland, sparse woodland, and other woodlands. These four categories were regarded as the forest distribution area of Taiwan in 2010. Other factors (e.g., forest species and canopy density) were not taken into consideration.

3 Results

3.1 Forest change area in 1910-2010

Historical topographic and land cover maps were used to obtain detailed information about the forest change occurring in Taiwan Province from 1910 to 2010 (Figure 5). From a macro perspective, Taiwan’s forest area was 2.62×10⁶ ha in 1910. In 1950 and 2010, Taiwan’s forest areas were 2.36×10⁶ ha and 2.47×10⁶ ha, respectively. From the start to the end of the study, the FC has decreased from 73.02% to 68.61%, an overall decrease of 4.41%, or a mean annual loss of forest area of 1.59×10³ ha. The forest area in Taiwan has been decreasing in the past century, and forest reduction has been serious.
Figure 5 Spatial distribution of FC of Taiwan Province in 1910, 1950, and 2010
From the perspective of different research periods, the changing patterns of FC varied over time. From 1910 to 1950, the forest area in Taiwan changed significantly, with a total reduction of 26.39×10⁴ ha, or a mean annual reduction of 6.60×10³ ha, which resulted in a 7.35% decrease in FC. Based on the administrative boundaries of modern county-level subdivisions, aside from slight increase in the forest area in Keelung City and the counties of Taoyuan, Hsinchu, and Yilan, forest area in the remaining 18 counties and cities exhibited a downward trend. Among them, counties of Tainan, Yunlin, and Changhua experienced the most significant decreases with reductions in forest area of 4.43×10⁴ ha, 4.37×10⁴ ha, and 3.34×10⁴ ha, respectively. Forest loss in these three counties accounted for 46% of the area of total forest reduction. From 1950 to 2010, the forest area of Taiwan demonstrated an increasing trend, with a total increase of 10.53×10⁴ ha, or a 2.93% increase in FC. The change pattern of each city and county was opposite to what occurred in the previous period, with significant increase in forest area in many cities and counties, except for some areas with slight declines such as the counties of Hualien, Nantou, Taitung, Taichung, and Yilan. In a sense, the early 20th century in Taiwan was dominated by forest reduction, while in the later part increase and restoration had more obvious effects with a significant upward trend in FC.

3.2 Spatial dynamic of forest maintenance, gain, and loss

To understand the change of forest conditions in different time periods, the forest atlas datasets for different points in time were intersected and analyzed to obtain the change patterns of forest over time (Figure 6). Throughout the study period, the areas with continuous FC, conversion to forest, and conversion from forest to other land cover types covered 2.17×10⁶ ha, 0.45×10⁶ ha, and 0.29×10⁶ ha, respectively. The largest continuum forest area was located in the Central, Coastal, Xueshan, Yushan, and Alishan mountain ranges. During the study period, the overall pattern of the continuous FC patches did not change significantly. Nevertheless, the areas converted from forest to other land cover types were mainly found in the plain areas, namely, the Western, Pingtung, Huadong Rift Valley, and Yilan plains. Areas converted to forest were mainly found on the high and steep slopes of the Central and Xueshan mountain ranges.
Figure 6 FC change map of Taiwan Province from (a) 1910 to 1950, (b) 1950 to 2010, and (c) 1910-2010
In terms of time periods, the areas of forest converted to other land cover types and those converted to forest from 1910 to 1950 were 0.48×10⁶ ha and 0.21×10⁶ ha, respectively, where the former is 128.57% higher than the latter. Figure 6a indicates that forest reduction mainly occurred in plains with flat terrain and fertile soils, while forest restoration mostly occurred in the high mountains and steep slopes of the major mountain ranges. Most of the restored forests are located in areas that are unsuitable for human habitation or agricultural activities. From 1950 to 2010, the area of forest converted to other land cover types and those converted to forests were 0.18×10⁶ ha and 0.28×10⁶ ha, respectively; forest restoration increased significantly during this time period. The spatial change in forest was opposite to what occurred in the previous period. Forest reduction mainly occurred in the middle of the mountain range in Nantou County and the north of the Yilan Plain. No other areas witnessed significant forest reduction at the scale reviewed in this study were documented. Forest restoration primarily occurred in agricultural areas of the large western plains, in Pingtung Plain, and in the Taipei Basin. Overall, forest reduction in the first half of the 20th century mainly occurred in the plain areas dominated by agricultural activities, while the areas converted to forest were mostly in uninhabitable areas (e.g., high mountains, steep slopes, and inlands). Later, the transition pattern of forests changed, and forest restoration occurred in the plains. Most reduction occurred in the Central Mountain Range, with the exception of forest reduction in the northern part of the Yilan Plain.

4 Discussion

4.1 Uncertainty analysis

When data mining methods are used to extract land use information from historical topographic maps, the extracted land use information may be distorted. For example, the loss of the ground feature information may not be reflected on historical maps or the maps may have suffered from low compilation accuracy. Because of the lack of a large-scale topographic map, it is impossible to evaluate the accuracy of past spatial interpretation. By comparing the forest information acquired from data mining with statistical data, this study evaluated the reliability and uncertainty of the forest data for Taiwan in 1910 and 1950. The statistical summary of Taiwan (Data from the website: http://thcts.sinica.edu.tw/htwn_ch.htm) recorded the FC of Taiwan from 1907 to 1942. The forest areas documented in 1910 and 1942 covered 2.83×10⁶ ha and 2.21×10⁶ ha, respectively (the 1950 data were not available; thus the 1942 data were used instead). By comparing these with the forest area extracted in the present study, we can see that the forest area extracted in this study is 21.56×10⁴ ha lower (14.97×10⁴ ha) than that of the statistical yearbook in 1910 (1950), with a relative error of 7.59% (6.77%). Because the scale of historical topographic maps is too small to effectively reflect detailed features, the relative error is below 8%. Therefore, the extraction of FC information based on historical topographic maps in this study is basically considered to be reliable and accurate.
On the other hand, we have known the FC of TLUM2010 had four types, namely, woodland, shrubland, sparse woodland, and other woodlands. In this study, the four types of woodland having trees grown with different canopy densities have been merged into one type, i.e., forestland. We have no choice to extract the forestland and non-forestland but by the color (green) to distinguish the forestland plots in the FIZ1910, FIZ1925, and TTM1950 where the detailed relevant information of tree’s canopy density or forest types cannot be clearly distinguished except the location of forestland. This is a compromise way which may reduce the interpretation accuracy of FC.

4.2 Changes in FC from 1910 to 2010

To clarify the characteristics of changes in FC, the land cover status in 2010 was superimposed on the forest or non-forest areas in Taiwan in 1910. In this way, the changes of forest and non-forest areas in Taiwan from 1910 to 2010 were obtained (Figure 7). The analysis shows that after nearly 100 years of land use and reshaping of the environment, 29.46×10⁴ ha of non-forest areas in 1910 had been transformed into forest ecosystems, accounting for 30.39% of all non-forest areas in 1910. The transition and pattern of land use for forest-covered areas were apparent. A total of 45.32×10⁴ ha (i.e., 17.27% of the 1910 forest area) was converted into other land use types, except for an area of 217.08×10⁴ ha which has been maintained as forested land. Reduction was mainly caused by land clearing for agriculture, conversion to grassland, water encroachment on previously forested land, and urbanization, which accounted for 49.60%, 20.67%, 17.62%, and 11.44% of the lost forest area, respectively. Reduction in Taiwan over the past century was mainly driven by land clearing for agriculture which accounted for almost half of the reduced forest area, while urban and rural construction activities (together as urbanization) occupied a relatively small fraction of the reduced forest area (about 5.18×10⁴ ha).
Figure 7 The flow pattern from forest in 1910 to land cover in 2010
By examining the spatial pattern of the change in FC (Figures 5 and 6), one can see that agricultural reduction mainly occurred in the Western Plain, East Rift Valley Plain, and the northeastern part of the Yilan Plain. Most of these types of areas were distributed along inland rivers. Areas affected by agricultural reduction in counties of Yunlin, Hualien, Pingtung, Changhua, and Taitung were all more than 2×10⁴ ha. These flat areas are rich in water resources and fertile soil making them suitable for agricultural production, and are more likely to be prioritized in the process of clearing land for agriculture. The areas where forest had been converted to grassland were concentrated in the counties of Nantou, Hualien and Kaohsiung, with each county exceeding 1×10⁴ ha experiencing this type of conversion. Further analysis shows that most of the areas converted from forest to grassland were located in the middle of high-elevation mountains, or at the transitional zones of management boundaries between cities and counties. In addition, the forests in the northern part of Yilan County (mentioned above; 0.81×10⁴ ha) have been converted to grassland. The areas occupied by expanding water bodies were mainly located along the beaches and Zhuoshui River in the west, forming a concentrated distribution pattern. The areas of plantation and conversion of other land use types to forests were mainly distributed in the main port cities along the western coast, including the cities of Hsinchu and Kaohsiung as well as in counties of Yunlin, Changhua, Taichung, Taitung, and Hualien. Despite the sporadic conversion of forested land to other land uses in cities of Taipei and Keelung, no spatial agglomeration phenomenon was observed. The main urban areas or these port cities have expanded greatly in the past century, mainly by encroaching on forests to expand the scope of anthropogenic land use.

4.3 Relationship between the forest change and socioeconomic drivers

In the past hundred years, the changes in the spatial and temporal patterns of forests in Taiwan have been related to the administrative jurisdiction, changes in population, and forest protection policies. During the Japanese invaders ruled period (1895-1945), Taiwan was an important source of raw materials for Japan. The colonists paid little attention to the protection of forest resources. Massive reduction and land clearing caused a decline in forest area and a rapid expansion of cropland in Taiwan. According to the Statistical Summary of Taiwan in 51 Years and the Statistical Yearbook of Taiwan (Figure 8), the population of Taiwan during the Japanese ruled period increased from 3.12×10⁶ in 1905 to 6.59×10⁶ in 1943, an increase of 3.46×10⁶ people. During the same period, the total arable land increased from 62.45×10⁴ ha to 83.88×10⁴ ha, a total increase of 21.43×10⁴ ha. According to the statistical records related to reduction, a total of 32.92×10⁴ ha were deforested from 1922 to 1942, with a mean reduction rate of 1.65×10⁴ ha annually. After the Kuomintang retreated to Taiwan, the population of the island increased from 8.13×10⁶ in 1952 to 23.16×10⁶ in 2010, an increase of 15.03×10⁶ people. However, the total arable land decreased from 87.61×10⁴ ha in 1952 to 81.31×10⁴ ha in 2010. The area of arable land did not increase but decreased. In the early days, Taiwan experienced extensive reduction. In the past 20 years, the area of reduction has been limited to 100 ha, while the area of afforestation has continued to increase. Thus, forest vegetation has been effectively restored.
Figure 8 The population and farmland area of Taiwan Province from 1905 to 2010
After the Kuomintang retreated from the Chinese mainland to Taiwan in 1949, the government has put great emphasis on the ecological balance of the island and on ecologically based conservation of the forest. Management has transformed the function of forested land from the production of timber into ecological protection by introducing a few reforms related to forest protection, afforestation, and the designation and development of nature reserves (Yang, 1995; Jiang and Zhang, 1999). First, several forest management system documents were issued to provide forestry management policies, reform plans, management plans, and implementation rules. These strictly restricted reduction behavior and the scale of reduction, and clarified the designation of selective felling areas and the management of specific tree species. Second, a series of regulations and technical requirements related to afforestation, forest management, and forest stand transformation have been introduced. These encouraged tree planting and afforestation in areas such as the following: reforestation of barren hills, high mountains, farmland, coastal areas, and logging sites; forest tending such as weed management and pruning in existing forest areas; cultivation of natural broad-leaved forests in low- and medium-elevation areas; regeneration of coniferous forests in medium- and high-elevation areas; and transformation and management of desired forest vegetation types and phases. Afterwards, forest protection areas with national parks and nature reserves as the main body of forests were established. Kenting, Yushan, Yangmingshan, Taroko, and other national parks along with 34 nature reserves were designated over time, covering a total area of 33.6×10⁴ ha, which is sufficient to meet the currently desired conditions. These protected areas provide scientific, educational, and natural resource conservation functions in the reserve forest. Finally, the import and export structure of forest products was adjusted to restrict timber logging in the province generally. Most of the raw timber materials used in Taiwan come from imports; some raw timber products can then be exported and sold after extensive processing into various products.
Apparently, significant changes in land use in Taiwan over the last century mainly occurred during the Japanese colonial period. Widespread reduction and land clearing for agriculture occurred despite the slow population growth that occurred during the same period. In contrast, after the occupation of the Kuomintang, while the population has increased rapidly, the total amount of arable land has remained relatively stable with a moderate decline, and the forest area has been quickly restored.

5 Conclusions

By taking FC in Taiwan over the past century as the research object, this study applied multi-source data fusion and data mining methods to extract forest distribution information from historical forest thematic survey maps, historical topographic maps, and land cover map. We obtained the information related to the spatial and temporal changes of FC in Taiwan from 1910 to 2010. The research findings are as follows.
(1) The relative bias values of extracting FC area based on a historical atlas are all below 8%. By contrast, the obtained forest vegetation dataset of Taiwan has a relatively high level of accuracy. This method is suitable for investigating the long-term land use changes in areas with comprehensive historical records.
(2) In the past 100 years, the forest area in Taiwan has generally been decreasing, and forest reduction has been quite serious. In the whole study period, the FC has decreased from 73.02% to 68.61%, i.e., an overall decrease of 4.41%. In stages, forest reduction was obvious in the early stage from 1910 to 1950 when the total forest area declined by 26.39×10⁴ ha (7.35% decline); and forest restoration was remarkable in the later stage from 1950 to 2010 when the total forest area increased by 10.53×10⁴ ha (2.93% increase).
(3) Half of the historic forest area has been converted to cropland. Land clearing for agriculture has been the primary driving force of forest conversion in Taiwan in the past 100 years. This process occurred mainly during the Japanese colonization of Taiwan. After the Kuomintang retreated from the Chinese mainland to Taiwan, the reforms introduced related to forest protection, afforestation, and the designation and development of nature reserves have achieved remarkable results. The forest vegetation in many areas where the forest had disappeared has been effectively restored.
[1]
Aleman J C, Jarzyna M A, Staver A C, 2018. Forest extent and deforestation in tropical Africa since 1900. Nature Ecology & Evolution, 2: 26-33.

[2]
Brandolini F, Reynard E, Pelfini M, 2020. Multi-temporal mapping of the Upper Rhone Valley (Valais, Switzerland): Fluvial landscape changes at the end of the Little Ice Age (18th-19th centuries). Journal of Maps, 16(2): 212-221.

DOI

[3]
Cervera T, Pino J, Marull J et al., Understanding the long-term dynamics of forest transition: From deforestation to afforestation in a Mediterranean landscape (Catalonia, 1868-2005). Land Use Policy, 80: 318-331.

DOI

[4]
Chen Y Y, Huang W, Wang W H et al., 2019. Reconstructing Taiwan’s land cover changes between 1904 and 2015 from historical maps and satellite images. Scientific Reports, 9: 3643.

DOI

[5]
Ciupa T, Suligowski R, Ealek G, 2016. Use of GIS-supported comparative cartography and historical maps in long-term FC changes analysis in the holy cross mountains (Poland). Baltic Forestry, 22(1): 63-73.

[6]
Clawson M, 1979. Forests in the long sweep of American history. Science, 204(4398): 1168-1174.

PMID

[7]
Esser G, Hoffsradt J, Mack F et al., 1994. High-resolution biosphere model, documentation, model version 3.00.00[R]. Giessen: Justus-Liebig University.

[8]
Fan B M, Dong Y, 2001. Percentage of FC in different historic periods of China. Journal of Beijing Forestry University, 23(4): 60-65. (in Chinese)

[9]
Ge Q S, Dai J H, He F N et al., 2008. Research on land use and land cover change and carbon cycle of China during the past 300 years. Science in China Series D: Earth Science, 38(2): 197-210. (in Chinese)

[10]
Goldewijk K K, Beusen A, Doelman J et al., 2017. Anthropogenic land use estimates for the Holocene: HYDE3.2. Earth System Science Data, 9(2): 927-953.

DOI

[11]
Goldewijk K K, Beusen A, Drecht G V et al., 2011. The HYDE 3.1 spatially explicit database of human-induced global land-use change over the past 12 000 years. Global Ecology and Biogeography, 20(1): 73-86.

[12]
Han Z Q, Ran Y H, Liu J X et al., 2016. The changing distribution of rocky desertification in the Guangxi Region. 1930s to 2000. Acta Geographica Sinica, 71(3): 390-399. (in Chinese)

[13]
He F N, Ge Q S, Dai J H et al., 2008. Forest change of China in recent 300 years. Journal of Geographical Sciences, 18(1): 59-72.

DOI

[14]
He F N, Li S C, Zhang X Z, 2014. Spatially explicit reconstruction of FC of Southwest China in the Qing Dynasty. Geographical Research, 33(2): 260-269. (in Chinese)

[15]
He F N, Li S C, Zhang X Z, 2015. A spatially explicit reconstruction of FC in China over 1700-2000. Global and Planetary Change, 131: 73-81.

DOI

[16]
Hou R L, Yang Y D, Man Z M, 2020. Gridded reconstruction of spatiotemporal evolution of cropland in the Zhangjiu River Basin in Yunnan Province from 1700 to 1978. Acta Geographica Sinica, 75(9): 1966-1982. (in Chinese)

[17]
Houghton R, Hackler J, 1999. Emissions of carbon from forestry and land-use change in tropical Asia. Global Change Biology, 5(4): 481-492.

DOI

[18]
Houghton R, Hobbie J, Melillo J et al., 1983. Changes in the carbon content of terrestrial biota and soils between1860 and 1980: A net release of CO2 to the atmosphere. Ecological Monographs, 53(3): 236-262.

[19]
Jiang H Z, Zhang F H, 1999. National forest parks in Taiwan. World Forestry Research, 12: 37-41. (in Chinese)

[20]
Jiang W T, 2015. Research on urban population of Jiangnan in the Republic of China based on GIS and the data of topographic maps. Researches in Chinese Economic History, (4): 39-56. (in Chinese)

[21]
Kaplan J, Krumhardt K, Zimmermann N, 2009. The prehistoric and preindustrial deforestation of Europe. Quaternary Science Reviews, 28(27/28): 3016-3034.

DOI

[22]
Li H, 1997. Three formulations of converting ancient Mu into modern Mu. Agricultural History of China, 16(3): 5-7. (in Chinese)

[23]
Li J, Ye Y, Wei X Q, 2019. Reconstruction of cropland change in the southern area of the Daqing River Basin over the past 300 years. Progress in Geography, 38(6): 883-895. (in Chinese)

[24]
Li S, He F, Zhang X, 2014. An approach to spatially explicit reconstruction of historical forest in Northeast China. Journal of Geographical Sciences, 24 (6): 1022-1034.

DOI

[25]
Lian L C, Wan Z W, Ju M et al., 2020. Reconstruction of the cropland area and its spatial distribution pattern at Dongting lake district of Hunan province in the middle of the Republic of China. Journal of Geo-information Science, 22(5): 989-996. (in Chinese)

[26]
Liao Y S, 2016. Analysis of basic topographic map of China: Data from the United States Army Cartographic Office in 1954. China Surveying and Mapping, 3: 58-59. (in Chinese)

[27]
Lin D, 1983. The changes of forest resources in China. Agricultural History of China, 2: 26-36. (in Chinese)

[28]
Liu J Y, Kuang W H, Zhang Z X et al., 2014. Spatiotemporal characteristics, patterns and causes of land use changes in China since the late 1980s. Acta Geographica Sinica, 69(1): 3-14. (in Chinese)

[29]
Liu J Y, Zhang Z X, Zhuang D F et al., 2003. A study on the spatial temporal dynamic changes of land use and driving forces analyses of China in the 1990s. Geographical Research, 22(1): 1-12. (in Chinese)

[30]
Liu M, Tian H, 2010. China’s land cover and land use change from 1700 to 2005: Estimations from high-resolution satellite data and historical archives. Global Biogeochemical Cycles, 24(3): 285-286.

[31]
Miao L, Zhu F, He B et al., 2013. Synthesis of China’s land use in the past 300 years. Global and Planetary Change, 100: 224-233.

DOI

[32]
Pongratz J, Reick C, Raddatz T et al., 2008. A reconstruction of global agricultural areas and land cover for the last millennium. Global Biogeochemical Cycles, 22(3): 147-147.

[33]
Ramankutty N, Foley J, 1999. Estimating historical changes in global land cover: Croplands from 1700 to 1992. Global Biogeochemical Cycles, 13(4): 997-1028.

DOI

[34]
Shi N, 1991. On the historical distribution and vicissitude of the national vegetation of China. Collections of Essays on Chinese Historical Geography, 3: 43-73. (in Chinese)

[35]
Steyaert L, Knox R, 2008. Reconstructed historical land cover and biophysical parameters for studies of land-atmosphere interactions within the eastern United States. Journal of Geophysical Research Atmospheres, 113(D2): 194-204.

[36]
Szypula B, 2020. Digital adaptation of the Geomorphological Map of Upper Silesian Industrial Region, Poland (1:50,000): Old map new possibilities. Journal of Maps, 16(2): 614-624.

DOI

[37]
Tian H, Banger K, Bo T et al., 2014. History of land use in India during 1880-2010: Large-scale land transformations reconstructed from satellite data and historical archives. Global and Planetary Change, 121: 78-88.

DOI

[38]
Wan Z W, Jia Y L, Jiang M X et al., 2018. Reconstruction of urban land use and urbanization level in Jiangxi Province during the Republic of China period. Acta Geographica Sinaca, 73(3): 550-561. (in Chinese)

[39]
Wei X, Ye Y, Zhang Q et al., 2019. Reconstruction of cropland change in North China Plain area over the past 300 years. Global and Planetary Change, 176: 60-70.

DOI

[40]
Yang D S, 1995. The current situation of Taiwan forestry. World Forestry Research, (4): 50-56. (in Chinese)

[41]
Yang F, He F N, Li S C et al., 2019a. Exploring spatiotemporal pattern of grassland cover in western China from 1661 to 1996. International Journal of Environmental Research and Public Health, 16: 3160.

DOI

[42]
Yang X, Jin X, Du X et al., 2016a. Multi-agent model-based historical cropland spatial pattern reconstruction for 1661-1952, Shandong Province. Global and Planetary Change, 143: 175-188.

DOI

[43]
Yang X, Jin X, Guo B et al., 2015. Research on reconstructing spatial distribution of historical cropland over 300 years in traditional cultivated regions of China. Global and Planetary Change, 128: 90-102.

DOI

[44]
Yang X H, Jin X B, Lin Y N et al., 2016b. Review on China’s spatially-explicit historical land cover datasets and reconstruction methods. Progress in Geography, 35(2): 159-172. (in Chinese)

[45]
Yang X H, Jin X B, Xiang X M et al., 2018. Reconstructing the spatial pattern of historical forest land in China in the past 300 years. Global and Planetary Change, 165: 173-185.

DOI

[46]
Yang X H, Jin X B, Xiang X M et al., 2019b. Carbon emissions induced by farmland expansion in China during the past 300 years. Science China Earth Science, 62(2): 423-437.

DOI

[47]
Ye Y, Fang X, Zhang X et al., 2009. Coverage changes of forestland and grassland in northeastern China during the past 300 years. Journal of Beijing Forestry University, 31(5): 137-144. (in Chinese)

Options
Outlines

/