Research Articles

Simulation of land-cover change in Jing-Jin-Ji region under different scenarios of SSP-RCP

  • FAN Zemeng 1, 2, 3
Expand
  • 1. State Key Laboratory of Resources and Environmental Information System, Institute of Geographic Sciences and Natural Resources Research, CAS, Beijing 100101, China
  • 2. College of Resources and Environment, University of Chinese Academy of Sciences, Beijing 100049, China
  • 3. Jiangsu Center for Collaborative Innovation in Geographical Information Resource Development and Application, Nanjing 210023, China

Received date: 2021-02-25

  Accepted date: 2021-11-12

  Online published: 2022-05-25

Supported by

National Key R&D Program of China(2017YFA0603702)

National Key R&D Program of China(2018YFC0507202)

National Natural Science Foundation of China(41971358)

National Natural Science Foundation of China(41930647)

Strategic Priority Research Program (A) of the Chinese Academy of Sciences(XDA20030203)

Innovation Research Project of State Key Laboratory of Resources and Environment Information System, CAS

Abstract

How to simulate land-cover change, driven by climate change and human activity, is not only a hot issue in the field of land-cover research but also in the field of sustainable urbanization. A surface-modeling method of land cover scenario (SSMLC) driven by the coupling of natural and human factors was developed to overcome limitations in existing land-cover models. Based on the climatic scenario data of CMIP6 SSP1-2.6, SSP2-4.5, and SSP5-8.5 released by IPCC in 2020, which combines shared socioeconomic paths (SSPs) with typical concentration paths (RCPs), observation climatic data concerning meteorological stations, the population, GDP, transportation data, land-cover data from 2020, and related policy refences, are used to simulate scenarios of land-cover change in the Jing-Jin-Ji region using SSP1-2.6, SSP2-4.5, and SSP5-8.5 for the years 2040, 2070 and 2100, respectively. The simulation results show that the total accuracy of SSMLC in the Jing-Jin-Ji region attains 93.52%. The change intensity of land cover in the Jing-Jin-Ji region is the highest (plus 3.12% per decade) between 2020 and 2040, gradually decreasing after 2040. Built-up land has the fastest increasing rate (plus 5.07% per decade), and wetland has the fastest decreasing rate (minus 3.10% per decade) between 2020 and 2100. The change intensity of land cover under scenario SSP5-8.5 is the highest among the abovementioned three scenarios in the Jing-Jin-Ji region between 2020 and 2100. The impacts of GDP, population, transportation, and policies on land-cover change are generally greater than those on other land-cover types. The results indicate that the SSMLC method can be used to project the change trend and intensity of land cover under the different scenarios. This will help to optimize the spatial allocation and planning of land cover, and could be used to obtain key data for carrying out eco-environmental conservation measures in the Jing-Jin-Ji region in the future.

Cite this article

FAN Zemeng . Simulation of land-cover change in Jing-Jin-Ji region under different scenarios of SSP-RCP[J]. Journal of Geographical Sciences, 2022 , 32(3) : 421 -440 . DOI: 10.1007/s11442-022-1955-z

1 Introduction

Global change is the most complicated eco-environmental problem facing human beings in the 21st century (Turner et al., 1995). Since the International Geosphere-Biosphere Program (IGBP) and the Global Environmental Change Research Program (IHDP) jointly proposed the “Land-Use and Land-cover Change” (LUCC) core research program in 1995, land-cover change has been one of the core topics in the field of global change (Vitousek et al., 1997; Yue et al., 2007b). Land-cover change, as the main cause of global environmental change (Fan et al., 2005), directly affects biogeochemical cycles (Solomon, 1986), soil erosion, and biodiversity (Whittaker, 1972). This causes structural changes in ecosystem services (Fan et al., 2015), and affects the carrying capacity and sustainable development of ecosystems, and therefore, human society (Belotelov et al., 1996; Hochstrasser et al., 2002; Fan et al., 2013). Therefore, the surface modeling of land cover is important in predicting the effects of global climate change in ecosystems; such modeling could help to improve adaptation strategies for land-cover change and climate change.
Since the 1990s, many researchers have built prediction models for land-cover change involving various objects and scales. These include the Input-Output (I-O) model, for analyzing the economic utility of regional land-cover change (Oshiaki IchinoSe, 2003); the Integrated Model to Assess the Greenhouse Effect (IMAGE), for simulating agricultural ecological processes (Alcamo et al., 1994); the Conversion of the Use and Land ITS Effects (CLUE) model, for simulating land-use conversion and impact (Verburg et al., 1999; 2002); the Cellular Automata (CA) model (Clarke et al., 1997); the System Dynamics (SD) model (He et al., 2005), for simulating urban-land-use change; the Future-Land-Use Simulation (FLUS) model, integrating the CA and SD models (Liu et al., 2017); and the Surface Modeling of Land Cover (SMLC) model, driven by natural climate change (Fan et al., 2005; Yue et al., 2007b; Fan et al., 2015). They can be classified into four types of statistical model, random model, dynamic model, and integrated model. However, IMAGE mainly considers the demand for agricultural land, and does not consider the impacts of climate change and socioeconomic development on land-cover change. The CA model is mainly used to simulate urban-land-use change, and focuses on the mutual transformation among different urban-land types during urban development. This model does not consider the impacts of climate change on forest, grassland, and other land-cover types. The SD model is commonly used to simulate land-cover change in short time scales, and therefore does not meet the needs inherent to simulating land cover driven by the coupling of both natural and human factors in long time scales. The FLUS model combined with the CA and SD models can be used to simulate urban-land change at a regional scale, but it does not consider the impacts of climate change on forest, grassland, desert, and other land-cover types. The current SMLC model can effectively project land-cover types that are relatively less disturbed by human activity (e.g., forest and grassland) over long time scales (Fan et al., 2005; Yue et al., 2007b; Fan et al., 2015; Fan et al., 2020). According to the above reviews, the SMLC model is the best for simulating land-cover change in the Jing-Jin-Ji (Beijing-Tianjin-Hebei) region under different scenarios over a long time scale (Fan et al., 2020).
Since the beginning of the 21st century, to elucidate the balance between rapid economic development and eco-environmental sustainability in the megalopolis regions (Fang, 2015; Lu, 2015), a theoretical framework and technical path have been developed. They can facilitate the discussion of the interactive effects between urbanization and eco- ironmental conservation in the strategic core region of economic development and new urbanization in China (Fang, 2017; Fang et al., 2017). Moreover, the dynamic characteristics of urban-agglomeration-land expansion (Ouyang and Zhu, 2020), the development of land- transportation networks (Chen and Lu, 2008; Fan, 2008; Chen et al., 2018), the expansion patterns and their driving force of urbanization (Wang and Feng, 2016; Wang et al., 2018), and the structural update of industry (Zhu, 2009) have been studied since 2000. However, existing researches are mainly focused on the change trend and expansion pattern of urban-land-use types in urbanization, and not on projecting land-cover scenarios against the background of climate chage and human activity for the whole Jing-Jin- Ji region. This region, containing the Jing- Jin-Ji megacity cluster (Figure 1), has a high concentration of population and industry. Tensions inherent to the human-land relationship, therefore, have become increasingly prominent, especially since the coordinated and integrated development of Jing-Jin-Ji region updated a national strategy. Thus, for the simulation of land-cover change under the different scenarios of climate change and human activity, it is helpful to balance the effects of highly coordinated development and eco-environmental sustainability in the Jing-Jin-Ji region.
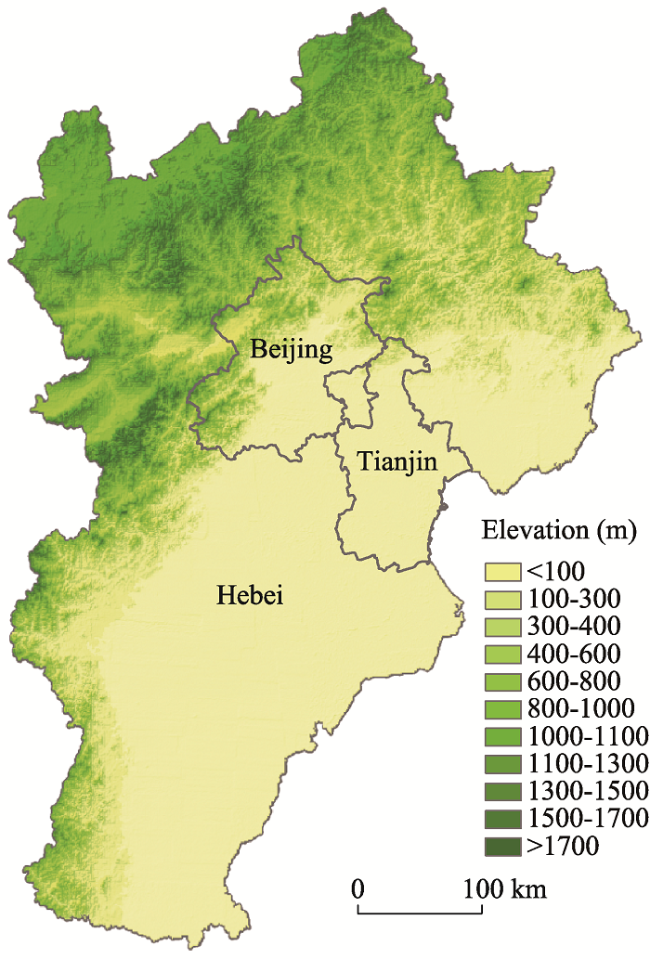
Figure 1 The boundary and DEM of Jing-Jin-Ji region
To achieve an optimal balance between rapid coordinated and integrated development and eco-environmental sustainability in the Jing-Jin-Ji region, the simulation of land cover driven by climate change and human activity is urgently required. This paper aims to improve the SMLC model to simulate land-cover change under different scenarios. This involves integrating the driving factors of climate change and human activity, combined with data concerning population, GDP and traffic, coordinated development of the Jing-Jin-Ji region, policies of basic farmland protection and nature reserves, and the climate data of CMIP6 under the scenarios of SSP1-2.6, SSP2-4.5, and SSP5-8.5, formed by shared socioeconomic paths (SSPs) and typical concentration paths (RCPs) released by IPCC in 2020. Moreover, the change trends of land cover under different scenarios from 2020 to 2100 will be discussed. The simulated results can be used for related projects involving urbanization optimization and eco-environmental sustainability in the Jing-Jin-Ji region.

2 Data and method

2.1 Collection and analysis of basic data

The data used in the simulation of land cover for the Jing-Jin-Ji region include climate data, topographic data, socioeconomic data, and the boundary data of a nature reserve. Climate data include observation data and scenario data. Observation climate data from 1961 to 2020 were collected from 176 meteorological stations located in the Jing-Jin-Ji region and its surrounding areas (Zhao et al., 2019). The climate scenario data included the scenarios of CMIP6 SSP1-2.6, SSP2-4.5, and SSP5-8.5 from 2020 to 2100, downloaded from the website: World Climate Research Programme(https://esgf-node.llnl.gov/projects/cmip6/). The SSP1- 2.6 represents a scenario under the influence of low mitigation pressure and low radiative forcing, and is also called a sustainable development scenario. The SSP2-4.5 represents a scenario of moderate radiative forcing, and maintains the current socioeconomic, scientific, and technological development trends. The SSP5-8.5 represents a scenario of high radiative forcing, of a high-speed development path dominated by fossil fuels (Zhang et al., 2019; Su et al., 2021).
The current land cover data for the Jing-Jin-Ji region in 2010 and 2020 were collected from the website: Resource and Environment Science and Data Center(https://www.resdc.n/) and classified into 11 types during the operation of the model. They were evergreen coniferous forest, deciduous coniferous forest, deciduous broad-leaved forest, mixed forest, scrubs, grassland, wetlands, cultivated land, built-up land, bare or sparse vegetation, and water bodies on the basis of distribution characteristics of land cover in Jing-Jin-Ji region and the classification principle of IGBP in land cover (Liu et al., 2009; Zhang et al., 2020). DEM data were collected from the SRTM data released by NASA(http://srtm.csi.cgiar.org/) with a resolution of 1 km × 1 km, and interpolated to 1 km × 1 km resolution by running the spatial interpolation method in ArcGIS. Boundary data from nature reserves were collected from the Ministry of Environmental Protection, Forestry Administration, National Bureau of Surveying and Mapping, and National Basic Geographic Information Center. High-resolution, remote-sensing-image data, vectorized by ArcGIS, were used (Yue et al., 2006; Fan et al., 2019).

2.2 High-accuracy simulation of climate parameters

The spatial-data accuracy of the three climate parameters, mean annual biotemperature (MAB), total annual precipitation (TAP), and potential evapotranspiration ratio (PER), directly influenced the reliability of the simulation results concerning land-cover scenarios (Fan et al., 2020). In order to ensure the simulation accuracy of the climate parameters, the Inverse Distance Weighted (IDW), Kriging, Spline, and High-Accuracy Surface Modeling (HASM) methods (Yue, 2011; Yue et al., 2006; 2007a; 2016; 2020; Fan et al., 2019), were respectively adopted to interpolate the MAB and TAP by integrating the longitude, latitude, and elevation data for the Jing-Jin-Ji region from 1991 to 2020 (T0). The simulation errors in TAP using the HASM, IDW, Kriging, and spline models are 26.21 mm, 107.52 mm, 51.79 mm, and 87.26 mm, respectively. The simulation errors in MAB are, respectively, 0.27°C, 0.98°C, 0.61°C, and 0.83°C. The results show that the accuracy of the HASM method for MAB and TAP is higher than that for the other models. Therefore, the HASM method is selected to interpolate the MAB and TAP data with a 1 km × 1 km resolution under the three scenarios, SSP1-2.6, SSP2-4.5, and SSP5-8.5, for the Jing-Jin-Ji region in 2020, 2040, 2070, and 2100. The PER data under the three scenarios are respectively calculated based on the interpolated data of MAB and TAP for 2020, 2040, 2070, and 2100.

2.3 Scenarios of surface modeling in land cover

Using key climate parameters, such as the annual average biological temperature, annual precipitation, and PER, an improved model of a natural-vegetation-ecosystem Holdridge Life Zone (HLZ) (Holdridge, 1947; Yue et al., 2005; 2020; Fan et al., 2019) was used to obtain the future scenarios of the natural vegetation ecosystem for 2020, 2040, 2070, and 2100, with a 1 km × 1 km resolution for the three scenarios, SSP1-2.6, SSP2-4.5, and SSP5-8.5, in the Jing-Jin-Ji region, respectively. Based on the characteristics of spatial similarity and consistency between the natural-vegetation-ecosystem type and the land-cover type in the spatial distribution, this paper constructed a land-cover scenario surface-modeling method (Scenario of Surface Modeling of Land Cover, SSMLC) driven by natural and human elements. This method combines the status quo of land cover and the quantitative factors of the spatial distribution ratios of various types, and comprehensively considered human factors such as traffic density, population density, and per capita GDP, as well as the driving impact of coordinated development planning of the Jing-Jin-Ji region, basic farmland on land-cover change and nature reserves and other policies and measures. The method includes the following three key technical steps.
2.3.1 Calculation of the corresponding probability between the natural-vegetation- ecosystem type and the land cover type
First, the input parameter form of the HLZ model is corrected from having discrete points to continuous spatial grid units to simulate the spatial distribution of the natural-vegetation- ecosystem types in different periods (Yue et al., 2007b). The modified model can be characterized as:
${{D}_{i}}(x,y,t)=\sqrt{{{(BT(x,y,t)-LB{{T}_{i0}})}^{2}}+{{(LR(x,y,t)-LR{{T}_{i0}})}^{2}}+{{(LP(x,y,t)-LP{{T}_{i0}})}^{2}}}$
where BT(x,y,t), LR(x,y,t), and LP(x,y,t) are the base-2 logarithms of the annual average biological temperature, total annual precipitation, and PER at site $(x,y)$ for period $t$; LBTi0, LRTi0, and LPTi0 are the standard values of the annual average biological temperature, annual precipitation, and annual PER at the spatial location represented by the i-th natural-vegetation-ecosystem type in the HLZ-model-discrimination system. When ${{D}_{j}}(x,y,t)=$ $min\{{{D}_{i}}(x,y,t)\}$, the value at site $(x,y)$ in period t is assigned to the j-th type of the natural-vegetation-ecosystem type. According to the SSP1-2.6, SSP2-4.5, and SSP5- 8.5 scenarios (with a resolution of 1 km × 1 km), the annual average biological temperature, average annual precipitation, and potential evapotranspiration data for the four periods of 2020, 2040, 2070, and 2100, the revised HLZ model of the natural vegetation ecosystem was run to obtain the spatial distribution data of the future scenarios of the natural vegetation ecosystem in the four periods of the above three scenarios.
Using the ArcGIS-spatial-overlay-analysis method, the land-cover type of each grid unit and the natural-vegetation-ecosystem type of the corresponding period are spatially overlapped; the similarity and consistency of their spatial distribution patterns are compared and analyzed. On this basis, the spatial data of the natural-vegetation-ecosystem type during the simulation period is added, and the corresponding probability of the natural-vegetation- ecosystem type and land-cover type in the spatial distribution is calculated. The theoretical formula for the specific calculation can be represented as:
$HL\_P{{(x,y)}_{k,t+1}}=\frac{1}{2}\left( 1+\frac{HLZP{{(x,y)}_{k,t+1}}-HLZP{{(x,y)}_{k,t}}}{HLZP{{(x,y)}_{k,t+1}}+HLZP{{(x,y)}_{k,t}}} \right)$
where $HLZP{{(x,y)}_{k,t}}$ and $HLZP{{(x,y)}_{k,t+1}}$ characterize the probability that the natural- vegetation-ecosystem type at site (x, y) in the periods t and t+1 corresponds to the k-th land-cover type in period t; and $HL\_P{{(x,y)}_{k,t+1}}$ characterizes the comprehensive corresponding probability between the natural-vegetation-ecosystem type at site (x, y) and the k-th land-cover type in the periods t and t+1.
2.3.2 Spatial analysis model of the maximum probability of the land-cover change
In order to overcome the uncertain impact of large numerical differences among the population data, GDP data, traffic data, land-cover-type-distribution-probability data in period t, and natural-vegetation-ecosystem-distribution-probability data in period t+1 on model operation, the above data are normalized with mean value of 0 and variance of 1 respectively. The specific-spatial-normalization-calculation formula can be expressed as follows:
$\overline{P I(x, y)_{k, t}}=\frac{PN{{(x,y)}_{k,t}}-\overline{P{{N}_{k,t}}}}{\sigma (PN{{(x,y)}_{k,t}})}$
$\overline{E I(x, y)_{k, t}}=\frac{GDP{{(x,y)}_{k,t}}-\overline{GD{{P}_{k,t}}}}{\sigma (GDP{{(x,y)}_{k,t}})}$
$\overline{T I(x, y)_{k, t}}=\frac{TD{{(x,y)}_{k,t}}-\overline{T{{D}_{k,t}}}}{\sigma (TD{{(x,y)}_{k,t}})}$
$\overline{L P(x, y)_{k, t}}=\frac{LP{{(x,y)}_{k,t}}-\overline{L{{P}_{k,t}}}}{\sigma (LP{{(x,y)}_{k,t}})}$
$\overline{H L_{-} P(x, y)_{k, t+1}}=\frac{HL\_P{{(x,y)}_{k,t+1}}-\overline{HL\_{{P}_{k,t+1}}}}{\sigma (HL\_P{{(x,y)}_{k,t+1}})}$
Where $\overline{P I(x, y)_{k, t}}, \overline{E I(x, y)_{k, t}}, \overline{T I(x, y)_{k, t}}$, and $\overline{L P(x, y)_{k, t}}$ are the normalized population- spatial-distribution-density coefficient, the per-capita-GDP-spatial-distribution-density coefficient, the traffic-accessibility-spatial-distribution-density coefficient corresponding to the k-th land-cover type, and the percentage-coefficient-of-land-cover-type distribution at site (x, y) in period t. x $\overline{H L_{-} P(x, y)_{k, t+1}}$. is the normalized-distribution-probability coefficient of the natural-vegetation-ecosystem type corresponding to the k-th land-cover type at site (x, y) in period t. $PN{{(x,y)}_{k,t}}$, $GDP{{(x,y)}_{k,t}}$, $TD{{(x,y)}_{k,t}}$, and $LP{{(x,y)}_{k,t}}$characterize the population-density value, traffic-accessibility value, per-capita-GDP value, and probability value of the land-cover-type distribution corresponding to class k land-cover type at site (x, y) in period t. $HL\_P{{(x,y)}_{k,t+1}}$characterizes the distribution-probability value of the natural-vegetation-ecosystem type corresponding to the k-th land-cover type at site (x, y) in period t. $\overline{P{{N}_{k,t}}},\ \overline{GD{{P}_{k,t}}},\ \overline{T{{D}_{k,t}}},\ \text{and}\ \overline{L{{P}_{k,t}}}$, characterize the population density, per-capita GDP, traffic accessibility, and mean value of the distribution probability of land-cover type distributed at site (x, y) in period t. PN(x, y)k,t characterizes the mean value of the natural vegetation ecosystem at site (x, y) in period t. σ characterizes the overall standard deviation of the parameter.
To examine the different effects of human activity and policies on land-cover change in built-up areas, suburban areas, and rural areas in Jing-Jin-Ji, a spatial-analysis model that quantitatively identifies the maximum probability of land-cover change on a grid unit is constructed. The model uses geographically weighted regression (GWR) based on the normalized-population-distribution-density coefficient (PI), per-capita-GDP-density coefficient (EI), traffic-accessibility coefficient (TI), land-cover-type-distribution-probability coefficient (LP), and natural-vegetation-ecosystem-type-distribution-probability coefficient (HL_P). The theoretical formulas can be expressed as follows:
$L C_{-} P\left(x_{i}, y_{j}\right)_{k, t+1}=\alpha\left(x_{i}, y_{j}\right) \times \overline{P I\left(x_{i}, y_{j}\right)_{k, t}}+\beta\left(x_{i}, y_{j}\right) \times \overline{E I\left(x_{i}, y_{j}\right)_{k, t}}+\gamma\left(x_{i}, y_{j}\right) \times \\ \overline{T I\left(x_{i}, y_{j}\right)_{k, t}}+\delta\left(x_{i}, y_{j}\right) \times \overline{L P\left(x_{i}, y_{j}\right)_{k, t}}+\omega\left(x_{i}, y_{j}\right) \times \overline{H L_{-} P(x, y)_{k, t+1}}$
$\text{ }\!\!~\!\!\text{ }LC\_T{{({{x}_{i}},{{y}_{j}})}_{\text{ }\!\!~\!\!\text{ }t+1}}=Value{{(k)}_{Max\{LC\_P{{({{x}_{i}},{{y}_{j}})}_{k,\text{ }\!\!~\!\!\text{ }t+1}}|k=1,2,3\ldots \ldots 12\}}}$
where $LC\_P{{({{x}_{i}},{{y}_{j}})}_{k,\ t+1}}$. characterizes the probability of type k-th land cover at site (xi, yj) in the period t+1; $\overline{L C_{-} T(x_{i}, y_{i})_{t+1}}$ characterizes the most likely land-cover type at site (xi, yj) in the period t+1; k = 1, 2, 3,..., 12 characterizes the numerical code of 11 land-cover types; α, β, γ, δ, ε and ω characterize the weight coefficients of each factor in the land-cover type, which use the k-nearest neighbor kernel function to obtain α + β + γ + δ + ε + ω = 1. The meaning of the other parameters is the same as the above.
2.3.3 Limiting rules for the impact of policy measures on land-cover change
In the context of a coordinated development strategy for the Jing-Jin-Ji region, the development and utilization of land resources must adhere to the premise of ecological priority and the principle of regional integration and coordinated development. Therefore, taking into account the relevant regulations and policies of the National Natural Package Reserve (NR) within the region, the Key Ecological Function Area (ER), which returns farmland to forest and grassland, basic farmland protection (BC), and the coordination-development strategy in Jing-Jin-Ji, the following restrictions on land-cover change have been formulated: A land-cover type in the NR area is prohibited from being converted to cultivated land and built-up land; a land-cover type in the ER area is prohibited from being converted to built-up land; a land-cover type with a slope (SLOPE) greater than 25 degrees is prohibited from being converted to agricultural land, and land-cover types in the BC area are prohibited from being converted to any land-cover type, other than cultivated land. The above restrictions can be expressed by the following logical judgment formulas:
if $\left\{\begin{array}{l}\text { LC___ } T\left(x_{i}, y_{j}\right)_{t} \in N R, L C_{-} T\left(x_{i}, y_{j}\right)_{t+1} \neq \text { Lcrop } \cup \text { Lbuilt } \\ L C_{-} T\left(x_{i}, y_{j}\right)_{t} \in E R, L C_{-} T\left(x_{i}, y_{j}\right)_{t+1} \neq \text { Lbuilt } \\ S L O P E\left(x_{i}, y_{j}\right) \geqslant 25, L C_{-} T\left(x_{i}, y_{j} x, y\right)_{t+1} \neq \text { Lcrop } \\ L C_{-} T\left(x_{i}, y_{j}\right)_{t} \in B C, L C_{-} T\left(x_{i}, y_{j}\right)_{t+1}=\text { Lcrop }\end{array}\right.$
where $LC\_T{{(x,y\text{)}}_{t}}$ characterizes the land-cover type at site (x, y) in the period t; $SLOPE(x,y)$ characterizes the slope at site (x, y) in the period t; and $Lcrop$ and $Lbuilt$ characterize cultivated land and built-up land.
In the process of simulating the spatial distribution of land-cover types in the t+1 period, formula (8) is first used to solve the possibility probability of various land-cover types in all the grid units of the whole study area in the t+1 period. Formula (9) is then used to identify the land-cover types with the maximum possibility probability of grid units (xi, yj) in the t+1 period. Combined with the logical judgment formula (10) of the land-cover type restriction rule, the maximum possible value of land-cover type for each grid unit (xi, yj) in the t+1 period is assigned and solved. In the process of using the discrimination conditions of the limiting rules, if the maximum value of formula (9) does not meet any of the conditions of formula (10), the type with the second possibility probability value of land-cover type in formula (9) shall be used for assignment, and so on, until the land-cover type of each grid unit (xi, yj) in the t+1 period is assigned, Finally, the spatial simulation analysis of land cover in the t+1 period for the whole study area is realized. In addition, in order to reduce uncertainty in the simulation results (arising from an over-long time scale for t simulation) after obtaining the simulation results for the land-cover spatial distribution in the t+1 period, the simulated land-cover data in the t+1 period are used as the starting and verification data for the t+2 period simulation; the above steps are then repeated, and then realize the simulation of land cover spatial distribution in t+2 period. In the simulation, the above methods and steps are repeated until the land-cover change simulation in all periods is realized.

3 Results

3.1 Model-accuracy verification

In order to ensure the reliability of the simulation results, the overall accuracy evaluation method and Kappa coefficient verification method are used to compare and analyze the model simulation data with the current data concerning land cover in Beijing, Tianjin, and Hebei for 2020. The calculation method of simulation accuracy verification is as follows:
${{P}_{ATA}}=\underset{i=1}{\overset{k}{\mathop \sum }}\,{{p}_{ii}}/N$
$KI=\frac{N\mathop{\sum }_{i=1}^{k}{{p}_{ii}}-\mathop{\sum }_{i=1}^{r}({{p}_{i+}}{{p}_{+i}})}{{{N}^{2}}-\mathop{\sum }_{i=1}^{m}({{p}_{i+}}{{p}_{+i}})}$
where PATA is the overall accuracy of the model simulation; KI is the Kappa coefficient of the model simulation; N is the total number of grids in the Jing-Jin-Ji region; k is the quantity of land-cover types (M = 12); pii is the number of grids whose simulated value of the i-th land-cover type is the same as that of the current data; pi+ is the number of grids of the i-th land-cover type in the current situation data; and p+i is the number of grids of the i-th land-cover type in the simulation data.
Simulation accuracy verification shows that the overall accuracy of the model for the land cover simulation in Jing-Jin-Ji in 2020 is 93.52%, and that of the Kappa coefficient is 93.07%. In order to verify the accuracy of each land-cover type simulated by the model, the simulation accuracy of the current value and simulation value of each land-cover type are calculated, respectively, based on the land-cover simulation data and current data of Jing-Jin-Ji in 2020 (Table 1). In Table 1, except for the simulation accuracy of deciduous broad-leaved forest, which is 87.90%, the simulation accuracy of the other land-cover types is higher than 90%. The above validation analysis shows that the model can effectively simulate the land-cover types in the Jing-Jin-Ji region.
Table 1 Comparative analysis of accuracy for each land-cover type in the Jing-Jin-Ji region (km2)
Land-cover type Current value of land cover in 2020 (km2) Simulation value of land cover in 2020 (km2) Simulation accuracy (%)
Evergreen coniferous forest 1206 1275 94.28
Deciduous coniferous forest 2561 2801 90.63
Deciduous broad-leaved forest 20456 22931 87.90
Mixed forest 1507 1582 95.02
Scrubs 17490 19079 90.91
Grassland 32923 31153 94.62
Wetlands 3007 2879 95.74
Cultivated land 124170 121162 97.58
Built-up land 8901 9475 93.55
Bare or sparse vegetation 709 665 93.79
Water bodies 1979 1907 96.36

3.2 Spatial pattern and change of land-cover distribution in Jing-Jin-Ji region

By analyzing the simulation results for the Jing-Jin-Ji region (Figure 2-4) based on the three scenarios of SSP1-2.6, SSP2-4.5, and SSP5-8.5, we found that land cover shows the following distribution pattern: Evergreen coniferous forest is mainly distributed in mountainous areas 800-1500 m in the east of the Taihang Mountains; deciduous coniferous forest is mainly distributed in the north of the Taihang, constituting low mountains and hills of the northeastern Haihe Plain and some areas of the Yanshan Mountains; deciduous broad-leaved forest is mainly distributed in the Yanshan and northern Taihang mountainous areas; mixed forest is mainly distributed in the transitional zone between the northern Taihang and Yanshan mountains; and scrubs are widely distributed, mainly in mountainous areas 500 m above sea level. The grassland spatial distribution is the widest in the Jing-Jin-Ji region, with relatively continuous and concentrated distribution areas, in the 300-600 m, low-mountain areas and piedmont in the west of Handan, Xingtai, Shijiazhuang, and Baoding; at 600-1800 m above sea level in the middle of Zhangjiakou, and in the 400-1000 m low mountains and hills in Chengde, Tangshan, and Qinhuangdao. Water bodies are mainly distributed in lakes, rivers, reservoirs, and depressions within the Luanhe and Haihe river basins, while wetlands are mainly distributed in humid and low-lying areas around water bodies. Bare or sparse vegetation is mainly distributed in areas with little rain, in northwest Hebei, the desert area in Huailai County, and the saline-alkali zone around the Bohai Sea. Cultivated land is mainly distributed in Haihe Plain, in Yanshan’s low-mountainous areas and piedmont, and on the plateau of northwest Zhangjiakou. Built-up land is mainly distributed in the inland-river- system and plain areas with developed transportation in Jing-Jin-Ji.
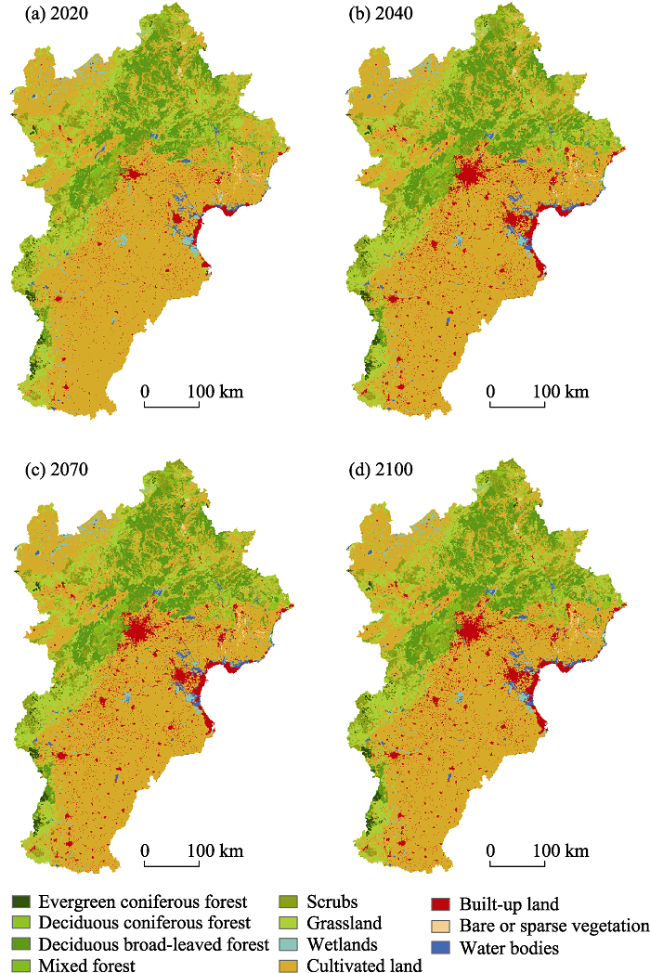
Figure 2 Spatiotemporal changes in land cover in the Jing-Jin-Ji region under SSP1-2.6 scenario
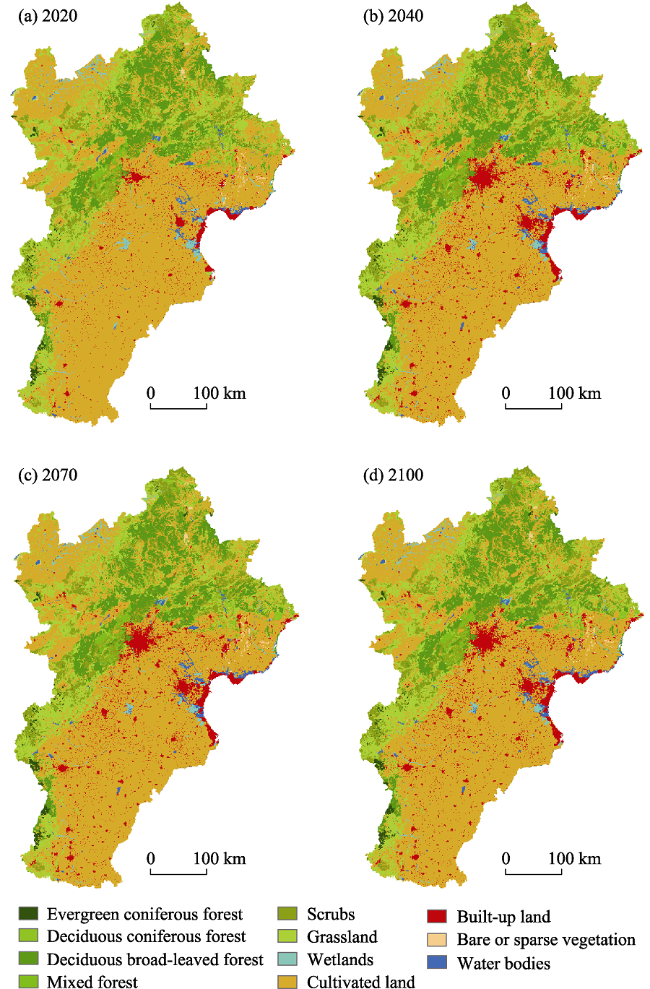
Figure 3 Spatiotemporal changes in land cover in the Jing-Jin-Ji region under SSP2-4.5 scenario
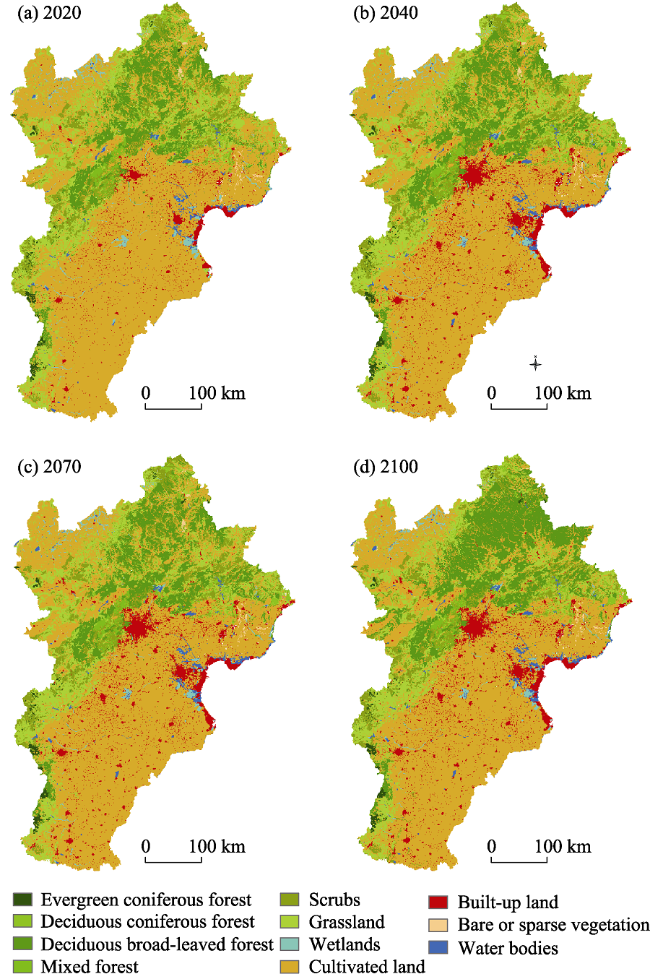
Figure 4 Spatiotemporal changes in land cover in the Jing-Jin-Ji region under scenario SSP5-8.5
Under the three scenarios of SSP1-2.6, SSP2-4.5, and SSP5-8.5, with continuously increasing temperature, precipitation, and human activity, especially against the background of the coordinated and integrated development of Jing-Jin-Ji, during 2020-2100, the simulated land-cover changes for the four periods of 2020, 2040, 2070, and 2100 in Jing-Jin-Ji show the following trends: Cultivated land shows a decreasing trend, and is mainly converted to built-up land and deciduous broad-leaved forest. Built-up land generally increases, especially in the vicinity of the Jing-Jin-Ji-land-transportation network, in the suburbs of existing urban built-up land, and in the coastal zone around the Bohai Sea and other regions. The land-cover types of evergreen coniferous forest, deciduous broad-leaved forest, deciduous coniferous forest, scrubs, and mixed forest generally increase. Driven by the policy of returning farmland to forest and grassland and the building of ecological civilization, some cultivated land with a slope over 25 degrees in the mountainous areas of the north of Jing-Jin-Ji is gradually converted to forest land. In addition, with increasing precipitation and implementation of desertification control measures in the north of Jing-Jin-Ji, the types of bare or sparse vegetation in the corresponding areas gradually shrink.

3.3 Changes in area of land-cover types

Statistical analysis of the simulation results for land-cover change in Jing-Jin-Ji under the SSP1-2.6 scenario (Figure 2 and Table 2) shows that the built-up land in Jing-Jin-Ji has the fastest growth rate in 2020-2100: Its area increases by 3011 km2, with an average increase of 4.23% per decade. The area of evergreen coniferous forest, deciduous coniferous forest, deciduous broad-leaved forest, mixed forest, and scrub increases by 0.92%, 1.93%, 1.01%, 0.91% and 0.39%, respectively per decade. The area of grassland, wetland, cultivated land, water bodies, and bare or sparse vegetation shows a decreasing trend of 0.29%, 2.16%, 0.44%, 0.11%, and 1.55% respectively, per decade; the area of cultivated land decreases by 551 km2 per decade from 2020 to 2100.
Table 2 Land-cover change in the Jing-Jin-Ji region under scenario SSP1-2.6 (km2)
Land-cover type 2020 2040 2070 2100 Decadal change rate (%)
Evergreen coniferous forest 1206 1251 1291 1295 0.92
Deciduous coniferous forest 2561 2795 2953 2957 1.93
Deciduous broad-leaved forest 20456 21427 22008 22103 1.01
Mixed forest 1507 1598 1601 1617 0.91
Scrubs 17490 17667 17703 18033 0.39
Grassland 32923 32732 32281 32162 -0.29
Wetlands 3007 2736 2495 2487 -2.16
Cultivated land 124170 121692 120104 119761 -0.44
Built-up land 8901 10377 11875 11912 4.23
Bare or sparse vegetation 709 663 633 621 -1.55
Water bodies 1979 1971 1965 1961 -0.11
Statistical analysis of the simulation results for land-cover change in Jing-Jin-Ji under the SSP2-4.5 scenario (Figure 3 and Table 3) shows that the area of built-up land, evergreen coniferous forest, deciduous coniferous forest, deciduous broad-leaved forest, mixed forest, and scrubs in Jing-Jin-Ji continues to increase from 2020 to 2100, with an average increase of 4.56%, 1.02%, 2.08%, 1.52%, 2.96%, and 0.85% per decade. The area of grassland, wetlands, cultivated land, water bodies, bare or rare vegetation shows a continuous decreasing trend of 0.58%, 2.46%, 0.56%, 0.14%, and 1.87%, respectively, per decade. The area of cultivated land decreases by 639 km2 per decade in the next 80 years, and the growth rate of built-up land is the fastest at 406 km2 per decade.
Table 3 Changes in land cover in the Jing-Jin-Ji region under SSP2-4.5 scenario (km2)
Land-cover type 2020 2040 2070 2100 Decadal change rate (%)
Evergreen coniferous forest 1206 1258 1295 1304 1.02
Deciduous coniferous forest 2561 2897 2957 2987 2.08
Deciduous broad-leaved forest 20456 21273 22051 22937 1.52
Mixed forest 1507 1509 1636 1864 2.96
Scrubs 17490 17604 17593 18675 0.85
Grassland 32923 32453 32217 31397 -0.58
Wetlands 3007 2679 2529 2415 -2.46
Cultivated land 124170 121502 120273 118625 -0.56
Built-up land 8901 11093 11794 12145 4.56
Bare or sparse vegetation 709 672 601 603 -1.87
Water bodies 1979 1969 1963 1957 -0.14
Statistical analysis of the simulation results for land-cover change in the Jing-Jin-Ji region under the SSP5-8.5 scenario (Figure 4 and Table 4) shows that from 2020 to 2100, there will area of built-up land, evergreen coniferous forest, deciduous coniferous forest, deciduous broad-leaved forest, mixed forest, and scrubs continues to increase by 5.42%, 1.09%, 2.08%, 2.83%, 0.14%, and 1.65%, respectively, per decade. The area of grassland, wetlands, cultivated land, water bodies, bare or sparse vegetation continues to decrease by 0.60%, 3.29%, 0.88%, 0.54% and 3.46%, respectively, per decade. The area of cultivated land decreases the most: In the next 80 years, the area decreases by 1088 km2 per decade, while the growth rate of built-up land is the fastest, with an average increase of 482 km2 per decade.
Table 4 Changes in land cover in the Jing-Jin-Ji region under scenario SSP5-8.5 (km2)
Land-cover type 2020 2040 2070 2100 Decadal change rate (%)
Evergreen coniferous forest 1206 1272 1315 1311 1.09
Deciduous coniferous forest 2561 2901 3011 2987 2.08
Deciduous broad-leaved forest 20456 22305 22814 25095 2.83
Mixed forest 1507 1533 1581 1524 0.14
Scrubs 17490 17502 17899 19797 1.65
Grassland 32923 32524 33107 31351 -0.60
Wetlands 3007 2632 2492 2216 -3.29
Cultivated land 124170 120601 118241 115463 -0.88
Built-up land 8901 11047 11991 12759 5.42
Bare or sparse vegetation 709 667 557 513 -3.46
Water bodies 1979 1925 1901 1893 -0.54

3.4 Comparative analysis of land-cover change under the three scenarios

The simulation results of land-cover change in Jing-Jin-Ji driven by SSP1-2.6, SSP2-4.5, and SSP5-8.5 (Figure 5) show that from 2020 to 2100, built-up land increases the fastest, with an average rate of 5.07% per decade. Wetlands decrease the fastest, with an average rate of 2.58% per decade. The intensity of land-cover change in the Jing-Jin-Ji region under the SSP5-8.5 scenario in 2020-2040, 2040-2070, and 2070-2100 is higher than that under the SSP1-2.6 and SSP2-4.5 scenarios. From 2020 to 2100, the land cover of the three scenarios will have the highest intensity of change in the period of 2020-2040 (average change per decade of 3.12%), and the lowest intensity of change in the period of 2070-2100 (average change per decade of 0.98%). During 2020-2040, the average dynamic change intensity of evergreen coniferous forest, deciduous coniferous forest, grassland, wetlands, cultivated land, built-up land, and water bodies per decade under the SSP1-2.6 scenario is 0.93%, 2.28%, 0.15%, 2.25%, 0.50%, 4.15% and 0.10% respectively, and the above change intensity is lower than that under the SSP2-4.5 and SSP5-8.5 scenarios. In all the land-cover types during 2040-2070, the dynamic change in degree of scrubs under SSP2-4.5 is the lowest (the average change is only 0.01% per decade), and the dynamic change degree of bare or sparse vegetation under SSP5-8.5 is the highest (the average change is 2.75% per decade). In all the land-cover types during 2070-2100, the dynamic change in degree of water bodies under the SSP1-2.6 scenario is the smallest (the average change in degree per decade is only 0.03%), while the dynamic change in degree of mixed forest under the wet SSP5-8.5 scenario is the highest (the average change in degree per decade is 2.32%). In short, driven by the coupling of natural climate change and human activity, the change intensity of land cover in Jing-Jin-Ji during 2020-2100 under the SSP5-8.5 scenario is higher than that under the SSP1-2.6 and SSP2-4.5 scenarios.
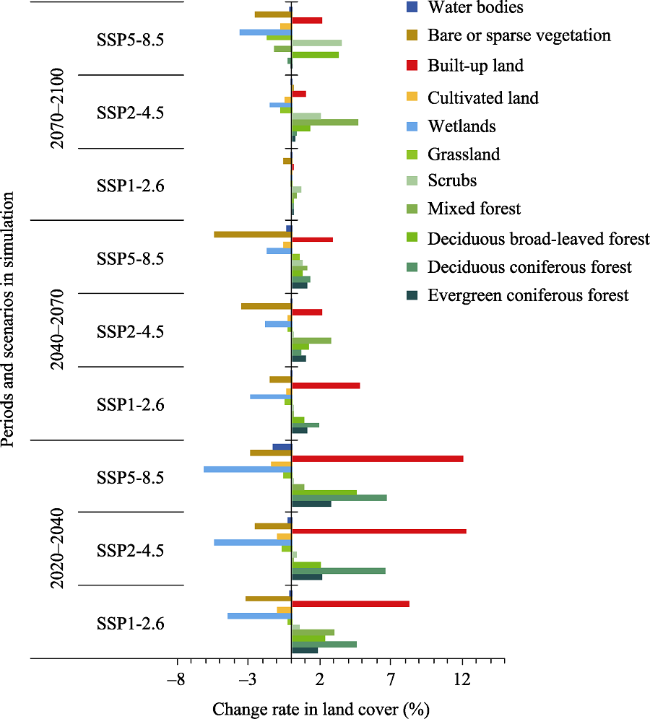
Figure 5 Change intensity of land cover in the Jing-Jin-Ji region under different scenarios

4 Discussion

4.1 Advantages of land cover scenario surface-modeling method

The land cover scenario surface-modeling method (SSMLC) (Fan et al., 2005; 2015; Yue et al., 2007b) aims to expand and modify the SMLC model driven by natural climate change, in view of the defects in the existing I-O, IMAGE, cloud, CA, SD, and flux models for land-cover simulation (Alcamo et al., 1994; Clarke et al., 1997; Verburg et al., 1999; 2002; Oshiaki IchinoSe, 2003; He et al., 2005; Fan et al., 2015; Liu et al., 2017). Then, a spatial-simulation method for medium- and large-scale land cover scenarios, which simultaneously takes into account the driving effects of natural climate and human activity on land-cover change, is developed (Holdridge, 1947; Yue et al., 2005). The main advantages of the SSMLC model include: It overcomes the defects of the I-O model. The I-O model focuses on the economic utility analysis of land-cover change and ignores the driving impact of climate change on land-cover change. It overcomes the limitations of the IMAGE model, which mainly focuses on the driving of agricultural ecological processes, ignores the driving effect of natural and human factors on land-cover change from the ecological pattern, and is poor at obtaining the ecological process parameters of a large area. It makes up for the model defects of the CLUE model in the simulation process.
The CLUE model must first constrain the number of future land-cover types under various scenarios in order to realize the maximum probability simulation of the spatial distribution of various land-cover types under various scenarios. It overcomes the shortcomings of the SD model. The SD-model-driving-cycle structure is too complex, especially on large regional scales, and it experiences difficulty in distinguishing among the different driving effects affecting elements. It effectively makes up for the defects of the FLUS model. The FLUS model is mostly used for down-scaling simulations of cultivated land and various types of urban land, where human activity has a strong interference effect on large regional scales. In short, the spatial results of the SSMLC model in the Jing-Jin-Ji region show that this method ably takes into account the driving effects of natural climate elements, human factors, and policy measures on land-cover change; and that this method successfully simulates future scenarios concerning land-cover change in the Jing-Jin-Ji region. In addition, in the spatial simulation of land-cover change for each period in the future under each scenario, the results of the previous period can be used as the basic data for simulation of the next period. This mitigates the uncertainty caused by cumulative error arising from simulations over a large time scale, and ensures the model can be used for the simulation of land-cover change over such timescales. However, because the current SSMLC model mainly simulates the spatial and temporal and changes in land-cover category driven by natural climate and human factors, the current simulation is robust regarding the internal structure of built-up land and cultivated land that has a strong interference with human activity. There are still some limitations in portraying. In future work, we will draw on the existing model to analyze the structural conversion mechanism of various built-up lands and cultivated lands, adding to and improving the model.

4.2 Analysis of land-cover scenario simulation results for the Jing-Jin-Ji region

Based on the SSMLC model, the simulation results of future land-cover changes in the Jing- Jin-Ji region under the three scenarios of SSP1-2.6, SSP2-4.5, and SSP5-8.5 show that: From 2020 to 2040, the land-cover change in the Jing-Jin-Ji region is in a period of high change intensity, at 3.11% per decade. After entering 2040, the rate of change gradually slows down. The intensity of change per decade for the two periods of 2070 and 2100 is 1.36% and 0.98%, respectively. This simulation result confirms that in the “Jing-Jin-Ji Coordinated Development of Land Use Master Plan (2015-2020),” “Jing-Jin-Ji Urban Agglomeration Development Plan,” “Hebei Xiong’an New District Built-up Plan,” “Beijing Urban Planning 2016”—under the guidance of the development plans for the Jing-Jin-Ji region such as 2035, Tianjin Urban Planning (2015-2030) and Hebei Urban System Planning (2016-2030), the land-cover change in this area will be in a high-intensity change between 2020 and 2040, especially built-up land will reach an annual growth rate of 0.58%, while the area of cultivated land will decrease at an annual rate of 0.06%. At the same time, in the Jing-Jin-Ji region, driven by policies that consolidate the effects of poverty alleviation, the building-up of ecological protection forests, and the increase in average temperature and precipitation (Zhao et al., 2019), the mountainous forest area shows a rapidly increasing trend. In addition, due to the rapid progress in urbanization of the Jing-Jin-Ji region, the development of various nodes in the Jing-Jin-Ji metropolitan area, and the rapid rise in population (Fan, 2008; Fang, 2017; Chen et al., 2018; Ouyang and Zhu, 2020), eco-tourism has developed rapidly (Fang et al., 2017). This will cause a rapid increase in water demand, which will result in a reduced water supply in an area that already has a water shortage; there will be a concomitant reduction in the area of wetlands and water bodies.
Via a combination of different, shared socio-economic paths (SSPs) and typical concentration paths (RCPs) (Zhang et al., 2019; Su et al., 2021), the SSP1-2.6 scenario is a sustainable development scenario. Future spatiotemporal changes in land cover in the Jing-Jin-Ji region simulated under the SSP1-2.6 scenario are closer to being driven by the coordinated development of the Jing-Jin-Ji region and various land-resource-development policies and ecological built-up measures. The SSP2-4.5 scenario is a development model that continues the historical trend and the status quo. In the process of land-cover change, the importance of ecological protection and the sustainable use of resources is lower than that of the SSP1-2.6 scenario. Therefore, the intensity of future land-cover changes in this scenario will be higher. The SSP5-8.5 scenario, as a development path with rapid economic development at its core and one that underestimates ecological sustainability, will lead to a development trend of land-cover change in the Jing-Jin-Ji region that is higher than in the other two scenarios. In particular, built-up land has been increasing rapidly and the area of cultivated land has been greatly reduced.

4.3 Enlightenment of land cover scenario simulation results in the Jing-Jin-Ji region

As the strategic core area of national economic development and the main area of new urbanization (Fan, 2008; Fang, 2017; Chen et al., 2018; Ouyang and Zhu, 2020), Jing-Jin-Ji megacity agglomeration will not only occupy a large amount of cultivated land (Zhao, 2016), but will cause a corresponding urban-heat-island effect (Yue et al., 2019). Therefore, in the process of the coordinated development of Jing-Jin-Ji, it is necessary to comprehensively analyze the interaction and coupling effects of the Jing-Jin-Ji megacity cluster and the eco-environment (Fang et al., 2017; Ouyang and Zhu, 2020), and to seek the best sustainable development model. For example, with the rapid urbanization of Jing-Jin-Ji, the urbanization rate will reach 82% by 2050 (Gu et al., 2017), and the urban population will reach 118 million (Wang et al., 2016; Li and Kuang, 2019). This will increase the existing pressure on the use of water resources in the Jing-Jin-Ji region, and reduce and shrink the area of water bodies and wetlands. According to the simulation results, in the process of the coordinated development of Jing-Jin-Ji, it is necessary to strictly control the sustainable development and utilization of land resources, so as to achieve an optimal balance between rapid socioeconomic development and eco-environmental protection (Fang, 2017; Ouyang and Zhu, 2020). First, we must strictly control the occupation of cultivated land resources by built-up land, and curb the rapid decline in cultivated land during rapid urban development. Second, we must scientifically plan the sustainable use of ecological land in the Jing-Jin-Ji region, especially in the Jing-Jin-Ji urban agglomeration. When vigorously developing eco-tourism in the suburbs and mountainous areas of the Jing-Jin-Ji region, it is necessary to strengthen the protection of water resources and wetland resources and to establish prohibited development zones to curb the decline in water bodies and wetlands. In short, in the process of coordinated development in Beijing, Tianjin, and Hebei, these separate areas should be regarded as a whole for urban-development planning, industrial-structure adjustment and layout, and ecological-environment-protection planning. This would facilitate the scientific, rational development and utilization of land resources in the Beijing-Tianjin-Hebei region, and therefore reduce the unreasonable interference intensity arising from human factors.

5 Conclusion

The research results show that CMIP6 climate scenario data and socioeconomic data taken from different shared socioeconomic paths and typical concentration paths—the Cover- Scenario-Surface-Modeling Method, GDP data, population data, traffic data, and policy- factor data—can be used to construct the Land-Cover-Scenario-Surface-Modeling Method, which can perform a spatial simulation and quantitative characterization of the change trend and intensity of the spatial and temporal distribution patterns of land cover in the Jing-Jin-Ji region under different future scenarios. As a megalopolis region in China, the driving impact of various human activities and macro-policy formulation on the easily disturbed land-cover types of built-up land, cultivated land, water bodies, and wetlands in the Jing-Jin-Ji region is stronger than that on other land-cover types. The increase in precipitation and the implementation of various ecological built-up projects in various forest lands in the Jing-Jin-Ji region will show a rapidly growing trend between 2020 and 2040. The research results not only provide data support for coordinated- and integrated-land-space allocation and planning for the Jing-Jin-Ji region but also an auxiliary basis for the sustainable development and utilization of land resources and key ecological protection planning for the region. In future research work, it will further combine the overall layout and planning of the integrated and coordinated development of Jing-Jin-Ji, industrial-structure adjustment, ecological built-up and environmental protection planning, and other relevant policies and measures to formulate a comprehensive analysis, quantitative assessment, and simulation prediction of eco-environment vulnerability in different regions. These regions will include key urban built-up areas and key ecological functional areas in the Jing-Jin-Ji region.
[1]
Alcamo J, Kreileman G, Krol M S et al., 1994. Modeling the global society-biosphere-climate system: Part 1: Model description and testing. Image 2.0. 76. Springer, 1-35.

[2]
Belotelov N V, Bogatyrev B G, Kirilenko A P et al., 1996. Modeling of time-dependent biome shifts under global climate changes. Ecological Modeling, 87(1-3): 29-40.

DOI

[3]
Chen J, Lu F, 2008. Location advantage and accessibility evaluation on Beijing-Tianjin-Hebei metropolitan area. Geography and Geo-Information Science, 24(2): 53-56. (in Chinese)

[4]
Chen Y, Jin F J, Lu Y Q et al., 2018. Development history and accessibility evolution of land transportation network in Jing-Jin-Ji region. Journal of Geographical Sciences, 28(10): 1500-1518.

DOI

[5]
Clarke K C, Hoppen S, Gaydos L, 1997. A self-modifying cellular automaton model of historical urbanization in the San Francisco Bay area. Environment and Planning B: Planning and Design, 24(2): 247-261.

DOI

[6]
Fan J. The Integrated Regional Planning in the Metropolis Region: Beijing, Tianjin and Hebei. Beijing: Science Press. (in Chinese)

[7]
Fan Z M, Bai R Y, Yue T X, 2020. Scenarios of land cover in Eurasia under climate change. Journal of Geographical Sciences, 30(1): 3-17.

DOI

[8]
Fan Z M, Fan B, Yue T X, 2019. Terrestrial ecosystem scenarios and their response to climate change in Eurasia. Science China Earth Sciences, 62(10): 1607-1618.

DOI

[9]
Fan Z M, Li J, Yue T X, 2013. Land-cover changes of biome transition zones in Loess Plateau of China. Ecological Modeling, 252: 129-140.

DOI

[10]
Fan Z M, Li J, Yue T X et al., 2015. Scenarios of land cover in karst area of southwestern China. Environmental Earth Sciences, 74(8): 6407-6420.

DOI

[11]
Fan Z M, Yue T X, Liu J Y et al., 2005. Spatial and temporal distribution of land cover scenarios in China. Acta Geographica Sinica, 60(6): 941-952. (in Chinese)

[12]
Fang C L, 2015. Progress and the future direction of research into urban agglomeration in China. Journal of Geographical Sciences, 25(8): 1003-1024.

DOI

[13]
Fang C L, 2017. Theoretical foundation and patterns of coordinated development of the Jing-Jin-Ji urban agglomeration. Progress in Geography, 36(1): 15-24. (in Chinese)

[14]
Fang C L, Zhou C H, Gu C L et al., 2017. Theoretical analysis of interactive coupled effects between urbanization and eco-environment in mega-urban agglomerations. Journal of Geographical Sciences, 27(12): 1431-1449.

DOI

[15]
Fu J Y, Jiang D, Huang Y H, 2014. Population dataset of 1 km*1 km in China. Acta Geographica Sinica, 69(Suppl.1): 41-44. (in Chinese)

[16]
Gu C L, Guan W H, Liu H L, 2017. Chinese urbanization 2050: SD modeling and process simulation. Science China Earth Sciences, 60(6): 1067-1082.

DOI

[17]
He C Y, Shi P J, Chen J et al., 2005. Developing land use scenario dynamics model by the integration of system dynamics model and cellular automata model. Science in China Series D: Earth Sciences, 48(11): 1979-1989.

[18]
Hochstrasser T, Kröel-Dulay G, Peters D et al., 2002. Vegetation and climate characteristics of arid and semi-arid grasslands in North America and their biome transition zone. Journal of Arid Environments, 51(1): 55-78.

DOI

[19]
Holdridge L R, 1947. Determination of world plant formations from simple climatic data. Science, 105(2727): 367-368.

PMID

[20]
Huang Y H, Jiang D, Fu J Y, 2014. GDP dataset of 1 km*1 km in China. Acta Geographica Sinica, 69(Suppl.1): 45-48. (in Chinese)

[21]
Jiang T, Zhao J, Cao L G et al., 2018. Projection of national and provincial economy under the shared socioeconomic pathways in China. Climate Change Research, 14(1): 50-58.

[22]
Jiang T, Zhao J, Jing C et al., 2017. National and provincial population projected to 2100 under the shared socioeconomic pathways in China. Climate Change Research, 13(2): 128-137.

[23]
Li X Y, Kuang W H, 2019. Spatio-temporal trajectories of urban land use change during 1980-2015 and future scenario simulation in Beijing-Tianjin-Hebei Urban Agglomeration. Economic Geography, 39(3): 187-195. (in Chinese)

[24]
Liu X P, Liang X, Li X et al., 2017. A future land use simulation model (FLUS) for simulating multiple land use scenarios by coupling human and natural effects. Landscape and Urban Planning, 168: 94-116.

DOI

[25]
Lu D D, 2015. Function orientation and coordinating development of subregions within the Jing-Jin-Ji urban agglomeration. Progress in Geography, 34(3): 265-270. (in Chinese)

[26]
Oshiaki IchinoSe T, 2003. Temporal structure of land use change in Asia. Journal of Global Environment Engineering, 9: 41-51.

[27]
Ouyang X, Zhu X, 2020. Spatio-temporal characteristics of urban land expansion in Chinese urban agglomerations. Acta Geographica Sinica, 75(3): 571-588.

[28]
Solomon A M, 1986. Transient response of forests to CO2-induced climate change: Simulation modeling experiments in eastern North America. Oecologia, 68(4): 567-579.

DOI PMID

[29]
Su B D, Huang J L, Mondal S K et al., 2021. Insight from CMIP6 SSP-RCP scenarios for future drought characteristics in China. Atmospheric Research, 250: 105375. https://doi.org/10.1016/j.atmosres.2020.105375.

DOI

[30]
Turner B L, Skole D, Sanderson S et al., 1995. Land-use and land-cover change: Science/research plan. Global Change Report, 43: 669-679.

[31]
Verburg P H, Soepboer W, Veldkamp A et al., 2002. Modeling the spatial dynamics of regional land use: The CLUE-S model. Environmental Management, 30(3): 391-405.

PMID

[32]
Verburg P H, Veldkamp A, Fresco L O, 1999. Simulation of changes in the spatial pattern of land use in China. Applied Geography, 19(3): 211-233.

DOI

[33]
Vitousek P M, Mooney H A, Lubchenco J et al., 1997. Human domination of Earth's ecosystems. Science, 277(5325): 494-499.

DOI

[34]
Wang H J, Zhang B, Liu Y L et al., 2018. Multi-dimensional analysis of urban expansion patterns and their driving forces based on the center of gravity-GTWR model: A case study of the Beijing-Tianjin-Hebei urban agglomeration. Acta Geographica Sinica, 73(6): 1076-1092. (in Chinese)

[35]
Wang K Y, Ding J, Wang F Y, 2016. Influence of the implementation of the universal two-child policy on demographic structure and population spatial distribution in China. Progress in Geography, 35(11): 1305-1316. (in Chinese)

[36]
Wang L W, Feng C C, 2016. Spatial expansion pattern and its driving dynamics of Jing-Jin-Ji metropolitan region: Based on nighttime light data. Acta Geographica Sinica, 71(12): 2155-2169. (in Chinese)

[37]
Whittaker R H, 1972. Evolution and measurement of species diversity. Taxon, 21(2/3): 213-251.

DOI

[38]
Yue T X, 2011. Surface Modeling:High Accuracy and High Speed Methods. New York: CRC Press.

[39]
Yue T X, Du Z P, Song D J et al., 2007a. A new method of surface modeling and its application to DEM construction. Geomorphology, 91(1/2): 161-172.

DOI

[40]
Yue T X, Fan Z M, Liu J Y, 2005. Changes of major terrestrial ecosystems in China since 1960. Global and Planetary Change, 48(4): 287-302.

DOI

[41]
Yue T X, Fan Z M, Liu J Y et al., 2006. Scenarios of major terrestrial ecosystems in China. Ecological Modeling, 199(3): 363-376.

DOI

[42]
Yue T X, Fan Z M, Liu J Y, 2007b. Scenarios of land cover in China. Global and Planetary Change, 55(4): 317-342.

DOI

[43]
Yue T X, Zhao N, Fan Z M et al., 2016. CMIP5 downscaling and its uncertainty in China. Global and Planetary Change, 146: 30-37.

DOI

[44]
Yue T X, Zhao N, Liu Y et al., 2020. A fundamental theorem for eco-environmental surface modeling and its applications. Science China Earth Sciences, 63(8): 1092-1112.

DOI

[45]
Yue W Z, Qiu S S, Xu H et al., 2019. Polycentric urban development and urban thermal environment: A case of Hangzhou, China. Landscape and Urban Planning, 189: 58-70.

DOI

[46]
Zhang L X, Chen X L, Xin X G, 2019. Short commentary on CMIP6 scenario model intercomparison project (ScenarioMIP). Advances in Climate Change Research, 15 (5): 519-525

[47]
Zhang X, Liu L Y, Chen X D et al., 2021. GLC_FCS30: Global land-cover product with fine classification system at 30 m using time-series Landsat imagery. Earth System Science Data, 13(6): 2753-2776.

DOI

[48]
Zhao N, Jiao Y M, Ma T et al., 2019. Estimating the effect of urbanization on extreme climate events in the Beijing-Tianjin-Hebei region, China. Science of the Total Environment, 688: 1005-1015.

DOI

[49]
Zhao P J, 2016. Planning for social inclusion: The impact of socioeconomic inequities on the informal development of farmland in suburban Beijing. Land Use Policy, 57: 431-443.

DOI

[50]
Zhu E J, 2009. Production upgrading and integretion in the process of the integration of Beuing-Tianjini-Hebei. Economic Geography, 29(6): 881-886. (in Chinese)

Options
Outlines

/