Research Articles

Dynamic features and driving mechanism of coal consumption for Guangdong province in China

  • WANG Changjian , 1, 2 ,
  • WANG Fei , 3, * ,
  • ZHANG Xinlin 4 ,
  • WANG Yang 1 ,
  • SU Yongxian 1 ,
  • YE Yuyao 1 ,
  • WU Qitao 1 ,
  • ZHANG Hong’ou 1
Expand
  • 1. Guangdong Provincial Key Laboratory of Remote Sensing and Geographical Information System, Guangdong Open Laboratory of Geospatial Information Technology and Application, Guangzhou Institute of Geography, Guangdong Academy of Sciences, Guangzhou 510070, China
  • 2. Southern Marine Science and Engineering Guangdong Laboratory (Guangzhou), Guangzhou 510070, China
  • 3. School of Resources and Planning, Guangzhou Xinhua University, Guangzhou 510520, China
  • 4. School of Geography, Geomatics and Planning, Jiangsu Normal University, Xuzhou 221116, Jiangsu, China
* Wang Fei (1986-), Associate Professor, specialized in economic geography and regional development. E-mail:

Wang Changjian (1986-), Associate Professor, specialized in economic geography and sustainability. E-mail:

Received date: 2020-12-13

  Accepted date: 2021-10-18

  Online published: 2022-05-25

Supported by

National Key Research and Development Program(2019YFB2103101)

Southern Marine Science and Engineering Guangdong Laboratory (Guangzhou)(GML2019ZD0301)

GDAS Special Project of Science and Technology Development(2020GDASYL-20200102002)

GDAS Special Project of Science and Technology Development(2020GDASYL-20200301003)

National Natural Science Foundation of China(41501144)

Abstract

Guangdong Province, as one of China’s fast-developing regions, an important manufacturing base, and one of the national first round low-carbon pilots, still faces many challenges in controlling its total energy consumption. Coal dominates Guangdong’s energy consumption and remains the major source of CO2. Previous research on factors influencing energy consumption has lacked a systematic analysis both from supply side (factors related to scale, structure, and technologies) and demand side (investment, consumption, and trade). This paper develops the logarithmic mean Divisia index (LMDI) method that focuses on the supply side and the structural decomposition analysis (SDA) method that focuses on the demand side to systematically identify the key factors driving coal consumption in Guangdong. Results are as follows: (1) Supply side analysis indicates that economic growth has always been the most important factor driving coal consumption growth, while energy intensity is the most important constraining factor. Industrial structure and energy structure have different impacts on coal consumption control during different development phases. (2) Demand side analysis indicates that coal is consumed mainly for international exports, inter-provincial exports, fixed capital formation, and urban household. (3) Industries with the fastest coal consumption growth driven by final demand have experienced significant shifts. Increments in industrial sectors were mainly driven by inter-provincial exports and urban household consumption in recent years. (4) Research on energy consumption in subnational regions under China’s new development pattern of “dual circulation” should not only focus on exports in the context of economic globalization but also pay more attention to inter-provincial exports on the background of strengthened interregional connections.

Cite this article

WANG Changjian , WANG Fei , ZHANG Xinlin , WANG Yang , SU Yongxian , YE Yuyao , WU Qitao , ZHANG Hong’ou . Dynamic features and driving mechanism of coal consumption for Guangdong province in China[J]. Journal of Geographical Sciences, 2022 , 32(3) : 401 -420 . DOI: 10.1007/s11442-022-1954-0

1 Introduction

Energy is the material foundation of social progress and human civilization. Especially since the Industrial Revolution, access to affordable, stable, and clean energy has become the cornerstone of economic growth and social prosperity around the world (Chu and Majumdar, 2012). Since its reform and opening-up, China’s total energy production and consumption have experienced excessively high growth due to rapid industrialization and urbanization (Shen and Sun, 2016). Now China produces and consumes more energy than any other country. As of 2017, China’s total energy consumption was up to 4.485 billion tce, or 23.29% of the world’s total energy consumption (BP, 2019). In comparison with other advanced economies, in which oil dominates the energy structure, China is rich in coal and poor in oil and natural gas and, as a result, has a coal-dominated energy structure. As the largest coal-consuming country, China accounts for over 50% of the coal used across the globe (BP, 2019). After 2000, China’s total coal consumption saw a rapid growth from 1.007 billion tce in 2000 to 2.709 billion tce in 2017 (BP, 2019). While driving the rapid economic growth, the significant increase in coal consumption in China has also turned the country into the largest energy user and CO2 emitter around the globe (Wang et al., 2014; Liu et al., 2016; Wang et al., 2020b).
Coal consumption has also become an important source of air pollution and the frequent occurrences of smog (Gong et al., 2012). To actively cope with global climate change caused by greenhouse gas (GHG) emissions and reduce air pollution and health risks as a result of coal consumption, controlling total coal consumption and transforming the coal industry have been the top priority and foothold of China’s strategy on energy production and consumption (Chen et al., 2019; He et al., 2020). The 12th Five-Year Plan (FYP) (2011-2015) proposed to reduce the energy consumption per unit of GDP by 16% as of 2015 and to increase the proportion of non-fossil fuels in primary energy consumption to 11.4%. In 2013, the State Council determined that the red line of total energy consumption for 2015 would be 4 billion tce. The 13th FYP (2016-2020) proposed to reduce energy consumption per unit GDP by 15% as of 2020 and to increase the proportion of non-fossil fuels in primary energy consumption to 15%. The Strategy for Energy Production and Consumption Revolution (2016-2030) proposed to keep total energy consumption below 6 billion tce by 2030, increase the proportion of non-fossil fuels in total energy consumption to approximately 20%, and significantly reduce the use of high-carbon fossil fuels. Therefore, ecological, clean, and efficient use of energy is the core of China’s energy strategy (Wang and Wang, 2017).
Existing research on coal consumption in China mainly focuses on the exploitation of coal resources (Tollefson and Van Noorden, 2012), the production capacity and supply of coal (Wang et al., 2011), the relationship between coal consumption and economic growth (Li and Leung, 2012), the demand for coal due to economic growth (Shealy and Dorian, 2010), the coal trade (Riker, 2012), the influencing factors and driving mechanism of coal consumption (Steckel et al., 2015), coal consumption peaks (Wang et al., 2018), policy changes in the coal industry (Shen et al., 2012), and the environmental effect of coal consumption (Wang et al., 2012). These studies mainly focus on the national scale, they try to answer whether China’s economic growth can be separated from coal consumption or examine the key factors that will reduce coal consumption. However, there exists significant spatial heterogeneity in China, the provinces vary considerably in terms of resource endowment, energy structure, level of economic development, industrial structures, and consumption patterns. While devise more relevant and operable energy-conservation and emission-reduction policies, special attention should be paid to the regional differences in the dynamic evolution and driving mechanisms of energy consumption caused by the spatial heterogeneity.
This paper takes Guangdong Province as the study area mainly based on the following considerations: (1) Guangdong is a large energy-consuming province. Against the backdrop of the opening-up and economic globalization, Guangdong has become one of the fastest-growing provinces in China. Especially since China joined the World Trade Organization (WTO), manufacturing and exports have been driving the economy to grow at fast pace. The GDP increased from 1081.021 billion yuan in 2000 to 8970.523 billion yuan in 2017. With this rapid economic development, total energy consumption increased from 94.4619 Mtce in 2000 to 323.4165 Mtce in 2017, equivalent to the total energy consumption of France in 2017 (242.596 Mtoe) (BP, 2019). (2) Guangdong is among the first provinces to pilot the low-carbon province initiative. The Program to Implement Measures for Controlling Greenhouse Gas Emissions during the 13th FYP in Guangdong proposed that, by 2020, total energy consumption in Guangdong would be kept below 338 Mtce, and non-fossil fuels would account for 26% of total energy consumption. (3) The Strategy for Energy Production and Consumption Revolution (2016-2030), issued in 2016, proposed that developed regions in the east should reach a peak fossil fuel consumption rate, and measures should be taken to strengthen total energy consumption management in key industries and areas, with an emphasis on controlling total coal consumption. The Outline Development Plan for the Guangdong-Hong Kong-Macao Greater Bay Area, issued in 2019, proposed to “move forward with the revolution in energy production and consumption; build an energy sector that is clean, low-carbon, safe, and efficient; and aim at achieving the early peak of carbon emissions.” Guangdong is a developed region on China’s east coast, an important manufacturing base, a province with a strong international trade sector, and a large energy-consuming province. Based on previous studies, raw coal and diesel oil were the top two contributors to carbon emissions in Guangdong, and coal-dominate cities in mid-term industrialization in this fast-developing region performed soaring emissions increases (Zhou et al., 2018; Lin and Li, 2020). In addition, coal burned by power plants and industrial sectors generates a large quantity of SO2, NOx, and PM2.5 emissions in Guangdong (Chen and Meng, 2017). Wang et al. (2021c) examined the slow progress of coal phase-out in Guangdong based on market, infrastructure, and regulatory impediments. How the province takes the lead in achieving the strategic goals of conserving energy, decreasing energy consumption, and reducing emissions will highlight the representativeness and importance of the research on the dynamic evolution and driving mechanism of coal consumption in Guangdong.
The marginal contributions of this research are as follows: (1) Existing research on coal consumption in China has lacked a focus on subnational regional scales, especially on the provincial scale and prefecture scale. This research focuses on subnational regions and performs a comprehensive analysis of the dynamic relationship between coal consumption and economic growth in developed regions. (2) The paper systematically identifies the influencing factors of coal consumption changes and the dynamic mechanism of these factors based on supply and demand perspectives. (3) Existing research focuses on each factor’s impact on total energy consumption but has not analyzed each factor’s impact at the industry level. More targeted, in-depth analysis on the regional scale and at the industry level would have critical significance for the development and implementation of policies that conserve energy supply and reduce energy use.

2 Methods and material

The key to identifying the major driving factors of coal consumption is understanding the evolutional characteristics of total coal consumption and their dynamic mechanism. Of the models that quantitatively identify key driving factors of energy consumption and then further analyze the characteristics of energy consumption changes, the decomposition analysis and input-output (IO) analysis are two widely employed methods (Table 1). Index decomposition analysis (IDA) is expressed in the form of adding or multiplying relevant influencing factors, and the total amount is decomposed according to different weight determination methods to determine the incremental balance of each influencing factor (Ang and Lee, 1994). Based on a systematic comparison of different IDA methods, Ang and Choi (1997) employed the logarithmic mean Divisia index (LMDI) to decompose industrial energy consumption with no residual. The LMDI model not only solves the “zero-value” issue that existed in previous IDA methods but is also flexible in terms of the study of time periods and data (Ang, 2005). Later, based on the Kaya Identity and IPAT equation, the LMDI model has been widely applied in research in the field of energy consumption and its impact on the environment (Steckel et al., 2015; Guan et al., 2018; Wang et al., 2020a; Wang et al., 2021a; Wang et al., 2021b). Leontief proposed the IO model to describe economic structures (Leontief, 1936) and applied this method to the analysis of energy use and environment issue (Leontief, 1970). As the structural decomposition analysis (SDA) model is often combined with, and based on, the classical IO analysis (Dietzenbacher and Los, 1998; Rose and Casler, 1996), it mostly makes up for the IDA model’s deficiency in the study of the mechanism through which factors influence the final demand. The SDA model systematically decomposes information on the production structure, consumption structure, and trade structure contained in the IO data, and has become an increasingly applied method to analyze energy issues in complex economic systems (Yan and Su, 2020). The SDA model (Lenzen, 2016) and IDA model (Ang and Zhang, 2000) have their own respective advantages. Due to the differences in data composition and decomposition technologies, the two models have evolved into two interconnected analytical methods with distinct characteristics. This work will take into consideration the advantages of the IDA and SDA models, integrate the IDA method (which focuses on the production side) and the SDA method (which focuses on the demand side), and perform a systematic study of the evolutional characteristics of coal consumption in Guangdong and the mechanism that drives its evolution. LMDI and SDA methods are used together in our study, and there are two stages of decomposition analysis. In the first stage, coal consumption is decomposed as the results of population size, economic growth, industrial structure, energy consumption intensity, and energy consumption structure. The main driving forces such as population size, per capita GDP, industrial structure, energy consumption intensity, and energy consumption structure are always confirmed as the supply-side (direct) effects in the IDA method. In the second stage, coal consumption is decomposed from the perspective of final demands in quadrant II of the IO table, which comprised the final consumptions (i.e., government consumptions, urban household consumptions, and rural household consumptions), gross capital formation (i.e., fixed capital formation and inventory increase), and gross imports and exports (i.e., inter-provincial import, international import, inter-provincial export, and international export). Previous studies define these driving factors from the final demands as the demand-side (indirect) effects.
Table 1 Summary of selected literatures in China’s coal consumption studies
References Periods Methodology Area Factors
(Michieka and Fletcher, 2012) 1971-2009 VAR China Urban population, per capita GDP
(Li and Leung, 2012) 1985-2008 Panel data China GDP
(Bloch et al., 2012) 1965-2008 VEC China GDP, labor, capital, income, coal price
(Lin et al., 2012) 1995-2008 Gaussian
curves
China Energy structure, carbon intensity, energy security
(Bhattacharya et al., 2015) 1978-2010 ADL China Coal technology
(Chong et al., 2015) 2001-2011 LMDI China Population, per capita GDP, energy intensity, energy structure
(Wu and Zhang, 2016) 1997-2012 IO China Domestic demand, foreign trade and industrial upgrading
(Zhang et al., 2018a) 2012 IO China Coal flow, coal industry
(Wu and Chen, 2018) 2012 MRIO China Exports and imports
(Zhang et al., 2018b) 1991-2013 LMDI China Population, per capita GDP, energy intensity, energy structure
(Wang et al., 2018) 1981-2015 PSO China Economic growth, energy structure, investment, and industrial structure
(Qiao et al., 2019) 2000-2016 EKC China’s 30
provinces
Urbanization, per capita GDP, trade
(Liu et al., 2017) 2012 IO China’s 3
regions
Coal flow, coal industry
(Tang et al., 2018) 1997-2014 LMDI, IO China Economic scale, industrial structure, energy intensity, energy mix, trade
(Chen et al., 2019) 1997-2012 IO China Fixed capital formation, household consumption, export
(Wang and Feng, 2018) 2000-2014 LMDI China Energy structure, energy intensity, industrial structure, industrial scale
(Chen et al., 2018) 2000-2015 LMDI China Per capita income, population, energy intensity, energy structure
(Chai et al., 2019) 1980-2016 LMDI China Per capita GDP, industrial structure, energy intensity, energy structure
(Ou et al., 2019) 2003-2016 LMDI China’s 30
provinces
Population, per capita GDP, energy intensity, industrial structure, energy structure
(Liu et al., 2020) 2002-2017 IO China Fixed capital formation, coal intensity, production structure, commodity structure

2.1 Development of IPAT-based LMDI model

Building upon existing research, we constructed the LMDI model based on the IPAT model. The transformation of the IPAT model is shown in Equation (1):
$Coal\text{(}I\text{)}=Population\text{(}P\text{)}\times \frac{GDP}{Population}\text{(}A\text{)}\times \frac{Coal}{GDP}\text{(}T\text{)}$
Based on the population effect (P), economic growth effect (A), and technical progress effect (T), as measured in Equation (1), the IPAT model is further expanded as follows:
$C=\sum\limits_{i}{\frac{{{C}_{i}}}{{{E}_{i}}}\times \frac{{{E}_{i}}}{{{G}_{i}}}\times \frac{{{G}_{i}}}{G}\times \frac{G}{P}\times P}\text{=}p\times g\times \sum{{{f}_{i}}\times {{e}_{i}}\times {{s}_{i}}}$
where $C$is the total coal consumption (Mtce); i =1, 2, 3 denotes the primary industry, secondary industry, and tertiary industry, respectively; P = p, $\frac{G}{P}=g,$ and $\frac{{{E}_{i}}}{{{G}_{i}}}={{e}_{i}}$ have the same meanings as P, A, and T, respectively, in Equation (1); $\frac{{{G}_{i}}}{G}={{f}_{i}}$represents the industrial structure effect (F), where Gi is the GDP of the primary industry, secondary industry, and tertiary industry; $\frac{{{C}_{i}}}{{{E}_{i}}}={{s}_{i}}$ denotes the energy structure effect (S), where Gi and Ei are the total coal consumption and energy consumption, respectively, of the primary industry, secondary industry, and tertiary industry.
Then, the change in the total coal consumption in year t compared with the year t-1, ΔC, can be expressed as follows:
$\Delta C={{C}_{t}}-{{C}_{t-1}}=\Delta {{C}_{p}}+\Delta {{C}_{g}}+\Delta {{C}_{f}}+\Delta {{C}_{e}}+\Delta {{C}_{s}}$
Further, the change in the total coal consumption from year t–1 to year $t$ can be decomposed into five components: the population effect (ΔCp), economic growth effect (ΔCg), industrial structure effect (ΔCf), energy intensity effect (ΔCe), and energy structure effect (ΔCs), where
$\Delta {{C}_{p}}=\frac{C_{i}^{t}-C_{i}^{t-1}}{\ln C_{i}^{t}-\ln C_{i}^{t-1}}\ln \left( \frac{p_{{}}^{t}}{p_{{}}^{t-1}} \right)$
$\Delta {{C}_{g}}=\frac{C_{i}^{t}-C_{i}^{t-1}}{\ln C_{i}^{t}-\ln C_{i}^{t-1}}\ln \left( \frac{g_{{}}^{t}}{g_{{}}^{t-1}} \right)$
$\Delta {{C}_{f}}=\frac{C_{i}^{t}-C_{i}^{t-1}}{\ln C_{i}^{t}-\ln C_{i}^{t-1}}\ln \left( \frac{f_{{}}^{t}}{f_{{}}^{t-1}} \right)$
$\Delta {{C}_{e}}=\frac{C_{i}^{t}-C_{i}^{t-1}}{\ln C_{i}^{t}-\ln C_{i}^{t-1}}\ln \left( \frac{e_{{}}^{t}}{e_{{}}^{t-1}} \right)$
$\Delta {{C}_{s}}=\frac{C_{i}^{t}-C_{i}^{t-1}}{\ln C_{i}^{t}-\ln C_{i}^{t-1}}\ln \left( \frac{s_{{}}^{t}}{s_{{}}^{t-1}} \right)$

2.2 Development of IO-based SDA model

Based on IO analyses and building on existing research (Guan et al., 2008; Wang et al., 2017a; Wang et al., 2017b), we constructed a mixed “energy-economy” IO analysis framework (Table 2). The energy factor (coal consumption) expressed in physical quantities is integrated with the IO table that is in monetary terms:
$C=E\times {{(I-A)}^{-1}}\times y$
where C is still the total coal consumption, E is the coal consumption intensity vector by industry, A is the direct consumption coefficient matrix, (I-A)-1 is an n×n Leontief inverse matrix, and y is an n×1 final-demand column vector. Final demand includes the final consumption in quadrant II of the IO table (government consumption, urban household consumption, rural household consumption), gross capital formation (fixed capital formation plus the increase in inventories), and total amount of imports and exports (imports and exports). As shown in Table 2, considering the analysis for coal consumption embodied in trade by using regional IO method, competitive or non-competitive imports assumption processing and normal exports assumption are two important issues on recent trade-related energy or environment studies (Su and Ang, 2013; Su et al., 2013). Drawing on the practice of previous research, this study adopts competitive imports assumption.
Table 2 Coal consumption and economy input-output modelling
Intermediate use Final demands Imports Inter-provincial
import
Total
outputs
1, 2, …, n Consumption Fixed capital formation Exports Inter-provincial export
Intermediate
inputs
1 Xij Yi Xi
2
n
Value added Vj
Total inputs Xj
Coal
consumption
1 Ckj Cky Ck
2
m
As shown in Table 2, the greatest advantage of the IO-based SDA model is that it can fully describe the extent of impacts that final-demand sectors may have on total coal consumption. The total amount of possible decomposition paths is n! in the SDA method, when the number of main influencing factors in n (Dietzenbacher and Los, 1998). The priority is to deal with the non-uniqueness issue in the decomposition process (Hoekstra and van den Bergh, 2002). Owing to the n! forms are equally valid, the average of all n! possible paths is usually adopted to handle this problem and achieve the final ideal result (Rørmose and Olsen, 2005; Guan et al., 2008; Wang et al., 2017a). Based on the classification of final-demand sectors in the IO table, the final-demand column vector y is diagonalized to obtain the following equation:
${{C}_{k}}=E{{(I-A)}^{-1}}{{y}_{k}}$
where yk is the final demand of class k and Ck is the total coal consumption as a result of the change in the final demand of class k.

2.3 Data

Data on population (population size), economy (GDP of the primary industry, the secondary industry, and the tertiary industry), energy consumption (total energy consumption and coal consumption of the primary industry, secondary industry, and tertiary industry) in the LMDI model were primarily taken from the Guangdong Statistical Yearbook (2000-2018) and China Energy Statistical Yearbook (2000-2018). Industry-specific coal consumption and IO data for the industry sector in the SDA model all came from the Guangdong Statistical Yearbook (2000-2018) and the Guangdong Value Input-Output Table (2002, 2005, 2007, 2010, 2012, 2015, and 2017). Then, these seven IO tables comprising 40 or 42 sectors were summarized and consolidated into 20 sectors (Table 3), in order to ensure consistency with coal consumption data at sector level. To enhance the comparability of the data, GDP and GDP by industry are expressed in 2002 prices. Subsequently, the double-deflation method was conducted to convert IO data in constant prices to be able to enhance the comparability of data between years (Peters et al., 2007; Lenzen, 2016).
Table 3 Input-output table in Guangdong province
Code Sector Code Sector
1 Agriculture 11 Metal products
2 Mining 12 General and specialized equipment
3 Foods and tobacco 13 Transportation equipment
4 Textiles 14 Electrical equipment
5 Wood products 15 Electronic equipment
6 Paper and printing 16 Other manufacturing industry
7 Petroleum processing and coking 17 Electricity, gas, water
8 Chemicals 18 Construction
9 Non-metallic mineral processing 19 Transportation
10 Metal smelting and rolling processing 20 Wholesale, retail, other service

3 Empirical analysis

3.1 Analysis of the characteristics of coal consumption evolution in Guangdong

Since 2002, with the rapid economic growth, total energy consumption and coal consumption have been growing in tandem (Figure 1). The GDP has experienced continuous growth, increasing from 1360.18 billion in 2002 to 6426.36 billion yuan (at 2002 constant price) in 2017, with an annual growth rate of 10.69%. Total energy consumption increased from 113.55 Mtce in 2002 to 323.42 Mtce in 2017, with an annual growth rate of 7.37%. According to the growth rates of total energy consumption and GDP, this period can roughly be divided into three phases: (1) During the period from 2002 to 2007, the growth rates of the GDP, total energy consumption, and total coal consumption were all above 10%. (2) Between 2007 and 2012, influenced by the global financial crisis, the GDP of Guangdong Province significantly slowed. Meanwhile, the growth rate of total energy consumption and coal consumption also had a declining trend. Total coal consumption saw negative growth in 2009 and 2012. (3) In 2012-2017, economic development entered the new normal, and GDP growth demonstrated a continuous declining trend after a growth rate of 8.49% in 2013. The declining trend of coal consumption was more evident, as its total consumption continuously declined between 2014 and 2016.
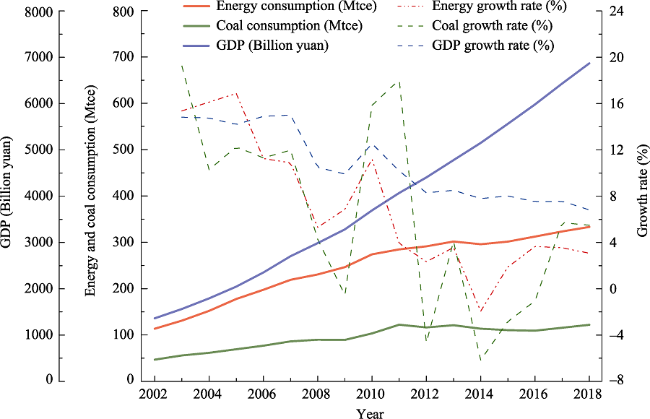
Figure 1 Evolution trends of economic growth, energy consumption and coal consumption in Guangdong

3.2 Factor decomposition analysis of coal consumption changes based on the LMDI model

Employing the IPAT-based LMDI model and in accordance with Equation (1), we performed multilevel factor decomposition analyses for annual coal consumption changes in Guangdong by examining factors of the population, economy, technology, and structure. The results are shown in Figure 2. Overall, since 2002, coal consumption growth in Guangdong has been mainly driven by the economic growth effect and population effect, the former having a stronger impact. This was especially evident between 2002 and 2007, when the economic growth effect intensified every year, and average annual coal consumption grew by 7.86 Mtce. Since 2005, the energy consumption intensity has been the most important factor constraining the fast coal consumption growth in Guangdong except for the period 2002-2005, when the energy consumption intensity in the province demonstrated a growing trend with fluctuations. The impact of the energy structure on total coal consumption varied significantly across phases. This was more evident during 2007-2012, when the energy structure effect had a more significant impact on the increase or decrease in total coal consumption. The energy structure had a significant negative effect on the trend of continuous decline in total coal consumption between 2014 and 2016.
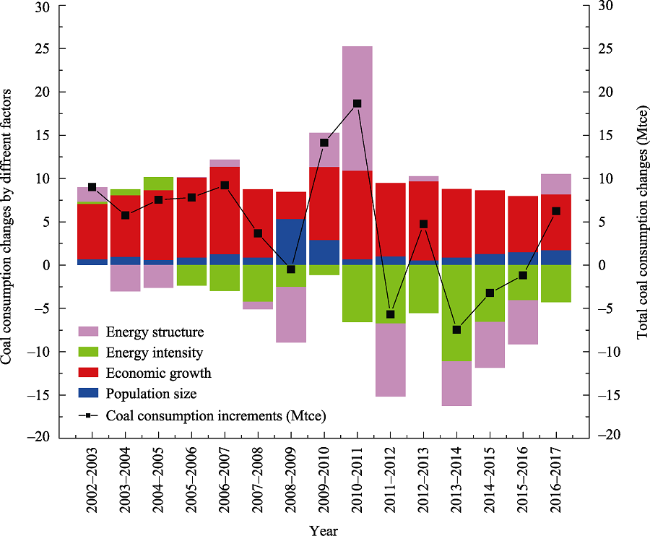
Figure 2 Decomposition analysis of coal consumption from 2002 to 2017
To further reveal the complex trends of coal consumption changes in Guangdong since 2002, we further incorporated the industrial structure effect into Equation (1) and performed phase-by-phase comparison and analyses of the driving mechanism of coal consumption changes between 2002 and 2017 in accordance with Equations (2), (3), and (4). The results are presented in Figure 3 and Table 4.
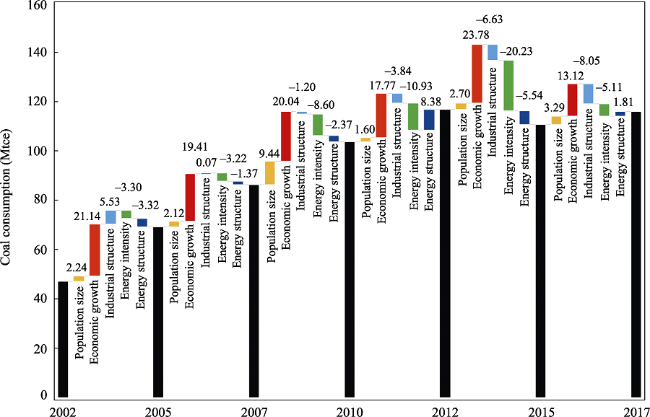
Figure 3 Impacts of key factors on coal consumption in Guangdong
Table 4 Index decomposition analysis of key influencing factors of coal consumption in Guangdong during different periods (Mtce)
p g f1 f2 f3 ΔC
2002-2005 2.2363 21.1358 -0.0712 5.6522 -0.0499 22.2857
2005-2007 2.1161 19.4111 -0.0731 0.1331 0.0119 17.0139
2007-2010 9.4406 20.0416 -0.0385 -1.1803 0.0145 17.3109
2010-2012 1.5986 17.7699 -0.0042 -3.8635 0.0238 12.9679
2012-2015 2.6988 23.7756 -0.0457 -6.6315 0.0436 -5.9335
2015-2017 3.2859 13.1229 -0.0303 -8.0687 0.0476 5.0595
e1 e2 e3 s1 s2 s3
2002-2005 0.0158 -3.3961 0.0837 0.0162 -3.0999 -0.2372
2005-2007 -0.0854 -3.0555 -0.0792 -0.0511 -1.1306 -0.1835
2007-2010 0.1804 -8.7134 -0.0625 -0.2384 -2.0600 -0.0729
2010-2012 -0.3179 -10.5714 -0.0443 0.2571 8.2039 -0.0842
2012-2015 -0.0207 -20.0856 -0.1277 -0.0437 -5.5051 0.0086
2015-2017 0.0024 -5.0596 -0.0499 -0.0279 1.8896 -0.0524
Phase 1: Between 2002 and 2005, with China joining the WTO, Guangdong entered a new era of post-WTO transition, and the economic openness was further enhanced. The province proposed the strategy of optimizing and improving the secondary industry; textiles and clothing, food and beverages, and building materials still constituted the three traditional pillar industries. Even in the Pearl River Delta region, which had seen rapid economic development, there still existed firms with high energy consumption and high pollution, including small glass factories, small cement plants, small oil refineries, small paper mills, small coal-fired power plants, small steel mills, and small coal mines. The proportion of secondary industry saw a rapid growth from 45.76% in 2002 to 50.59% in 2005. The extensive economic growth model reflected the strong reliance on energy as an input factor. Total coal consumption saw a dramatic increase from 46.88 Mtce in 2002 to 69.16 Mtce in 2005, with an annual growth rate of 13.84%. Of the main factors that affect total coal consumption, economic growth, industrial structure, and population generated coal consumption increments of 21.14 Mtce, 5.53 Mtce, and 2.24 Mtce, respectively. The energy consumption structure and energy consumption intensity were important factors that constrained coal consumption growth, and they reduced coal consumption by 3.32 Mtce and 3.30 Mtce, respectively. Meanwhile, the industrial structure effect, energy structure effect, and energy intensity effect were all dominated by the secondary industry (f2, s2, and e2).
Phase 2: Between 2005 and 2007, the total coal consumption increased by 17.01 Mtce, significantly lower than the increase of 22.29 Mtce during Phase 1. In comparison with Phase 1, the positive impact of economic growth and industrial structure on energy consumption growth was significantly weakened. This is especially evident in the industrial structure effect. During this phase, Guangdong enhanced its industrial transformation by upgrading the traditional industries of textiles and clothing, food and beverages, and building materials; accelerating the development of mainstay industries such as automobiles, equipment manufacturing, and steel; and enhancing pillar industries such as electronics and information, petrochemicals, and home appliances. The proportion of secondary industry increased from 50.59% in 2005 to 50.68% in 2007, and the increase in total energy consumption caused by the industrial structure effect was 0.07 Mtce. The energy consumption intensity and energy consumption structure were important factors that affected coal consumption growth. The energy consumption intensity of secondary industry decreased from 0.113 tce/thousand yuan in 2005 to 0.108 tce/thousand yuan in 2007.
Phase 3: Between 2007 and 2010, after the global financial crisis, economic growth slowed, and Guangdong entered a period of deep adjustment to the economic structure. Meanwhile, its implementation of energy-conservation and emission-reduction measures was considerably strengthened. The proportion of secondary industry with high energy consumption steadily declined, and the proportion of tertiary industry continuously grew (from 43.99% to 45.10%). Total coal consumption increased from 86.18 Mtce in 2007 to 103.49 Mtce in 2010. The most significant distinction during this phase was that the industrial structure effect turned from positive during the first two phases to negative here, causing a reduction of 1.20 Mtce in total energy consumption. The energy consumption intensity decreased from 0.081 tce/thousand yuan in 2007 to 0.074 tce/thousand yuan in 2010, causing a reduction of 8.60 Mtce in total energy consumption and constituting the most important factor that constrained energy consumption growth during this phase.
Phase 4: Between 2010 and 2012, Guangdong saw an increase in coal consumption of 12.97 Mtce. The provincial economy entered a new normal in which high GDP growth was no longer the goal of economic development; the GDP growth rate that had been above 10% for many years started to decline. Factors of production were continuously shifted to the secondary and tertiary industries, and the industrial structure kept improving. The impact of economic growth on coal consumption significantly weakened, and the constraining effects of the energy consumption intensity and industrial structure optimization significantly strengthened. The rapid development of the service sector, however, led to fast growth in the demand for electrical power. Development of energy infrastructure (especially for new energy and renewable energy) somewhat lagged behind. As a result of the rapid growth in coal consumption by the electrical power generation and supply industry, the energy structure had a positive impact on coal consumption during this phase, causing an increase in coal consumption of 8.38 Mtce.
Phase 5: Between 2012 and 2015, Guangdong saw negative growth in its coal consumption (-5.93 Mtce) for the first time. The province had been persistent in implementing an innovation-driven development strategy and enhancing the development of the modern service industry. As a result, it gradually weaned itself off the economic growth mode driven by labor, energy, and resources. With the economic growth and continuous improvement of the income level, the province entered a development stage dominated by a service sector with low energy consumption. During this phase, the proportion of tertiary industry saw rapid growth, from 46.89% in 2012 to 50.14% in 2015. The energy consumption intensity kept declining, from 0.066 tce/thousand yuan in 2012 to 0.054 tce/thousand yuan in 2015. The energy consumption intensity, industrial structure, and energy structure jointly created a negative effect of constraining coal consumption growth, and the negative effect was stronger than that in the previous phase. The energy intensity effect, industrial structure effect, and energy structure effect were all dominated by secondary industry (f2, e2, and s2).
Phase 6: Between 2015 and 2017, coal consumption rebounded in Guangdong, with an increase of 5.06 Mtce. Despite the economic slowdown, economic growth was still the most important factor that drove up coal consumption. The proportion of secondary industry decreased from 45.54% to 42.37%, and tertiary industry saw an increase from 50.14% to 53.60%. Optimization of the industrial structure kept imposing a negative effect on coal consumption growth, and for the first time, its effect exceeded that of energy intensity, becoming the most important factor constraining coal consumption growth. The energy consumption intensity slowly declined, from 0.0542 tce/thousand yuan in 2015 to 0.0503 tce/thousand yuan in 2017; its effect in constraining coal consumption significantly decreased. As a result of the growth in coal consumption by the electrical power generation and supply industry, the energy structure had a positive impact on coal consumption during this phase, causing an increase in coal consumption of 8.38 Mtce. A new round of infrastructure development stimulated high demand for electricity, but electrical power from renewable energy could not meet the demand. As a result of the growth in coal consumption by the electrical power generation and supply industry, the energy structure had a positive impact on coal consumption during this phase, leading to an increase in coal consumption of 1.81 Mtce.

3.3 SDA of coal consumption changes based on the IO model

The factor decomposition analysis performed above mainly examines the impacts of such factors as economic growth, industrial structure, energy intensity, and energy structure. It focuses on the supply side to analyze the mechanism through which the factors affect coal consumption. To more comprehensively identify the driving mechanism of coal consumption in Guangdong, building on supply-side analysis, we developed a mixed “energy-economy” IO analysis framework. Further, in accordance with Equation (9), we conducted SDA for the demand-side factors that affect coal consumption, and the results are shown in Figure 4.
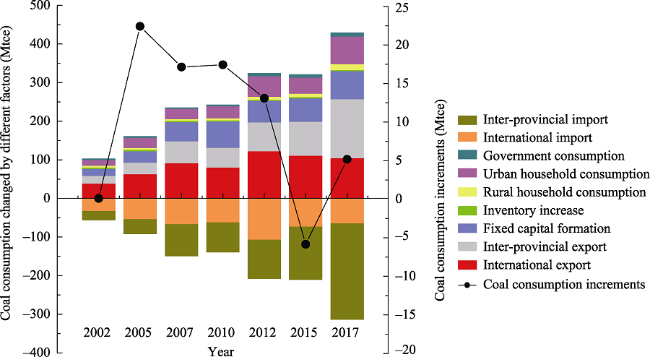
Figure 4 Structural decomposition analysis of Guangdong's coal consumption from 2002 to 2017
From the demand-side perspective, international exports, inter-provincial exports, fixed capital formation, and urban household consumption are the most important factors that have affected coal consumption changes in Guangdong.
Before 2007, the rapid industrialization and fast growth in processing trade promptly turned Guangdong into a world factory that attracted global attention. Exports were the most important demand-side factor that drove coal consumption growth between 2002 and 2007 (Figure 4). As a result of international exports, coal consumption experienced a rapid increase, from 38.26 Mtce in 2002 to 90.97 Mtce in 2007. Between 2002 and 2007, coal consumption growth by industry was mainly driven by exports. Increases in coal consumption were concentrated in highly energy-consuming industries, such as electronic equipment (15), papermaking (6), textiles (4), and non-metallic mineral products (9) (Figure 5). These industries were also among those that participated in globalization to a high degree in Guangdong. Especially after 2000, these industries further received international industrial relocation; exports accounted for a relatively large portion of these industries’ production, and the industries were mainly driven by foreign capital.
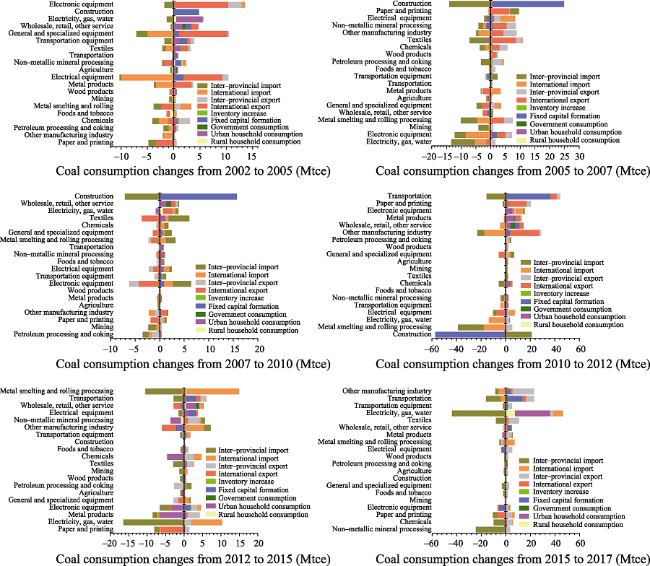
Figure 5 Structural decomposition analysis of coal consumption by sectors in Guangdong during different stages
Between 2007 and 2010, to cope with the negative impact of the 2007 global financial crisis on economic development, China implemented the “four trillion” investment plan, significantly increasing the impact of fixed capital formation on coal consumption. The investment was mainly in urban and rural infrastructure and key transportation infrastructure (18) (Figure 5).
After 2012, coal consumption embedded in international exports showed a gradual declining trend, while that embedded in inter-provincial exports rapidly grew. After the global financial crisis, the trade structure of Guangdong entered a deep adjustment period. The economy entered a new normal, and the international export structure experienced continuous, profound changes. As a result of Guangdong’s role in international trade, the extent to which the province participated in the global value chain, and its position in the global value chain, Guangdong’s international export trade experienced a transformation from labor- and resource-intensive products to high-value-added products with low energy consumption; this in turn forced industries to undergo production structure upgrading (Wang et al., 2019; Wang et al., 2020c; Xu et al., 2020). Coal consumption embedded in the papermaking industry (6) decreased from 20.01 Mtce in 2012 to 13.73 Mtce in 2015. As the region with the highest degree of openness and strongest economic vitality in China, Guangdong is at the forefront and is the exemplar of the international cycle through which China merges into the global market and global value chain. It also evolved into a region that has the closest and most active economic ties with the major metropolitan areas in China. Guangdong has become an example of the mutual reinforcement between the international market cycles and domestic market cycles. Coal consumption embedded in inter-provincial exports was mainly in the non-metallic mineral product industry (9), chemicals (8), metal products (11), textiles (4), and other manufacturing industry (16).
Household consumption, especially urban household consumption, was another demand-side factor that drove coal consumption. Especially after 2012, with the gradual decline in the international exports and the implementation of the policy of boosting domestic demand, coal consumption induced by urban household consumption experienced continuous growth, from 15.03 Mtce in 2002 to 26.88 Mtce in 2007, 52.99 Mtce in 2012, and 71.79 Mtce in 2017. The industries driven by urban household consumption were mainly the wholesale and retail industry (20) and electrical power generation and supply industry (17) (Figure 5). Given that the main conflict of our society at present is the conflict between the demand caused by people’s growing expectation for a happy life and the imbalance and incompleteness of the current state of economic development, energy conservation and emission reduction at the consumption side will become more important in the future.

4 Conclusions and discussion

4.1 Conclusions

Based on coal consumption data for Guangdong Province between 2002 and 2017, this paper develops a supply-side LMDI model and a demand-side IO-SDA model to systematically identify key factors that drive coal consumption in Guangdong. The major conclusions are as follows:
(1) According to the factor decomposition analysis from the supply side, coal consumption in Guangdong is mainly driven by the economic growth effect, energy intensity effect, industrial structure effect, and energy structure effect. The economic growth effect has been the most important factor driving coal consumption growth, while the energy intensity effect is the most important factor constraining coal consumption growth. The effects of the industrial structure and energy structure in controlling coal consumption vary depending on the development phase. It should be noted, however, that the slowdown of GDP growth since the economy entered the new normal has been an important factor that contributed to the decrease in total coal consumption since 2012, and the continuous shrinkage of the energy consumption intensity and deep adjustments of the industrial structure and energy structure constituted other important factors.
(2) According to the supply-side SDA, coal consumption in Guangdong is mainly affected by international exports, inter-provincial exports, fixed capital formation, and urban household consumption. Since 2000, under the dual impact of economic globalization and international industrial relocation, Guangdong has become a province with a strong international trade sector and manufacturing sector. Imports and exports constitute the province’s major economic activities, and international exports have become the most important factor driving coal consumption in Guangdong. This driving mechanism grew gradually stronger before the financial crisis (2002-2007). After the financial crisis, China implemented the “four trillion” investment plan, and fixed capital formation was another important factor that drove coal consumption growth during this period (2007-2010). After 2012, in the process of upgrading the economic structure and adjusting and optimizing the international trade structure, demand by the domestic market further expanded. Coal consumption embedded in international exports displayed a gradual declining trend, while coal consumption embedded in inter-provincial exports grew rapidly. With the continuously rising urbanization level, the impact of urban household consumption on coal consumption has significantly increased.
(3) According to the structural decomposition analysis at the industrial sector level, due to the impact of the final demand scale and changes in the final demand structure, the growth in total coal consumption at the demand side has been driven by international exports, fixed capital formation, and inter-provincial exports and urban household consumption. The industries with the fastest growth of coal consumption driven by final demand have experienced a shift: from electronic equipment (15), construction (18), and papermaking (6) before the financial crisis to construction (18), transportation (19), and metal smelting and rolling (10) after the financial crisis. Since 2015, the industries with the fastest consumption growth driven by final demand are mainly concentrated in the other manufacturing sector (16), transportation (19), manufacturing of transportation equipment (13), electrical power generation and supply (17), and textiles (4), and this consumption has mainly been driven by inter-provincial exports and urban household consumption.

4.2 Discussion

Based on the systematic analyses above, as Guangdong has gone through nearly two decades of high growth in the new century, the province has gradually settled on an economic growth mode aimed at high-quality development, and the goal of controlling total coal consumption has been incrementally achieved. Different development phases show distinct characteristics of coal consumption in Guangdong, and the driving mechanisms of coal consumption demonstrate significant temporal heterogeneity. The driving mechanism and extent of impact of the influencing factors of coal consumption vary across development phases.
As a result of the low to medium growth since the economy entered the new normal, the weakened demand from international exports, the continuous decline in energy consumption intensity, and the deep optimization of the industrial structure, Guangdong saw a decrease in coal consumption three years in a row from 2014 to 2016. The increase in the proportion of coal consumption in the energy structure in 2017 was merely a superficial phenomenon on the production side; the deeper cause lies in the impact of the inter-provincial exports and urban household consumption on the demand side. In 2018, Guangdong Province promulgated the “Work Plan for 2018 to Win the Blue Sky Defense War”, which clearly stated that “by 2020, total coal consumption in Guangdong Province will be controlled at around 165 million tons.” Through strengthening the “dual control” measures of total energy consumption and energy consumption intensity, work should be done to strictly implement the province’s total coal consumption control plan, and make good efforts to reduce and replace coal consumption in the Pearl River Delta. The total coal consumption in Guangdong decreased from 171 million tons in 2018 to 168 million tons in 2019 and then to 155 million tons in 2020.
Therefore, to study the energy consumption issues of subnational regions, we should systematically analyze, on global, national, and regional scales, the impact of the production side (scale, structure, and technology) and demand side (investment, consumption, and export) on regional energy consumption. We should not only focus on international exports in the context of economic globalization but also pay more attention to inter-provincial exports under the background of strengthened interregional connections. Against the backdrop of establishing a “dual circulation” development pattern in which the domestic economic circulation plays a leading role while supplementing (and being supplemented by) international economic circulation, Guangdong is the forefront demonstration zone of deeply embedding into the global value chain and merging into the international economic cycle; it has also evolved into a region with the closest and most active economic ties to the major economic regions in China.
Due to the industrial transfer and export trade brought by economic globalization, Guangdong Province has taken over a certain amount of coal consumption in the development of export-oriented economy, resulting in the problem of “energy leakage” during the process of “the large circulation of international economy”. At the same time, in the process of external economic development, the inter-provincial imports and exports within the national borders caused Guangdong Province to transfer a part of its coal consumption to the trade-transfer provinces, thereby pointing to the existence of the “energy transfer” problem during the process of “the large circulation of domestic economy”. “Energy transfer” and “Energy leakage” will co-exist in the “dual circulation” process. As for energy embodied in international and domestic trade, processing and normal exports assumption is a key issue for a deep understanding of the trade-related coal consumption (Su et al., 2013). Owing to the limits of statistics to fully identify the destination and source of these imports, coal consumption intensities used for international and domestic trades are the same assumptions in this case study. Practically, coal consumption embodied in international and domestic imports has different coal consumption intensities (Wang et al., 2017a). In addition, a large number of exports produced in Guangdong Province are processing exports, whose energy consumption intensities are much lower than its normal exports. These unique features in the manufacturing sectors will highlight the importance of trade structure and energy intensity in deeply understanding coal consumption in Guangdong Province, as well as other export-oriented and manufacturing provinces in China. Conducting in-depth research on Guangdong’s energy consumption under the “dual circulation” development pattern and identifying the driving mechanisms of coal consumption from both the supply side and demand side provides local insight that can be applied to other parts of the nation in order to implement the strategies of total energy consumption control and reducing coal consumption and replacing coal with other energy sources.
[1]
Ang B W, 2005. The LMDI approach to decomposition analysis: A practical guide. Energy Policy, 33(7): 867-871.

DOI

[2]
Ang B W, Choi K H, 1997. Decomposition of aggregate energy and gas emission intensities for industry: A refined Divisia index method. Energy Journal, 18(3): 59-73.

[3]
Ang B W, Lee S Y, 1994. Decomposition of industrial energy consumption: Some methodological and application issues. Energy Economics, 16(2): 83-92.

DOI

[4]
Ang B W, Zhang F Q, 2000. A survey of index decomposition analysis in energy and environmental studies. Energy, 25(12): 1149-1176.

DOI

[5]
Bhattacharya M, Rafiq S, Bhattacharya S, 2015. The role of technology on the dynamics of coal consumption-economic growth: New evidence from China. Applied Energy, 154: 686-695.

DOI

[6]
Bloch H, Rafiq S, Salim R, 2012. Coal consumption, CO2 emission and economic growth in China: Empirical evidence and policy responses. Energy Economics, 34(2): 518-528.

DOI

[7]
BP, 2019. Statistical Review of World Energy.

[8]
Chai J, Du M, Liang T et al., 2019. Coal consumption in China: How to bend down the curve? Energy Economics, 80: 38-47.

DOI

[9]
Chen H, Meng J, 2017. Emissions inventory and scenario analyses of air pollutants in Guangdong Province, China. Frontiers of Earth Science, 11(1): 46-62.

DOI

[10]
Chen J, Wu Y, Song M et al., 2018. The residential coal consumption: Disparity in urban-rural China. Resources, Conservation and Recycling, 130: 60-69.

[11]
Chen X-M, Liang Q-M, Liu L-C et al., 2019. Critical structural adjustment for controlling China's coal demand. Journal of Cleaner Production, 235: 317-327.

DOI

[12]
Chong C, Ma L, Li Z et al., 2015. Logarithmic mean Divisia index (LMDI) decomposition of coal consumption in China based on the energy allocation diagram of coal flows. Energy, 85: 366-378.

DOI

[13]
Chu S, Majumdar A, 2012. Opportunities and challenges for a sustainable energy future. Nature, 488(7411): 294-303.

DOI

[14]
Dietzenbacher E, Los B, 1998. Structural decomposition techniques: Sense and sensitivity. Economic Systems Research, 10(4): 307-324.

DOI

[15]
Gong P, Liang S, Carlton E J et al., 2012. Urbanisation and health in China. The Lancet, 379(9818): 843-852.

DOI

[16]
Guan D, Hubacek K, Weber C L et al., 2008. The drivers of Chinese CO2 emissions from 1980 to 2030. Global Environmental Change, 18(4): 626-634.

DOI

[17]
Guan D, Meng J, Reiner D M et al., 2018. Structural decline in China’s CO2 emissions through transitions in industry and energy systems. Nature Geoscience, 11(8): 551-555.

DOI

[18]
He G, Lin J, Zhang Y et al., 2020. Enabling a rapid and just transition away from coal in China. One Earth, 3(2): 187-194.

DOI

[19]
Hoekstra R, van den Bergh J C J M, 2002. Structural decomposition analysis of physical flows in the economy. Environmental and Resource Economics, 23(3): 357-378.

DOI

[20]
Lenzen M, 2016. Structural analyses of energy use and carbon emissions: An overview. Economic Systems Research, 28(2): 119-132.

DOI

[21]
Leontief W, 1936. Quantitative input and output relations in the economic systems of the United States. The Review of Economics and Statistics, 18(3): 105-125.

DOI

[22]
Leontief W, 1970. Environmental repercussions and the economic structure: An input-output approach. The Review of Economics and Statistics, 52(3): 262-271.

DOI

[23]
Li R, Leung G C K, 2012. Coal consumption and economic growth in China. Energy Policy, 40: 438-443.

DOI

[24]
Lin B, Li Z, 2020. Spatial analysis of mainland cities’ carbon emissions of and around Guangdong-Hong Kong-Macao Greater Bay area. Sustainable Cities and Society, 61: 102299.

DOI

[25]
Lin B, Liu J H, Yang Y C, 2012. Impact of carbon intensity and energy security constraints on China's coal import. Energy Policy, 48: 137-147.

DOI

[26]
Liu G, Casazza M, Tian X et al., 2017. Tracing the inter-regional coal flows and environmental impacts in Jing-Jin-Ji region. Ecological Modelling, 364(Suppl. C): 98-112.

DOI

[27]
Liu L-C, Cheng L, Zhao L-T et al., 2020. Investigating the significant variation of coal consumption in China in 2002-2017. Energy, 207: 118307.

DOI

[28]
Liu Y, Yan B, Zhou Y, 2016. Urbanization, economic growth, and carbon dioxide emissions in China: A panel cointegration and causality analysis. Journal of Geographical Sciences, 26(2): 131-152.

DOI

[29]
Michieka N M, Fletcher J J, 2012. An investigation of the role of China's urban population on coal consumption. Energy Policy, 48: 668-676.

DOI

[30]
Ou J, Meng J, Shan Y et al., 2019. Initial declines in China’s provincial energy consumption and their drivers. Joule, 3(5): 1163-1168.

DOI

[31]
Peters G P, Weber C L, Guan D et al., 2007. China’s growing CO2 emissions: A race between increasing consumption and efficiency gains. Environmental Science & Technology, 41(17): 5939-5944.

DOI

[32]
Qiao H, Chen S, Dong X et al., 2019. Has China’s coal consumption actually reached its peak? National and regional analysis considering cross-sectional dependence and heterogeneity. Energy Economics, 84: 104509.

DOI

[33]
Riker D A, 2012. International coal trade and restrictions on coal consumption. Energy Economics, 34(4): 1244-1249.

DOI

[34]
Rørmose P, Olsen T, 2005. Structural decomposition analysis of air emissions in Denmark 1980-2002. 15th International Conference on Input-Output Techniques.

[35]
Rose A, Casler S, 1996. Input-output structural decomposition analysis: A critical appraisal. Economic Systems Research, 8(1): 33-62.

DOI

[36]
Shealy M, Dorian J P, 2010. Growing Chinese coal use: Dramatic resource and environmental implications. Energy Policy, 38(5): 2116-2122.

DOI

[37]
Shen L, Gao T-M, Cheng X, 2012. China's coal policy since 1979: A brief overview. Energy Policy, 40: 274-281.

[38]
Shen L, Sun Y, 2016. Review on carbon emissions, energy consumption and low-carbon economy in China from a perspective of global climate change. Journal of Geographical Sciences, 26(7): 855-870.

DOI

[39]
Steckel J C, Edenhofer O, Jakob M, 2015. Drivers for the renaissance of coal. Proceedings of the National Academy of Sciences, 112(29): E3775-E3781.

[40]
Su B, Ang B W, 2013. Input-output analysis of CO2 emissions embodied in trade: Competitive versus non-competitive imports. Energy Policy, 56: 83-87.

DOI

[41]
Su B, Ang B W, Low M, 2013. Input-output analysis of CO2 emissions embodied in trade and the driving forces: Processing and normal exports. Ecological Economics, 88: 119-125.

DOI

[42]
Tang X, Jin Y, McLellan B C et al., 2018. China’s coal consumption declining: Impermanent or permanent? Resources, Conservation and Recycling, 129: 307-313.

[43]
Tollefson J, Van Noorden R, 2012. Slow progress to cleaner coal. Nature, 484(7393): 151-152.

DOI

[44]
Wang C, Li B-B, Liang Q-M et al., 2018. Has China’s coal consumption already peaked? A demand-side analysis based on hybrid prediction models. Energy, 162: 272-281.

DOI

[45]
Wang C, Miao Z, Chen X et al., 2021a. Factors affecting changes of greenhouse gas emissions in Belt and Road countries. Renewable and Sustainable Energy Reviews, 147: 111220.

DOI

[46]
Wang C, Wang F, 2017. China can lead on climate change. Science, 357(6353): 764-764.

[47]
Wang C, Wang F, Huang G et al., 2021b. Examining the dynamics and determinants of energy consumption in China’s megacity based on industrial and residential perspectives. Sustainability, 13(2): 764.

DOI

[48]
Wang C, Wang F, Zhang X et al., 2017a. Analysis of influence mechanism of energy-related carbon emissions in Guangdong: Evidence from regional China based on the input-output and structural decomposition analysis. Environmental Science and Pollution Research, 24(32): 25190-25203.

DOI

[49]
Wang C, Wang F, Zhang X et al., 2017b. Influencing mechanism of energy-related carbon emissions in Xinjiang based on the input-output and structural decomposition analysis. Journal of Geographical Sciences, 27(3): 365-384.

DOI

[50]
Wang F, Wang C, Chen J et al., 2020a. Examining the determinants of energy-related carbon emissions in Central Asia: Country-level LMDI and EKC analysis during different phases. Environment, Development and Sustainability, 22(8): 7743-7769.

[51]
Wang J, Dong Y, Wu J et al., 2011. Coal production forecast and low carbon policies in China. Energy Policy, 39(10): 5970-5979.

DOI

[52]
Wang J, Lei Y, Yang J et al., 2012. China’s air pollution control calls for sustainable strategy for the use of coal. Environmental Science & Technology, 46(8): 4263-4264.

DOI

[53]
Wang J, Wang S, Li S et al., 2019. Evaluating the energy-environment efficiency and its determinants in Guangdong using a slack-based measure with environmental undesirable outputs and panel data model. Science of the Total Environment, 663: 878-888.

DOI

[54]
Wang M, Feng C, 2018. Decomposing the change in energy consumption in China’s nonferrous metal industry: An empirical analysis based on the LMDI method. Renewable and Sustainable Energy Reviews, 82(Part 3): 2652-2663.

DOI

[55]
Wang P, Yang M, Mamaril K et al., 2021c. Explaining the slow progress of coal phase-out: The case of Guangdong-Hong Kong-Macao Greater Bay Region. Energy Policy, 155: 112331.

DOI

[56]
Wang S, Fang C, Ma H et al., 2014. Spatial differences and multi-mechanism of carbon footprint based on GWR model in provincial China. Journal of Geographical Sciences, 24(4): 612-630.

DOI

[57]
Wang S, Gao S, Huang Y et al., 2020b. Spatiotemporal evolution of urban carbon emission performance in China and prediction of future trends. Journal of Geographical Sciences, 30(5): 757-774.

DOI

[58]
Wang S, Xie Z, Wu R, 2020c. Examining the effects of education level inequality on energy consumption: Evidence from Guangdong Province. Journal of Environmental Management, 269: 110761.

DOI

[59]
Wu X F, Chen G Q, 2018. Coal use embodied in globalized world economy: From source to sink through supply chain. Renewable and Sustainable Energy Reviews, 81: 978-993.

DOI

[60]
Wu Y, Zhang W, 2016. The driving factors behind coal demand in China from 1997 to 2012: An empirical study of input-output structural decomposition analysis. Energy Policy, 95: 126-134.

DOI

[61]
Xu X, Huang G, Liu L et al., 2020. Revealing dynamic impacts of socioeconomic factors on air pollution changes in Guangdong Province, China. Science of the Total Environment, 699: 134178.

DOI

[62]
Yan J, Su B, 2020. What drive the changes in China's energy consumption and intensity during 12th Five-Year Plan period? Energy Policy, 140: 111383.

DOI

[63]
Zhang L, He C, Yang A et al., 2018a. Modeling and implication of coal physical input-output table in China: Based on clean coal concept. Resources, Conservation and Recycling, 129: 355-365.

[64]
Zhang M, Bai C, Zhou M, 2018b. Decomposition analysis for assessing the progress in decoupling relationship between coal consumption and economic growth in China. Resources, Conservation and Recycling, 129: 454-462.

DOI

[65]
Zhou Y, Shan Y, Liu G et al., 2018. Emissions and low-carbon development in Guangdong-Hong Kong-Macao Greater Bay Area cities and their surroundings. Applied Energy, 228: 1683-1692.

DOI

Options
Outlines

/