
Journal of Geographical Sciences >
Energy globalization of China: Trade, investment, and embedded energy flows
|
Yang Yu (1984-), Professor, specialized in energy geography and regional studies. E-mail: yangyu@igsnrr.ac.cn |
Received date: 2021-11-30
Accepted date: 2022-01-10
Online published: 2022-05-25
Supported by
National Natural Science Foundation of China(42022007)
National Natural Science Foundation of China(41871118)
Youth Innovation Promotion Association, Chinese Academy of Sciences(2018069)
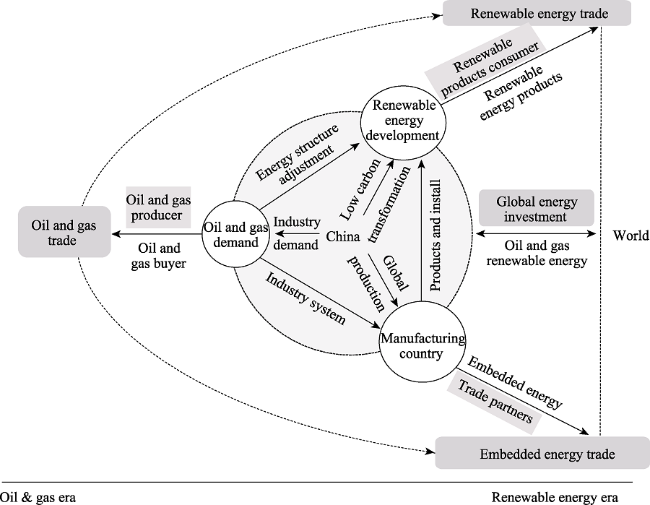
China is in a critical period of transforming from the oil and gas era to the renewable energy era. To better understand the process of energy interaction between China and the rest of the world, this study aimed to investigate the basic theoretical cognition of global energy interaction and analyze the pattern and changes of energy interaction between China and the rest of the world with the method of complex networks, multi-region input-output analysis, and other technical methods. The main findings are as follows: (1) Chinas coal-based energy production structure and the huge demand for oil and gas indicate that ensuring overseas oil and gas supply is the most direct logic of energy interaction between China and the rest of the world, and the interaction scopes are mainly concentrated in oil- and gas-rich countries and regions. (2) With the development of renewable energy, the logic of energy interaction of China with the rest of the world has changed from countries and regions rich in oil and gas to countries with global renewable energy development and installation needs for its comparative advantages for manufacturing, which forms a renewable energy trade map that covers all major countries and regions in the world. (3) The overseas energy investment target of China has expanded from a limited number of host countries to Europe, Southeast Asia, and other countries and regions. The investment business is not only limited to the oil and gas field, but also expanded to solar energy, wind energy, hydro-power, and other renewable electricity generation projects. (4) As a global manufacturing and trading power, part of the energy consumed by China is embodied in the global production network and trade network for redistribution. The scope of energy interactions between China and the world will further expand to countries with general commodity trade relations with China, forming the global “energy hub” function. This study can provide a theoretical perspective and decision-making for a deeper understanding of the energy interactions between China and the world, maintaining national energy security, and participating in global energy economic governance.
YANG Yu . Energy globalization of China: Trade, investment, and embedded energy flows[J]. Journal of Geographical Sciences, 2022 , 32(3) : 377 -400 . DOI: 10.1007/s11442-022-1952-2
Figure 1 Logic of energy interaction between China and the world |
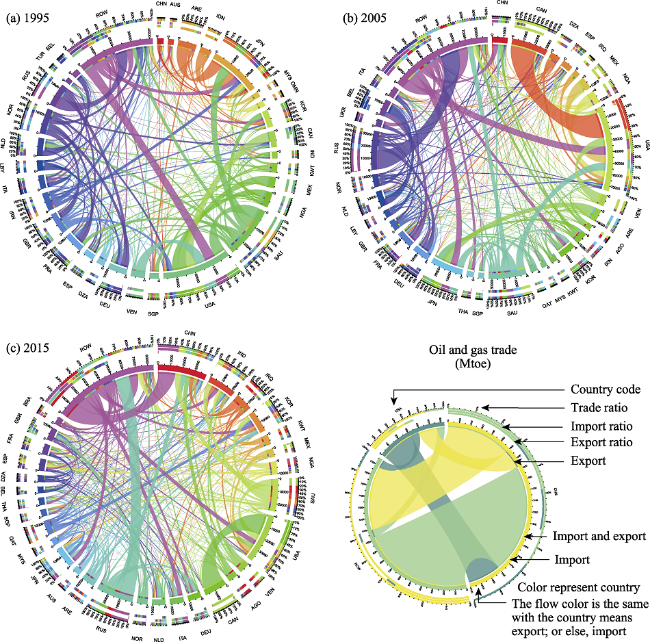
Figure 2 Oil and gas interaction between China and the world |
Table 1 Weighted-in degree of the top ten countries in crude oil and gas trade in 1995, 2005, and 2015 |
| 1995 | 2005 | 2015 | ||||
|---|---|---|---|---|---|---|
| No. | Country | Weighted-in degree | Country | Weighted-in degree | Country | Weighted-in degree |
| 1 | USA | 36.97 | USA | 70.75 | China | 38.95 |
| 2 | Japan | 27.61 | Japan | 28.11 | USA | 37.98 |
| 3 | France | 10.52 | France | 14.40 | India | 22.28 |
| 4 | Germany | 10.05 | South Korea | 14.12 | South Korea | 17.53 |
| 5 | South Korea | 9.22 | China | 12.67 | Japan | 16.85 |
| 6 | Italy | 7.23 | Germany | 11.46 | Italy | 11.28 |
| 7 | Netherland | 6.36 | Belgium | 9.76 | Spain | 9.12 |
| 8 | Spain | 5.79 | Italy | 8.90 | Germany | 9.05 |
| 9 | Singapore | 5.12 | Spain | 8.68 | France | 8.45 |
| 10 | United Kingdom | 4.16 | Canada | 8.13 | Netherland | 7.92 |
| 19 | China | 0.17 | ||||
Table 2 Top ten countries exporting oil and gas to China in 1995, 2005, and 2015 (Mtoe) |
| 1995 | 2005 | 2015 | |||||||
|---|---|---|---|---|---|---|---|---|---|
| No. | Country | Import | Ratio (%) | Country | Import | Ratio (%) | Country | Import | Ratio (%) |
| 1 | Indonesia | 5.28 | 30.86 | Saudi Arabia | 22.18 | 17.49 | Saudi Arabia | 50.54 | 12.97 |
| 2 | Oman | 3.65 | 21.36 | Angola | 17.46 | 13.77 | Russia | 42.67 | 10.95 |
| 3 | Yemen | 2.47 | 14.46 | Iran | 14.27 | 11.25 | Angola | 38.71 | 9.93 |
| 4 | Angola | 1.00 | 5.84 | Russia | 12.78 | 10.08 | Oman | 32.15 | 8.25 |
| 5 | Iran | 0.93 | 5.44 | Oman | 10.83 | 8.54 | Iraq | 32.11 | 8.24 |
| 6 | Vietnam | 0.76 | 4.45 | Yemen | 6.84 | 5.39 | Iran | 26.62 | 6.83 |
| 7 | Malaysia | 0.59 | 3.44 | Sudan | 6.62 | 5.22 | Turkmenistan | 24.89 | 6.39 |
| 8 | Nigeria | 0.39 | 2.28 | Congo | 5.53 | 4.36 | Venezuela | 16.01 | 4.11 |
| 9 | UAE | 0.37 | 2.15 | Indonesia | 4.09 | 3.22 | Kuwait | 14.43 | 3.70 |
| 10 | Saudi Arabia | 0.35 | 2.03 | Ecuador | 3.71 | 2.92 | Brazil | 13.92 | 3.57 |
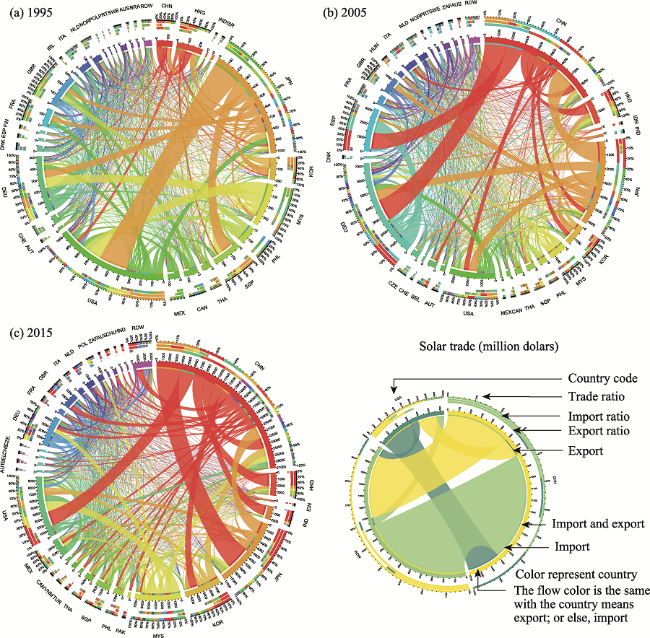
Figure 3 Photovoltaic trade interactions between China and the world from 1995 to 2015 |
Table 3 Weighted-out degree of the top ten countries/regions in photovoltaic trade in 1995, 2005, and 2015 |
| 1995 | 2005 | 2015 | ||||
|---|---|---|---|---|---|---|
| No. | Country | Weighted-out degree | Country | Weighted-out degree | Country | Weighted-out degree |
| 1 | Japan | 8.12 | China | 59.96 | China | 197.87 |
| 2 | America | 3.47 | Japan | 53.06 | Malaysia | 63.37 |
| 3 | Malaysia | 3.20 | Germany | 26.12 | Japan | 52.33 |
| 4 | Germany | 2.13 | America | 13.54 | South Korea | 35.23 |
| 5 | Philippines | 1.62 | Malaysia | 13.08 | Germany | 25.18 |
| 6 | China | 1.03 | Philippines | 6.40 | America | 15.10 |
| 7 | South Korea | 0.99 | United Kingdom | 5.82 | Philippines | 12.12 |
| 8 | China Hong Kong | 0.98 | South Korea | 4.60 | Singapore | 12.09 |
| 9 | United Kingdom | 0.84 | Thailand | 4.26 | Mexico | 11.14 |
| 10 | Canada | 0.73 | Netherlands | 3.51 | Thailand | 7.78 |
Table 4 Top ten countries/regions exporting photovoltaic devices to China in 1995, 2005, and 2015 (million USD) |
| 1995 | 2005 | 2015 | ||||
|---|---|---|---|---|---|---|
| No. | Country/Region | Export | Country/Region | Export | Country/Region | Export |
| 1 | China Hong Kong | 56.70 | Germany | 1666.43 | Japan | 3937.11 |
| 2 | South Korea | 11.60 | Spain | 1279.86 | America | 2429.37 |
| 3 | Germany | 8.47 | China Hong Kong | 660.07 | China Hong Kong | 1944.98 |
| 4 | America | 8.21 | America | 395.98 | India | 1607.93 |
| 5 | Japan | 7.52 | South Korea | 346.22 | South Korea | 1261.74 |
| 6 | Italy | 2.60 | Japan | 325.18 | United Kingdom | 789.91 |
| 7 | Singapore | 2.12 | Italy | 221.75 | Germany | 505.99 |
| 8 | France | 1.40 | Belgium | 182.75 | Pakistan | 434.86 |
| 9 | Canada | 1.09 | Singapore | 59.35 | Australia | 408.73 |
| 10 | Spain | 0.59 | France | 48.17 | Mexico | 406.71 |
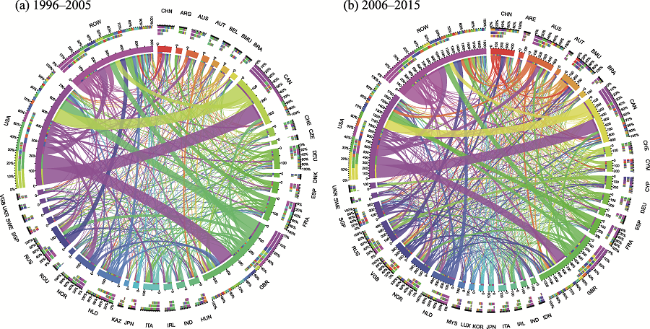
Figure 4 World transnational oil and gas M&A network in 1996-2005 and 2006-2015(Note: the legend refers to Figures 2 and 3) |
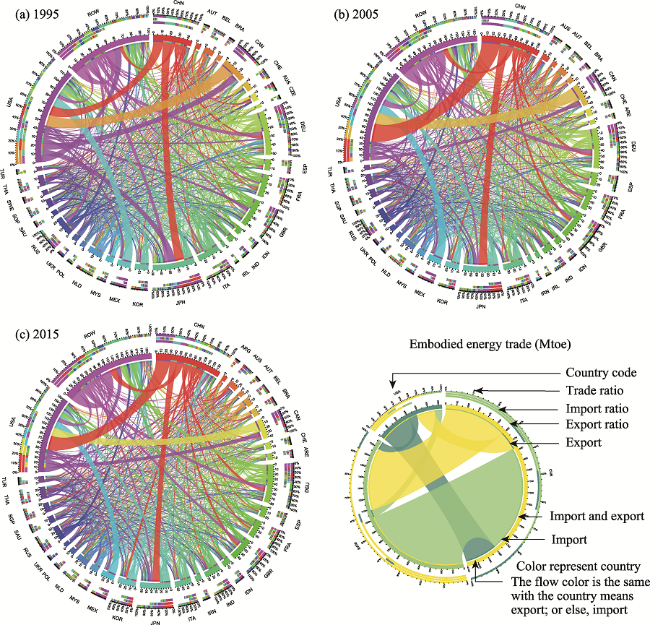
Figure 5 The evolution of China’s embodied energy trade pattern from the perspective of globalization |
Table 5 Top ten countries of China’s embodied energy export in 1995, 2005 and 2015 (Mtoe) |
| No. | 1995 | 2005 | 2015 | |||
|---|---|---|---|---|---|---|
| Country | Export | Country | Export | Country | Export | |
| 1 | America | 11.90 | America | 35.30 | America | 30.90 |
| 2 | Japan | 11.00 | Japan | 17.20 | Japan | 15.30 |
| 3 | Germany | 2.55 | Germany | 5.18 | Germany | 5.47 |
| 4 | United Kingdom | 1.52 | United Kingdom | 4.37 | United Kingdom | 4.85 |
| 5 | Australia | 1.50 | South Korea | 2.88 | South Korea | 4.78 |
| 6 | South Korea | 1.16 | France | 2.70 | Australia | 3.38 |
| 7 | France | 1.12 | Australia | 2.42 | Canada | 3.09 |
| 8 | Canada | 0.80 | Canada | 2.39 | France | 2.66 |
| 9 | Thailand | 0.64 | Spain | 1.75 | India | 1.99 |
| 10 | Italy | 0.62 | Italy | 1.69 | Italy | 1.70 |
| [1] |
|
| [2] |
|
| [3] |
|
| [4] |
|
| [5] |
|
| [6] |
|
| [7] |
|
| [8] |
|
| [9] |
|
| [10] |
|
| [11] |
|
| [12] |
|
| [13] |
|
| [14] |
|
| [15] |
|
| [16] |
|
| [17] |
|
| [18] |
|
| [19] |
|
| [20] |
International Energy Agency (IEA), 2015. World Energy Outlook 2015. Organization for Economic Co-Operation and Development, OECD.
|
| [21] |
International Energy Agency (IEA), 2016. China’s Engagement in Global Energy Governance, Paris.
|
| [22] |
International Renewable Energy Agency (IREA), 2019. A new world: The geopolitics of the energy transformation. https://www.irena.org/publications/2019/Jan/A-New-World-The-Geopolitics-of-the-Energy-Transformation.
|
| [23] |
|
| [24] |
|
| [25] |
|
| [26] |
|
| [27] |
|
| [28] |
|
| [29] |
|
| [30] |
|
| [31] |
|
| [32] |
|
| [33] |
|
| [34] |
|
| [35] |
|
| [36] |
|
| [37] |
|
| [38] |
|
| [39] |
|
| [40] |
|
| [41] |
|
| [42] |
|
| [43] |
|
| [44] |
|
| [45] |
|
| [46] |
|
| [47] |
|
| [48] |
|
| [49] |
|
| [50] |
|
| [51] |
|
| [52] |
|
| [53] |
|
| [54] |
|
| [55] |
|
| [56] |
|
| [57] |
|
/
| 〈 |
|
〉 |