Special Issue: Climate Change and Its Regional Response

Relationship of minimum winter temperature and temperature seasonality to the northern range limit and species richness of trees in North America

  • Hong QIAN , 1 ,
  • ZHANG Yangjian 2 ,
  • Robert E. RICKLEFS 3 ,
  • Xianli WANG 4, 5
Expand
  • 1. Research and Collections Center, Illinois State Museum, 1011 East Ash Street, Springfield, IL 62703, USA
  • 2. Key Laboratory of Ecosystem Network Observation and Modeling, Institute of Geographic Sciences and Natural Resources Research, CAS, Beijing 100101, China
  • 3. Department of Biology, University of Missouri-St. Louis, St. Louis, MO 63121, USA
  • 4. Northern Forestry Centre, Canadian Forest Service, Natural Resources Canada, 5320-122nd Street, Edmonton, AB T6H 3S5, Canada
  • 5. Department of Renewable Resources, University of Alberta, 751 General Service Building Edmonton, AB T6G 2H1, Canada

Received date: 2021-07-29

  Accepted date: 2021-11-18

  Online published: 2022-04-25

Supported by

National Key Research and Development Program(2019YFA0607302)

Abstract

Biologists have considered both winter coldness and temperature seasonality as major determinants of the northern limits of plants and animals in the Northern Hemisphere, which in turn drive the well-known latitudinal diversity gradient. However, few studies have tested which of the two climate variables is the primary determinant. In this study, we assess whether winter coldness or temperature seasonality is more strongly associated with the northern latitudinal limits of tree species and with tree species richness in North America. Tree species were recorded in each of 1198 quadrats of 110 km × 110 km in North America. We used correlation and regression analyses to assess the relationship of the latitude of the northern boundary of each species, and of species richness per quadrat, with winter coldness and temperature seasonality. Species richness was analyzed within 38 longitudinal, i.e., north-south, bands (each being >1100 km long and 110 km wide). The latitudes of the northern range limits of tree species were three times better correlated with minimum temperatures at those latitudes than with temperature seasonality. On average, minimum temperature and temperature seasonality together explained 81.5% of the variation in the northern range limits of the tree species examined, and minimum temperature uniquely explained six-fold (33.7% versus 5.8%) more of this variation than did temperature seasonality. Correlations of tree species richness with minimum temperatures were stronger than correlations with temperature seasonality for most of the longitudinal bands analyzed. Compared to temperature seasonality, winter coldness is more strongly associated with species distributions at high latitudes, and is likely a more important driver of the latitudinal diversity gradient.

Cite this article

Hong QIAN , ZHANG Yangjian , Robert E. RICKLEFS , Xianli WANG . Relationship of minimum winter temperature and temperature seasonality to the northern range limit and species richness of trees in North America[J]. Journal of Geographical Sciences, 2022 , 32(2) : 280 -290 . DOI: 10.1007/s11442-022-1947-z

1 Introduction

The latitudinal diversity gradient (i.e., the decrease of species richness with increasing latitude) is one of the most conspicuous and robust biogeographic patterns (Rosenzweig, 1995; Hillebrand, 2004). Previous studies have shown that the northern limits of species distributions in North America are associated with low temperature in winter (Huntley et al., 1989; Zanne et al., 2014; hereafter minimum winter temperature or minimum temperature), which is often measured as the average minimum temperature of the coldest month (e.g., Hawkins et al., 2014) or the average overall temperature of the coldest month (e.g., Chen et al., 2018; Wang et al., 2018; Chen and Su, 2020). These two measures of minimum temperature are often nearly perfectly correlated (e.g., r = 0.996 in data from WorldClim for North America, www.worldclim.org). Minimum temperature reflects winter coldness. Biologists broadly accept that the latitudinal diversity gradient originated, or became intensified, in response to global climate cooling during the Cenozoic, initiated in the Eocene (Latham and Ricklefs, 1993a; Ricklefs, 2004). Fossils reveal that most of the major clades of present-day organisms first appeared when Earth was dominated by tropical or subtropical environments from low to high latitudes (Behrensmeyer, 1992; Graham, 1999), for example during the Cretaceous and the early Tertiary (Graham, 1999). Tertiary global climate cooling caused temperatures to decrease more at higher latitudes, strengthening latitudinal temperature gradients from the Eocene toward the present (Zhang et al., 2019). As a result, clades of warm- adapted plants at higher latitudes either shifted their distributions to lower latitudes, evolved tolerance of colder temperatures, or became extinct (Qian et al., 2019). Because ecological traits tend to be phylogenetically conserved (Latham and Ricklefs, 1993b; Wiens and Donoghue, 2004; Donoghue, 2008), few members of tropical clades have crossed major ecophysiological boundaries, particularly toward colder and drier environments (Ricklefs, 2006). Most tropical clades never entered extratropical regions because they lacked adaptations to survive temperatures below freezing (Ricklefs and Schluter, 1993; Futuyma, 1998). Accordingly, the northern range limits of most species in the Northern Hemisphere are thought to be determined by tolerance of winter coldness (i.e., cold tolerance hypothesis) (Farrell et al., 1992; Ricklefs and Schluter, 1993; Körner, 2021).
Global climate cooling during the Cenozoic created strong gradients not only in temperature across latitudes (e.g., decrease in mean annual temperature and minimum temperature with latitude) but also in temperature seasonality (i.e., intra-annual temperature variation) across latitudes (Latham and Ricklefs, 1993a; Archibald et al., 2010). Because Earth was dominated by tropical or subtropical climates during the Cretaceous and the early Tertiary (Behrensmeyer, 1992; Graham, 1999), temperature seasonality was low, even at high latitudes (Archibald et al., 2010). During subsequent global climate cooling, greater decrease in temperature, particularly winter temperature, at higher latitudes strengthened the latitudinal gradient of temperature seasonality from the Eocene toward the present.
The increased seasonal difference in temperature at higher latitudes presumably favored species that could tolerate greater intra-annual temperature variation. Thus, to persist at high latitudes, plants must tolerate not only low temperature in winter but also great variation in temperature between summer and winter (Stevens, 1989). Because many ancestral clades evolved under tropical climates with no or little seasonal variation, and traits that confer cold tolerance are often slow to evolve (Latham and Ricklefs, 1993a; Wiens and Donoghue, 2004; Zanne et al., 2014), relatively few clades can tolerate extreme temperature seasonality. Because higher latitudes experience greater temperature seasonality than the tropics, the latitudinal diversity gradient might be driven more by the latitudinal gradient of temperature seasonality than by that of minimum temperature. Accordingly, temperature seasonality at the northern limit of the latitudinal range of a species in the Northern Hemisphere would be expected to be more consistent than minimum temperature (i.e., the temperature seasonality tolerance hypothesis or, more generally, the climate variability hypothesis) (Stevens, 1989). Indeed, some authors (e.g., Wiens et al., 2006) have argued that temperature seasonality, rather than winter coldness, constrains the expansion of species ranges at higher latitudes.
These two hypotheses (i.e., tolerance of climate coldness versus tolerance of temperature seasonality) are not mutually exclusive, but they do invoke different mechanisms. If cold tolerance constrained plant dispersal from low to high latitudes after the Last Glacial Maximum, dispersal to higher latitudes would require tolerance of a certain degree of low temperature, but not necessarily a wide range of temperature variation. In contrast, if temperature seasonality were constraining, dispersal of a plant species to higher latitudes would require its tolerance not only of lower temperature, but also of a greater range of temperature variation (temperature seasonality) (Stevens, 1989). Determining which of these two hypotheses has played a greater role in setting northern limits to the latitudinal ranges of species in the Northern Hemisphere could shed light on limits to poleward dispersal of species, hence mechanisms that generate the latitudinal diversity gradient. However, few studies have examined which of the two climate variables (minimum temperature versus temperature seasonality) is more strongly associated with the northern limits of species in the Northern Hemisphere, or the southern limits of species in the Southern Hemisphere.
Here, we take the advantage of the broad latitudinal range within North America, and the availability of a comprehensive database for the tree flora of North America, to assess whether minimum temperature (specifically, mean temperature of the coldest month), or temperature seasonality, is more strongly associated with the northern limits of the latitudinal ranges of tree species and tree species richness in North America. The tree flora of North America suits this analysis for at least two reasons. First, North America has a wide longitudinal span encompassing relatively low (ca. 30°N) to high (>80°N) latitudes, transected by similar north-south oriented physiographic features (e.g., the Appalachian Mountains in the east and the American Cordillera, i.e., the Rocky Mountains, in the west). The north-south orientation of physiographic features would have facilitated species dispersal during glacial-interglacial cycles (Delcourt and Delcourt, 1993), which, in turn, would have brought the distributional ranges of species close to equilibrium with climate conditions. Second, trees have year-round above ground presence and thus are affected by air temperature more strongly than are shrubs and herbs. In particular, the buds and cambium of trees are more directly exposed to low temperature in winter in the Northern Hemisphere, compared to shrubs and herbs, which may be protected by tree canopies or snow layers.

2 Materials and methods

We used the Lambert Azimuthal Equal Area projection to divide North America north of Mexico (hereafter North America) into equal area quadrats of 12,100 km2 (110 km × 110 km, or approximately equivalent to a 1º × 1º latitude-longitude square near the equator). We determined the presence or absence of each tree species in each quadrat by superimposing range maps on the grid system, and then generated species lists for each quadrat, as in previous studies (e.g., Qian et al., 2013). Maps of tree species distributions in North America were published in “Atlas of United States Trees” (Little, 1971-1978), which were available at a USGS website (https://www.sciencebase.gov/catalog/item/4fc518d1e4b00e9c12d8c362). We excluded quadrats that are not completely terrestrial, i.e., that include large areas of lake or ocean surface. A total of 1198 quadrats were included in this study; these were located in 50 north-south bands, each of which is one quadrat wide (Figure 1). Although these bands are not strictly longitudinal bands, as longitude within each band changes as one goes north, we use the term to facilitate discussion. A total of 527 tree species, which are 84% of all native tree species in North America north of Mexico (based on the botanical nomenclature of World Flora Online; www.worldfloraonline.org), were distributed in the quadrats. We determined the number of tree species in each quadrat. For each of the longitudinal bands in which a given species was distributed, we additionally determined which quadrat represented the northern range limit of the species within the longitudinal band.
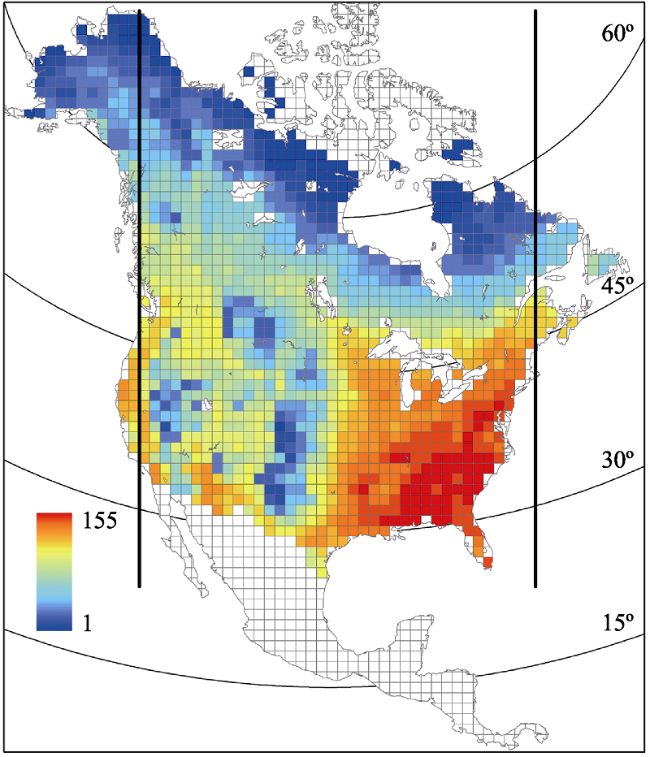
Figure 1 Geographic variation in tree species richness in North America north of Mexico. Each quadrat is 110 km by 110 km. Species richness in quadrats with land area less than 75% of a full quadrat is not shown. The 38 longitudinal bands between the two thick vertical lines were used in data analysis in this study.
Minimum temperature and temperature seasonality in each quadrat were documented. Minimum temperature was the mean temperature of the coldest month, and temperature seasonality was the standard deviation of monthly mean temperature, which is nearly perfectly correlated with temperature annual range in North America (r = 0.996; based on climate data with www.worldclim.org). Temperature data were obtained from Climatic Research Unit (CRU, http://www.cru.uea.ac.uk/data), which were based on climate data for the period of 1961-1990 (New et al., 1999); these data are strongly correlated with temperature data from other climate data sources (e.g., r = 0.998 for mean annual temperature between CRU and WorldClim (www.worldclim.org/) for North America). We used the average value of either climatic variable for each quadrat of 110 km × 110 km based on climatic data at the 30-minute resolution.
For each species, we conducted two analyses to determine the relative importance of minimum temperature compared to temperature seasonality in determining the northernmost range of the tree species. First, we compared the correlation between the latitude at the center of the quadrat at the northern range limit of the species and minimum temperature with the correlation between the latitude at the center of the quadrat at the northern range limit of the species and temperature seasonality, considering the climate variable with the stronger correlation being the stronger determinant of the northern range limit of the species. Second, we regressed the latitude of the northern range limit of the species simultaneously on minimum temperature and temperature seasonality, and compared absolute values of the standardized partial regression coefficients, considering that a larger absolute value would indicate a stronger effect. We also used a variance partitioning approach (Legendre and Legendre, 2012) to assess four components of variance in latitude of the northern range limit: (1) variance uniquely explained by minimum temperature, (2) variance explained jointly by minimum temperature and temperature seasonality, (3) variance uniquely explained by temperature seasonality; and (4) variance explained by neither minimum temperature nor temperature seasonality. In these analyses, we excluded species that were distributed in fewer than ten longitudinal bands to avoid spurious effects of small sample size. Accordingly, 291 species were included in the two analyses. The length of the boundary at the northern edge of a species range in this sample varies from 1100 km to 5500 km.
For each longitudinal band, we conducted two additional analyses. First, we correlated the northern range limits (latitudes) of species within the longitudinal band with minimum temperature and temperature seasonality at the range limit. Second, we correlated tree species richness in the quadrats of the longitudinal band with minimum temperature and temperature seasonality in the quadrats. In both analyses, we considered a climate variable with a stronger correlation to be a stronger determinant of northern range limit of species richness. We excluded those longitudinal bands that are fewer than ten quadrats in length (i.e., <1100 km) to avoid potentially spurious effects of small sample size. Altogether, we assembled 38 longitudinal bands (Figure 1); 518 tree species are distributed in the 1108 quadrats located in the 38 longitudinal bands. The average length of the longitudinal bands is 3207 km.
We used SYSTAT version 7 (Wilkinson et al., 1992) for correlation and regression analyses. We used Pearson correlation coefficients to assess the strengths of correlations among variables. Because spatial autocorrelation commonly occurs in broad-scale ecological data, which may inflate tests of statistical significance, we followed previous authors (e.g., Fritz and Rahbek, 2012; Hawkins et al., 2011) in avoiding reporting P-values for correlation coefficients. Instead, we considered the strength of each correlation. Specifically, we considered correlations to be strong for |r| > 0.66, moderate for 0.66 ≥ |r| > 0.33, and weak for |r| ≤ 0.33 (Qian et al., 2019). Several studies (e.g., Morales-Castilla et al., 2012) have concluded that spatial autocorrelation is not an issue for statistical analysis unless inferential statistics (i.e., P values) are presented. To determine whether spatial autocorrelation indeed does not affect conclusions drawn from our statistical analyses, in addition to using the ordinary least squares (OLS) model for regressions, we used simultaneous autoregression (SAR) models, which account for spatial autocorrelation, to conduct a second set of regressions. We then compared the relative importance of the standardized regression coefficients of the two climate variables derived from OLS models and from SAR models fitted using spdep (Bivand et al., 2013; Bivand and Piras, 2015).

3 Results

Across North America, minimum temperature was strongly and negatively correlated with temperature seasonality (r = -0.929, n = 1198 quadrats). Among quadrats of 12,100 km2 within each of the 38 longitudinal bands, minimum temperature was strongly and negatively correlated with latitude (mean ± SD: r = -0.987 ± 0.013, averaged across the 38 longitudinal bands, as shown in Figure 1) and temperature seasonality was strongly and positively correlated with latitude (r = 0.934 ± 0.085).
Tree species richness varied greatly among the quadrats across North America (Figure 1), ranging from 1 to 147 species. Tree species richness was generally strongly negatively correlated with latitude within longitudinal bands (r = -0.805 ± 0.224, averaged across the 38 longitudinal bands).
The relationship between latitude and minimum temperature at the northern range limits of the species was negative while the relationship between latitude and temperature seasonality at the northern range limits of the species was positive. When averaged across the 291 species, the correlation between latitude and minimum temperature at the northern range limits of the species was stronger than that between latitude and temperature seasonality at the northern range limits of the species (Figure 2a), and the absolute value of the standardized regression coefficient for minimum temperature was larger than that for temperature seasonality by a factor of approximately three, regardless of whether an OLS model or a SAR model was used (compare Figpure 2b with c). On average, minimum temperature alone explained 76% of the variation of the northern range limits of the 291 tree species that were distributed in ten or more longitudinal bands, and minimum temperature and temperature seasonality together explained 82% of the variation of the northern range limits of these 291 tree species (Figure 3). Minimum temperature uniquely explained more of the variation of the northern range limits than did temperature seasonality, by a factor of ~6 (34% versus 6%) (Figure 3).
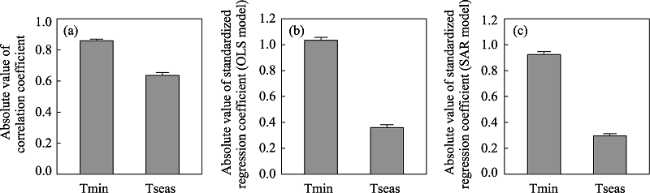
Figure 2 The means (± se) of (a) the absolute value of the correlation coefficient between northern latitude limit and either minimum temperature (Tmin) or temperature seasonality (Tseas), and absolute value of standardized partial regression coefficient of northern latitude limit against minimum temperature (Tmin) or temperature seasonality based on (b) ordinary least squares (OLS) and (c) simultaneous autoregression (SAR) models for 291 tree species in North America
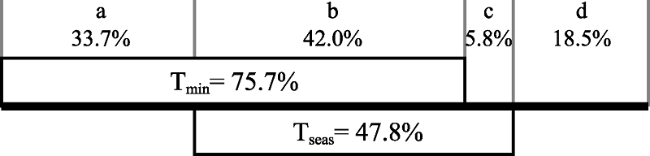
Figure 3 Results of a partial regression analysis (partitioning the variance). The variance in the response variable is partitioned into four portions: (a) uniquely accounted for by minimum temperature (Tmin), (b) accounted for jointly by minimum temperature and temperature seasonality (Tseas), (c) uniquely accounted for by temperature seasonality, and (d) unexplained variance.
When data were analyzed separately for each of the 38 longitudinal bands, the correlation between the northern range limit of tree species and minimum temperature was stronger than that between the northern range limit and temperature seasonality in 37 of these bands (Figure 4). When tree species richness was related to minimum temperature and temperature seasonality separately, the correlation of tree species richness with minimum temperature was stronger than that with temperature seasonality in 26 (68.4%) of the 38 longitudinal bands. On average, both the northern range limit and the number of tree species were correlated with minimum temperature more strongly than with temperature seasonality, although the average of correlations between minimum temperature and species richness did not differ statistically from that between temperature seasonality and species richness (r = -0.987 ± 0.013 SD versus 0.934 ± 0.085 for the northern range limit, paired t-test for absolute r values, P < 0.001; r = 0.816 ± 0.216 versus -0.807 ± 0.203 for species richness, paired t-test for absolute r values, P = 0.30). The results of these analyses for longitudinal bands are consistent with those for the northern range limits of the 291 species, i.e., minimum temperature is more strongly associated with the northern range limits of tree species, compared to temperature seasonality, in North America.
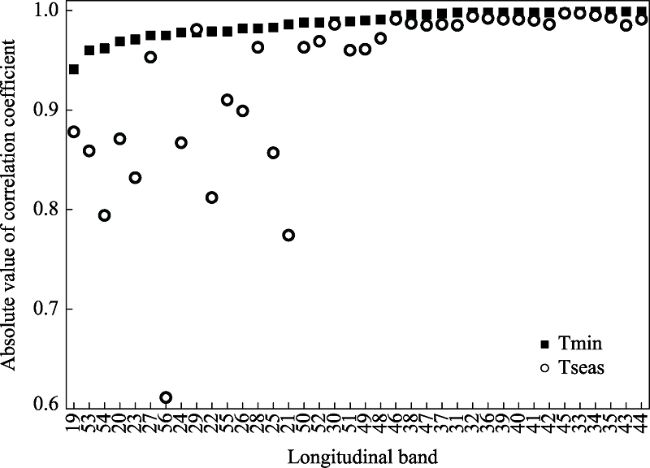
Figure 4 Comparison between the correlation between tree northern range limit and minimum temperature (Tmin) and between tree northern range limit and temperature seasonality (Tseas) for 38 longitudinal bands in North America (see Figure 1). Longitudinal bands were sorted according to absolute values of minimum temperature increasing from left to right.

4 Discussion

Several authors (e.g., Farrell et al., 1992; Ricklefs and Schluter, 1993; Brown and Lomolino, 1998; Futuyma, 1998; Larcher, 2003) have suggested that cold tolerance is a primary constraint on species dispersal from tropical to temperate regions, which has contributed to the latitudinal diversity gradient. However, some authors (e.g., Wiens et al., 2006) cited temperature seasonality, rather than winter coldness, as the primary constraint to the northern range limits of species in North America. In the present study, we analyzed a comprehensive dataset for tree species to determine whether the northern range limits and richness of tree species are more strongly associated with winter coldness or with temperature seasonality.
Wiens et al. (2006) analyzed the relative importance of minimum temperature and temperature seasonality in determining the northern range limits of hylid frog (amphibian) species in the New World, and suggested that temperature seasonality, rather than winter coldness, limits extension of species ranges into colder regions. However, their analysis included only a small number of species (n = 12; six species restricted to Mexico in a primary analysis and another six species in a secondary analysis). Each of these species is confined to a small region and has a relatively short northern range boundary. In addition, the dataset analyzed by Wiens et al. included a short latitudinal gradient restricted to tropical latitudes (as shown in their Figure 4). Because both the cold tolerance hypothesis and the temperature seasonality tolerance hypothesis invoke dispersal of species to cold climates, focusing on a small sample of species and a short tropical latitudinal gradient might have prevented a robust conclusion concerning the relative importance of winter coldness and temperature seasonality on the northern range limits of species. Previous studies (e.g., Qian et al., 2007) showed that species richness of amphibians is associated with winter coldness more strongly than with temperature seasonality, consistent with the finding of the present study for North American tree species.
As noted above, few previous studies have examined whether the northern range limits of species are more strongly associated with winter coldness than with temperature seasonality in the Northern Hemisphere (or with the southern range limits of species in the Southern Hemisphere). Among these studies, several have shown that the northern range limits of species in the Northern Hemisphere are generally consistent with minimum temperature. For example, among plants, the northern limit of the herbaceous wild madder, Rubia peregrine, in northern Europe sits on the 4.4°C mean January isotherm (Salisbury, 1926; Huggett, 2004), and the common holly Ilex aquifolium is confined to areas where the mean temperature of the coldest months exceeds -0.5°C (Iversen, 1944; Huggett, 2004). There are many similar cases for animals. For example, physiological studies have shown that the northern range limits of North American songbirds might generally be constrained by winter nighttime temperatures (Root, 1988; Burger, 1998); Root (1988) showed that the northern boundary of Sayornis phoebe follows the -4°C average minimum January isotherm in North America; Williamson (1975) found that the northern limits of a few well-documented bird species in U.K. have tracked winter temperatures for over 130 years; and Battisti et al. (2005) showed that expansion of geographical range in the pine processionary moth (Thaumetopoea pityocampa) has followed increasing winter temperatures. Many studies, including those cited above, indicate that the northern range edges of many plant and animal species in the Northern Hemisphere are limited by minimum temperature. In contrast, to our knowledge, none have demonstrated congruence between range limits of species and temperature seasonality isoclines.
Because both cold tolerance and temperature seasonality tolerance are derived ecological traits that enable plants to withstand stressful climate conditions, and because fewer lineages presumably could evolve tolerance of increasingly more stressful climate conditions, as predicted by the tropical niche conservatism hypothesis (Wiens and Donoghue, 2004), colder, more seasonal climates should support fewer species (Hawkins et al., 2014). Thus, assessing the relative strength of the relationships of species richness to minimum temperature versus temperature seasonality is an alternative approach to assessing which of the two climate variables plays a greater role in determining the northern range limits of species in the Northern Hemisphere. We found that tree species richness in North America was more strongly associated with winter coldness than with temperature seasonality, which is consistent not only with our analysis based on the northern range limits of tree species in North America but also with other species-richness-based analyses reported by previous authors. For example, species richness in China has been found to be associated with winter coldness more strongly than with temperature seasonality for trees (Wang et al., 2011), gymnosperms (Qian et al., 2019), angiosperms (Qian et al., 2019), and amphibians (Qian et al., 2007). When metrics measuring phylogenetic structure of tree assemblages are related to the two climate variables, winter coldness has been frequently found to be the stronger driver of phylogenetic structure than temperature seasonality. For example, Qian et al. (2018, 2020) demonstrated that mean family age, net relatedness index, and nearest taxon index of local tree communities are all more strongly correlated with winter coldness than with temperature seasonality across latitudinal gradients in eastern North America.
Our study has confirmed that winter coldness is more strongly associated with the northern range limits of tree species across latitudinal gradients, compared with temperature seasonality, even though the two climate variables are strongly correlated across North America (r = -0.929 for the quadrats used in this study). Previous studies (Qian et al., 2018, 2020) have shown that the effects of winter coldness on phylogenetic structure of tree assemblages are greater than those of temperature seasonality by a factor of ~3, on average, for elevational gradients in eastern USA. Accordingly, we predicted that winter coldness would be a stronger correlate of range limits of species towards high elevation along elevational gradients, compared with temperature seasonality.
In conclusion, we analyzed a comprehensive dataset for the tree flora of North America to assess the relative strength of the association of winter coldness and temperature seasonality with the northern range limits of tree species, which drives the well-known latitudinal diversity gradient. Our analyses show that the northern range limits of tree species are more strongly associated with minimum winter temperature than with temperature seasonality. This finding is consistent with those of previous studies that have addressed the simultaneous relationship of species richness to winter coldness and temperature seasonality.

Acknowledgements

We are grateful to reviewers for their constructive comments. This study was partially supported by a grant from the National Key Research and Development Program (2019YFA 0607302) to Yangjian Zhang.
[1]
Archibald S B, Bossert W H, Greenwood D R et al., 2010. Seasonality, the latitudinal gradient of diversity, and Eocene insects. Paleobiology, 36: 374-398.

DOI

[2]
Battisti A, Stastny M, Netherer S et al., 2005. Expansion of geographic range in the pine processionary moth caused by increased winter temperatures. Ecological Applications, 15: 2084-2096.

DOI

[3]
Behrensmeyer, A K, Damuth J D, DiMichele W A et al., 1992. Terrestrial Ecosystems Through Time:Evolutionary Paleoecology of Terrestrial Plants and Animals. Chicago: University of Chicago Press.

[4]
Bivand R, Piras G, 2015. Comparing implementations of estimation methods for spatial econometrics. Journal of Statistical Software, 63: 1-36.

[5]
Bivand R S, Hauke J, Kossowski T, 2013. Computing the Jacobian in Gaussian spatial autoregressive models: An illustrated comparison of available methods. Geographical Analysis, 45: 150-179.

DOI

[6]
Brown J H, Lomolino M V, 1998. Biogeography. 2nd ed. Sunderland:Sinauer Associates, Inc.

[7]
Burger M, 1998. Physiological mechanisms limiting the northern boundary of the winter range of the northern cardinal (Cardinalis cardinalis)[D]. Ann Arbor: University of Michigan.

[8]
Chen W, Chen S, Shen M et al., 2018. Minimum temperature and precipitation determine fish richness pattern in China's nature reserves. Biogeosciences Discussions, doi.10.5194/bg-2017-389.

[9]
Chen W-Y, Su T, 2020. Asian monsoon shaped the pattern of woody dicotyledon richness in humid regions of China. Plant Diversity, 42: 148-154.

DOI

[10]
Delcourt P A, Delcourt H R, 1993. Paleoclimates, paleovegetation, and paleoflora during the Late Quaternary. In: Flora of North America Editorial Committee ed. Flora of North America North of Mexico, Vol. 1. New York: Oxford University Press, 71-94.

[11]
Donoghue M J, 2008. A phylogenetic perspective on the distribution of plant diversity. Proceedings of the National Academy of Sciences of the United States of America 105(Suppl 1): 11549-11555.

[12]
Farrell B, Mitter C, Futuyma D J, 1992. Diversification at the insect-plant interface. BioScience, 42: 34-42.

DOI

[13]
Fraser R H, Currie D J, 1996. The species richness-energy hypothesis in a system where historical factors are thought to prevail: Coral reefs. The American Naturalist, 148: 138-159.

DOI

[14]
Fritz S A, Rahbek C, 2012. Global patterns of amphibian phylogenetic diversity. Journal of Biogeography, 39: 1373-1382.

DOI

[15]
Futuyma D J, 1998. Evolutionary Biology. 3rd edn. Sunderland: Sinauer.

[16]
Graham A, 1999. Late Cretaceous and Cenozoic History of North American Vegetation. New York: Oxford University Press.

[17]
Hawkins B A, Rodríguez M Á, Weller S G, 2011. Global angiosperm family richness revisited: Linking ecology and evolution to climate. Journal of Biogeography, 38: 1253-1266.

DOI

[18]
Hawkins B A, Rueda M, Rangel T F et al., 2014. Community phylogenetics at the biogeographical scale: Cold tolerance, niche conservatism and the structure of North American forests. Journal of Biogeography, 41, 23-38.

DOI

[19]
Hillebrand H, 2004. On the generality of the latitudinal gradient. The American Naturalist, 163: 192-211.

DOI

[20]
Huggett R J, 2004. Fundamentals of Biogeography. London: Routledge.

[21]
Huntley B, Bartlein P J, Prentice I C, 1989. Climatic control of the distribution and abundance of beech (Fagus L.) in Europe and North America. Journal of Biogeography, 16: 551-560.

DOI

[22]
Iversen J, 1944. Viscum, Hedera and Ilex as climatic indicators. Geologiska Föreningens Stockholm Förhandlingar, 66: 463-483.

[23]
Körner C, 2021. The cold range limit of trees. Trends in Ecology & Evolution, 36: 979-989.

DOI

[24]
Larcher W, 2003. Physiological Plant Ecology: Ecophysiology and Stress Physiology of Functional Groups. Berlin: Springer-Verlag.

[25]
Latham R E, Ricklefs R E, 1993a. Continental comparisons of temperate-zone tree species diversity. In: Ricklefs R E, Schluter D eds. Species Diversity in Ecological CommunitiesChicago: University of Chicago Press, 294-314.

[26]
Latham R E, Ricklefs R E, 1993b. Global patterns of tree species richness in moist forests: Energy-diversity theory does not account for variation in species richness. Oikos 67: 325-333.

DOI

[27]
Legendre P, Legendre L, 2012. Numerical Ecology. 3rd ed. Amsterdam: Elsevier.

[28]
Little E L, 1971-78. Atlas of United States Trees. Vols. 1, 3, 4, and 5. U.S. Department of Agriculture Miscellaneous Publication, Washington, DC.

[29]
New M, Hulme M, Jones P, 1999. Representing twentieth-century space-time climate variability. Part I: Development of a 1961-90 mean monthly terrestrial climatology. Journal of Climate, 12: 829-856.

DOI

[30]
Qian H, Deng T, Jin Y et al., 2019. Phylogenetic dispersion and diversity in regional assemblages of seed plants in China. Proceedings of the National Academy of Sciences of the United States of America, 116: 23192-23201.

[31]
Qian H, Wang X, Wang S et al., 2007. Environmental determinants of amphibian and reptile species richness in China. Ecography, 30: 471-482.

DOI

[32]
Qian H, Zhang J, Hawkins B A, 2018. Mean family age of angiosperm tree communities and its climatic correlates along elevational and latitudinal gradients in eastern North America. Journal of Biogeography, 45: 259-268.

DOI

[33]
Qian H, Zhang J, Sandel B et al., 2020. Phylogenetic structure of angiosperm trees in local forest communities along latitudinal and elevational gradients in eastern North America. Ecography, 43: 419-430.

DOI

[34]
Qian H, Zhang Y, Zhang J et al., 2013. Latitudinal gradients in phylogenetic relatedness of angiosperm trees in North America. Global Ecology and Biogeography, 22: 1183-1191.

DOI

[35]
Ricklefs R E, 2004. A comprehensive framework for global patterns in biodiversity. Ecology Letters, 7: 1-15.

DOI

[36]
Ricklefs R E, 2006. Evolutionary diversification and the origin of the diversity/environment relationship. Ecology, 87: S3-S13.

[37]
Ricklefs R E, Schluter D, 1993. Species diversity: Regional and historical influences. In: Ricklefs R E, Schluter D eds. Species Diversity in Ecological CommunitiesChicago: University of Chicago Press, 350-363.

[38]
Root T L, 1988. Energy constraints on avian distributions and abundances. Ecology, 69: 330-339

DOI

[39]
Rosenzweig M L, 1995. Species Diversity in Space and Time. Cambridge: Cambridge University Press.

[40]
Salisbury E J, 1926. The geographical distribution of plants in relation to climatic factors. Geographical Journal, 57: 312-335.

[41]
Stevens G C, 1989. The latitudinal gradient in geographical range: How so many species coexist in the tropics. The American Naturalist, 133: 240-256.

DOI

[42]
Wang J-H, Cai Y-F, Zhang L et al., 2018. Species richness of the family Ericaceae along an elevational gradient in Yunnan, China. Forests, 9: 511.

DOI

[43]
Wang Z, Fang J, Tang Z et al., 2011. Patterns, determinants and models of woody plant diversity in China. Proceedings of the Royal Society B: Biological Sciences, 278: 2122-2132.

[44]
Wiens J J, Donoghue M J, 2004. Historical biogeography, ecology and species richness. Trends in Ecology & Evolution, 19: 639-644.

DOI

[45]
Wiens J J, Graham C H, Moen D S et al., 2006. Evolutionary and ecological causes of the latitudinal diversity gradient in hylid frogs: Treefrog trees unearth the roots of high tropical diversity. The American Naturalist, 168: 579-596.

PMID

[46]
Wilkinson L, Hill M, Welna J P et al., 1992. SYSTAT for Windows:Statistics. Evanston: SYSTAT Inc.

[47]
Williamson K, 1975. Birds and climatic change. Bird Study, 22: 143-164.

DOI

[48]
Zanne A E, Tank D C, Cornwell W K et al., 2014. Three keys to the radiation of angiosperms into freezing environments. Nature, 506: 89-92.

DOI

[49]
Zhang L, Hay W W, Wang C et al., 2019. The evolution of latitudinal temperature gradients from the latest Cretaceous through the present. Earth-Science Reviews, 189: 147-158.

DOI

Outlines

/