Special Issue: Climate Change and Its Regional Response

Glacier changes in the Sanjiangyuan Nature Reserve of China during 2000-2018

  • ZHANG Yuan , 1 ,
  • YAO Xiaojun , 1, * ,
  • ZHOU Sugang 1 ,
  • ZHANG Dahong 1, 2
Expand
  • 1. College of Geography and Environment Sciences, Northwest Normal University, Lanzhou 730070, China
  • 2. College of Urban and Environmental Sciences, Northwest University, Xi'an 710027, China
*Yao Xiaojun (1980-), specialized in geographic information technology and cryospheric change. E-mail:

Zhang Yuan (1997-), specialized in GIS design and development. E-mail:

Received date: 2021-04-02

  Accepted date: 2021-11-16

  Online published: 2022-04-25

Supported by

National Natural Science Foundation of China(41861013)

National Natural Science Foundation of China(42071089)

National Natural Science Foundation of China(42161027)

National Key Research Program of China(2019YFE0127700)

Open Research Foundation of National Cryosphere Desert Data Center(20D02)

The Northwest Normal University Graduate Research Grant Program(2019KYZZ012054)

Abstract

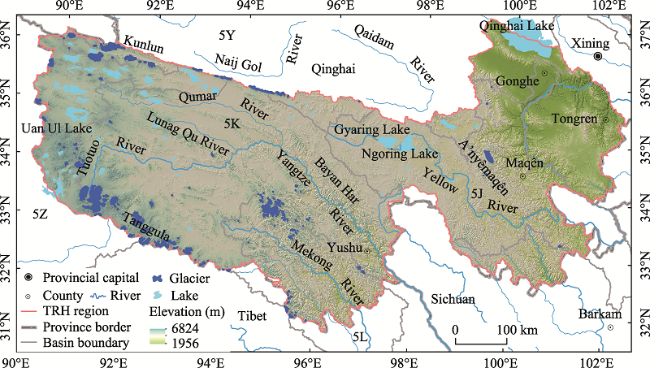
The glaciers in the Sanjiangyuan Nature Reserve of China (SNRC) are a significant water resource for the Yangtze, Yellow, and Mekong rivers. Based on Landsat Thematic Mapper (TM)/ Operational Land Imager (OLI) images acquired in 2000, 2010, and 2018, the outlines of glaciers in the SNRC were obtained by combining band ratio method with manual interpretation. There were 1714 glaciers in the SNRC in 2018, with an area of 2331.15±54.84 km2, an ice volume of 188.90±6.41 km3, and an average length of 1475.4±15 m. During 2000-2018, the corresponding values of glaciers decreased by 69, 271.95±132.06 km2, 18.59±8.83 km3, and 84.75±34 m, respectively. Glaciers in the Yangtze River source area witnessed the largest area loss (-154.45 km2), whereas glaciers in the Mekong River source area experienced the fastest area loss (-2.02%·a-1) and the maximum reduction of the average length (-125.82 m). Overall, the retreat of glaciers in the SNRC exhibited an accelerating trend. Especially, the loss rate of glacier area in the Yellow River source area in 2010-2018 was more than twice that in 2000-2010. The glacier change is primarily attributed to the significant rise in temperature during the ablation period. Some other factors including the size, orientation and terminus elevation of glaciers also contributed to the heterogeneity of glacier change.

Cite this article

ZHANG Yuan , YAO Xiaojun , ZHOU Sugang , ZHANG Dahong . Glacier changes in the Sanjiangyuan Nature Reserve of China during 2000-2018[J]. Journal of Geographical Sciences, 2022 , 32(2) : 259 -279 . DOI: 10.1007/s11442-022-1946-0

1 Introduction

The cryosphere refers to the negative temperature sphere that is distributed continuously on the Earth's surface with a certain thickness (Qin et al., 2017), and it is one of the five spheres of the Earth's climate system (Xie and Liu, 2010). Glaciers known as solid reservoirs in the high elevation regions are the main component of the cryosphere, and have an important impact on the regional ecosystem and environment (Shi, 2001; Zhang et al., 2012). Glaciers are also regarded as natural recorders and sensitive indicators of climate change, since they expand, shrink, and even disappear under climate change (Oerlemans, 1994; Xie et al., 2005; Liu et al., 2015). Global warming has become obvious since the 1980s. The Tibetan Plateau called as the third pole has the largest distribution area of modern glaciers in the middle and low latitudes of the Earth (Li et al., 2008; Qiu, 2008; Chen et al., 2015), and has been experiencing an enhanced ablation in recent years due to the strongest ongoing warming (Pu et al., 2004; Wang et al., 2015; Duan et al., 2019; Liu et al., 2019; Yao et al., 2019; Liu et al., 2020; Zhou et al., 2020).
The Sanjiangyuan Nature Reserve of China (SNRC) in the hinterland of the Tibetan Plateau was approved in 2003 (Jiang and Wang, 2004). Its name comes from three rivers including the Yangtze River, Yellow River and Mekong River. The SNRC is an important water conservation area and the key area for eco-environmental protection in China. Health of the SNRC directly affects the eco-environmental security and social and economic development in the middle and lower reaches of the Yellow and Yangtze rivers. “The Yangtze and Yellow river basins are important ecological barriers in China and their eco-environment still needs to be carefully protected” was emphasized at a symposium on ecological protection and high-quality development of the Yellow River basin and the construction of the Yangtze River Economic Belt. The National Development and Reform Commission released “The Sanjiangyuan National Park General Plan” in 2018, which clearly declared that the Sanjiangyuan National Park would be officially set up by 2020 to reinforce the protection of the eco-environment in the SNRC. The glaciers in the SNRC supplies fresh water to the Yangtze, Yellow, and Mekong rivers, and their meltwater also serves to regulate the variation of runoff. River runoff in the Yangtze River source area has decreased by 14% in the last 40 years, while glacial meltwater has increased by 15.2% (Ding et al., 2020). Without the recharge of glacial meltwater, the decrease in river runoff would be more significant. Xie et al. (2006) documented the relationship between glacial meltwater and river runoff in the headwaters of the three rivers. They found that the glacial meltwater in the source area of the Yangtze River was 15.52×10⁸ m3 accounting for 8.8% of the total river runoff, and the glacial meltwater in the source area of the Yellow River and the Mekong River were 1.74×10⁸ m3 (0.8%) and 4.43×10⁸ m3 (4.0%), respectively. The study of glacier changes is an important part of researches on eco-environment in the headwaters of rivers. Thus, examining the glacier changes in the SNRC is conducive to correctly carrying out regional eco-environmental protection and rational utilization of water resources.
Several studies of glacier changes in the SNRC have been performed since the 21st century, which focused on a few partial areas of the SNRC. For example, Liu et al. (2002) examined the glacier changes in the A'nyêmaqên Mountains, which are located in the headwater region of the Yellow River, and they reported that the glaciers began to retreat after the Little Ice Age, and the glacial retreat accelerated between 1966 and 2000. Xu et al. (2013) quantified the glacier changes during 1969-2002 in the headwater region of the Yangtze River and demonstrated that the glacier retreated by an average of 108.3 m, and the area decreased by 5.3% during the study period. Other studies have further documented glacier changes in partial area of the SNRC (Lu et al., 2002; Yang et al., 2003; Jin et al., 2013; Wu et al., 2013; Hu et al., 2017). However, a comprehensive examination of the glacier changes across the entire SNRC has not yet been conducted. The above studies only adopted the area, number and ice volume of the glaciers as metrics for examining the glacier changes, and the latest observation information of glaciers in this area was missing. In this study, Landsat images in three periods (2000, 2010 and 2018) were adopted to delineate the glaciers in the SNRC by combining band ratio with manual revision. From different aspects including the number, area, average length and volume of glaciers, the glacier changes in the SNRC were quantified. Then the linkages among glacier change, climate change and topographic factors were explored, which will improve our understanding on response of glaciers to climate change and can provide scientific basis for water resources assessment and eco-environmental protection in the SNRC.

2 Study area

The SNRC (89°45°-102°23°E, 31°39°-36°12°N) is located in the southern part of Qinghai Province in China and on the central-eastern part of the Tibetan Plateau (Figure 1). Except for the headwater regions of the Yangtze River (5K), Yellow River (5J), and Mekong River (5L), the SNRC includes a small portion of the East Asia endorheic region (5Y) and the Tibetan Plateau endorheic region (5Z) due to the administrative need (Liu et al., 2015). As an essential ecological barrier of the Tibetan Plateau, it is in the middle of the troposphere of the Asian continent, greatly influencing the formation of atmospheric circulation in the Northern Hemisphere and playing an important role in counteracting global warming. The terrain is dominated by plateaus and mountains. The principal mountain ranges include the Tanggula Mountains, the Bayan Har Mountains, the Kunlun Mountains, and the A'nyêmaqên Mountains (Wei et al., 2020). The elevation is between 1956 and 6824 m, rising gradually from east to west, with an average elevation of 4500 m. This area has a typical plateau continental climate, i.e., it is divided into cold season and warm season. The cold season is controlled by the Tibetan Plateau High Pressure and lasts from October to April, featuring low temperature and little precipitation. The warm season is influenced by the Indian Ocean monsoon, with abundant water vapor and precipitation (Jin et al., 2020). The average warming rate in this region has been 0.37°C/10a over the past 60 years, which is more than twice the global rate (0.16°C/10a) and is higher than that in China (0.28°C/10a) (Jin et al., 2020). The rate of precipitation variation from 1960 to 2015 was 6.653 mm/10a (Meng et al., 2020). Glaciers are widespread in this area and their meltwater supplies many rivers and lakes, such as the Tuotuo River, Ngoring Lake, and Gyaring Lake. This makes the SNRC being a significant water-producing area for China and Southeast Asia, with an average annual outflow of 60×108 m3. Meanwhile, it is home to the highest and largest ecosystem of alpine wetland in the world.
Figure 1 The Sanjiangyuan Nature Reserve of China (SNRC)

3 Data and methods

3.1 Data source

Most glaciers on remote regions cannot be easily accessed, so remote sensing technology is widely adopted in glacier monitoring (Kääb, 2002). To delineate the glaciers in the SNRC and to analyze glacier change, 67 Landsat Thematic Mapper (TM) images in 2000 and 2010 (spatial resolution being 30 m), and 23 Landsat Operational Land Imager (OLI) pan- sharpened images in 2018 (spatial resolution being 15 m) in Figure 2 were downloaded from the United States Geological Survey (USGS) website (https://earthexplorer.usgs.gov/). Most of the selected satellite images were acquired at the ablation period (from July to September), which provided minimum cloud/snow cover and a high solar elevation angle to avoid shadows. However, some of the images were still unsuitable for the glacier mapping. In this case, we used images from adjacent years (1999, 2001, 2009, 2011, 2017 and 2019) or months (May, June and October) as a reference. These images had been radiometrically calibrated by the USGS.
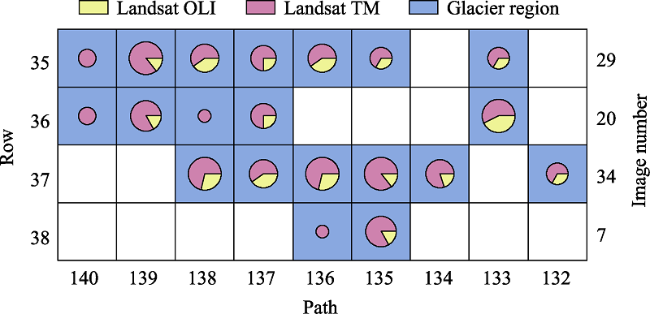
Figure 2 The orbits of Landsat images used in this paper
The Advanced Spaceborne Thermal Emission and Reflection Radiometer (ASTER) Global Digital Elevation Model (GDEM) V2 with a spatial resolution of 30 m was chosen to obtain the elevation information for the study area. It was derived from the Geospatial Data Cloud platform of the computer network information center of the Chinese Academy of Sciences (http://www.gscloud.cn/). We chose the 0.5°×0.5° grid dataset (V2.0) of the monthly precipitation and temperature to explore the climatic characteristics in the SNRC, because there are few meteorological stations around the concentrated distribution area of glaciers in this area, which was downloaded from the National Meteorological Science Data Sharing service platform (http://data.cma.cn/).

3.2 Methods

3.2.1 Glacier mapping and error estimation

The common methods of mapping the glacier outlines using optical remote sensing imagery include the normalized difference snow index (Aniya et al., 1996; Sidjak, 1999; Salomonson and Appel, 2004), the band ratio threshold method (Hall et al., 1988; Rott, 1994; Paul et al., 2002; Bolch et al., 2010), and visual interpretation (Williams et al., 1997). Existing studies have demonstrated that the band ratio threshold method has the highest efficiency and requires the least manual intervention (Paul et al., 2002; Cao et al., 2006; Racoviteanu et al., 2009).
The method to delineate glaciers in this study can be divided into three main procedures: band ratio (R/SWIR), threshold segmentation, and manual revision (Paul et al., 2015). The thresholds used in this study range from 1.8 to 2.0, which is coherent with the conclusion obtained by Wang et al. (2010). First the raw digital numbers in the red (R) band were divided by that in the SWIR band (Figure 3a). Then, the optimal threshold value was manually determined and was utilized to distinguish between the glacier areas and the non-glacier areas (Figure 3b). Thirdly, a median filter (3×3 kernel) was adopted to fill in the small gaps attributing to rocks on the ice and to remove snow patches (Raup et al., 2007) (Figure 3c). Fourthly, the binary image of the glacier and non-glacier areas in the raster format was converted to the glacier outlines in the vector format (Figure 3d). Fifthly, we manually checked each glacier's outline and revised the incorrect outlines. For example, periglacial lakes being misclassified as glacier were eliminated, which was illustrated in the magnified views in Figures 3d and 3e. Finally, the ridgelines derived from the ASTER GDEM were used to split the glacier outlines, and the individual glacier outlines were obtained (Figure 3f). The glacier outlines in 2000 derived from the above procedure was overlaid on images in 2010 and 2018, and the glacier boundary was manually modified for the corresponding years.
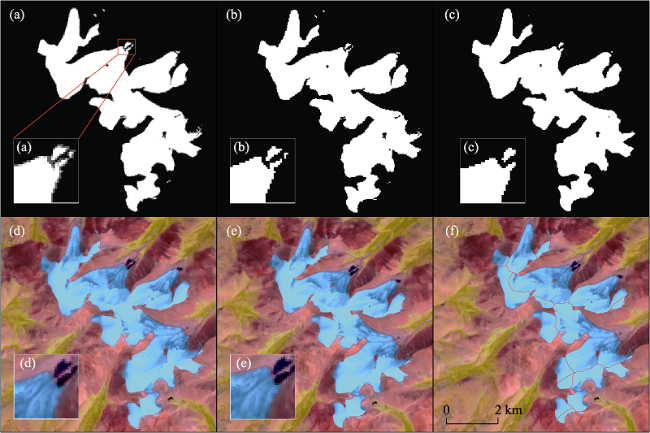
Figure 3 Procedure of the glacier mapping: (a) R/SWIR ratio image, (b) image with a threshold of 1.95, (c) image after using the median filter, (d) glacier outline in vector format, (e) image after manual revision, and (f) individual glacier outline. Affiliated images (a)-(e) are magnified views of partial area. The background of Figures (d)-(f) is Landsat TM image (Bands 5, 4, 3) acquired on August 30, 2000.
Debris-covered glaciers confound the above procedure. Debris on glaciers has a similar R/SWIR spectral signature to the surrounding moraines due to the similar reflectance at these wavelengths (Racoviteanu et al., 2008; Bhardwaj et al., 2016). However, debris-covered glaciers can be mapped by combining band ratios with topographic information (Paul et al., 2004). In this study, we selected glaciers with each area greater than 5 km2 and visually investigated their status in the ablation region. Based on Landsat images taken on other date and high-resolution images in Google Earth, the debris-covered area of glaciers was manually revised by certain signs such as the color, texture, the distribution of supra-glacial lakes and the position of water outlet (Paul et al., 2013; Guo et al., 2015). As illustrated in Figure 4a, the clean glacier ice was automatically delineated, whereas the debris-covered area could not be identified. According to the position of water outlet and the feature of lateral moraine, the terminus and side edge of this glacier was manually digitalized (Figure 4b).
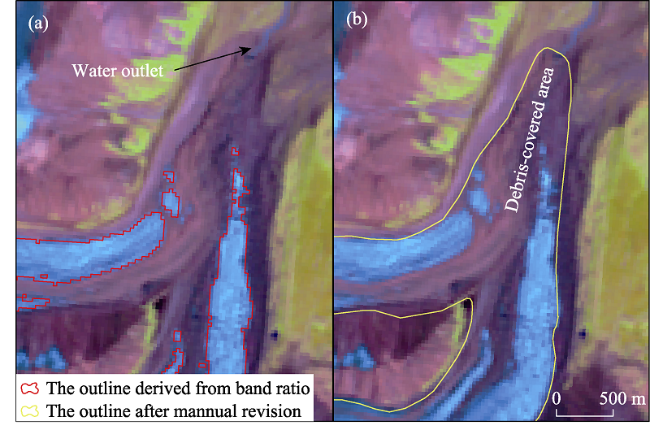
Figure 4 Diagram of mapping debris-covered glacier (background: Landsat TM image (Bands 5, 4, 3) acquired on August 14, 2010): (a) outline of debris-covered glacier obtained by band ratio method; (b) outline of debris-covered glacier after manual revision
Apart from the debris on glaciers, the presence of clouds and snow on the images limits the accuracy of glacier mapping. It is feasible to eliminate their effects and to map the overall glacier outline, by referring to multiphase imagery in the same year. The uncertainty also arises from spatial resolution of image and manual interpretation (Guo et al., 2015). In this study, we only estimated the area error caused by the image's spatial resolution and manual interpretation. When calculating the area error of the overall glacier, the common edge of neighbouring glaciers was excluded to avoid the duplication computation, so the area error could be calculated using the following equation:
$\varepsilon =P\times \frac{L}{\text{2}}$
where ɛ is the area error resulted from the image's spatial resolution and manual interpretation (m2); P is the glacial perimeter (m); L is the side length of a single pixel in the remote sensing image (30 m for Landsat TM, 15 m for Landsat OLI).

3.2.2 Methods for calculating the ice volume

Ice volume is an important index to evaluate the impact of glacier changes on river runoff (Liu et al., 2006). The methods to estimate ice volume mainly include the volume-area empirical formula, the ice thickness model, and the ground-penetrating radar method. The volume-area empirical formula is the most commonly used method (Liu et al., 2015; Gao et al., 2018), and the equation is:
$V=c\times {{A}^{\gamma }}$
where V is the ice volume (km3); A is glacial area (km2); c and γ are empirical coefficients. The empirical coefficients (Table 1) proposed by Radić and Hock (2010), Grinsted (2013), and Liu et al. (2003) were separately adopted to estimate the ice volume of glaciers. Then the average value of the three results was taken as the ice volume of glaciers in the SNRC. The error of the ice volume is the mean of the differences between the maximum, minimum and the average value of the three results.
Table 1 Parameters of the equation for calculating ice-volume of glaciers
Order Value Equation Source
c γ
1 0.0365 1.375 V=0.0365Aγ Radić and Hock
2 0.0433 1.29 V=0.0433Aγ Grinsted
3 0.04 1.35 V=0.04Aγ Liu et al.

3.2.3 Methods for extracting glacier length

The length can visually represent the advance and retreat of glacier. The methods to obtain glacier's length include the main streamline method (Wang et al., 2010; Machguth and Huss, 2014) and the center flowline method (Bris and Paul, 2013; Kienholz et al., 2014; Yao et al., 2015). We adopted the method recently proposed by Zhang et al. (2021) to extract the length of each glacier for 2000 in the SNRC. As shown in Figure 5, all glaciers were divided into two groups: glacier with single basin and single outlet, and glacier with compound basins and single outlet. For the former, there is only one centerline of the glacier, which length is the glacier length. For the latter, there are more branched centerlines than one and the maximum length of centerlines is regarded as the glacier length (Shi, 2001). We checked the extracted result and found the following situations: incorrect termini (hereinafter situation 1) and glaciers that long along the ridge but short longitudinally (hereinafter situation 2). For situation 1, we manually moved the termini based on DEM data and Google Earth images. For situation 2, we picked them out and constructed their minimum boundary rectangle using Python code, then used the width of this rectangle as the length of that glacier. Then, the glacier lengths for 2000 were edited (split or extended) based on the glacier boundaries and remote sensing images for 2010 and 2018 to get the glacier lengths for 2010 and 2018. Therefore, the change in glacier length is actually the split and extended value.
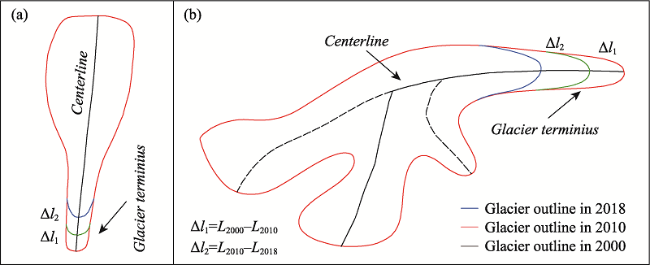
Figure 5 Diagram illustrating the length and its change of glaciers: (a) glacier with single basin and single outlet; (b) glacier with compound basins and the single outlet
The accuracy of the glacier outlines and the quality of DEM data have influenced on the accuracy of glacier length extraction, although the latter has a negligible effect on the glacier length (Yao et al., 2015). In this paper, the average length is used to calculate the variation of glacier length. The length error is the sum of the half of image pixel where the two endpoints of the centerlines are located, i.e., the spatial resolution of the remote sensing image. Therefore, the length error of individual glacier is equal to the spatial resolution of Landsat TM/OLI images (30 m for glaciers in 2000 and 2010, 15 m for glaciers in 2018).

3.2.4 Methods for calculating glacier change

Because the remote sensing images to generate the glacier outlines were acquired at different years, we calculated the relative rate of area change of glaciers in the SNRC. The equation proposed by Sun et al. (2018) is as follows:
$P{{V}_{GC}}=\left[ {{\left( \frac{G{{A}_{k}}}{G{{A}_{l}}} \right)}^{1/{{Y}_{k-l}}}}-1 \right]\times 100%$
where PVGC is the relative rate of area change (%·a-1); GAk and GAl are the glacier areas of the latter phase and the former phase, respectively; Yk-l is the time span between the latter phase and the former phase (a), which can be calculated by Equation (4):
${{Y}_{k-l}}=\frac{\sum\limits_{k=1}^{e}{{{A}_{k}}\cdot {{Y}_{k}}}}{\sum\limits_{k=1}^{e}{{{A}_{k}}}}-\frac{\sum\limits_{l=1}^{f}{{{A}_{l}}\cdot {{Y}_{l}}}}{\sum\limits_{l=1}^{f}{{{A}_{l}}}}$
where Ak and Yk are the area of glacier k and its acquisition year for the latter phase, respectively; Al and Yl are the area of glacier l and its acquisition year for the former phase, respectively; and e and f are the glacier totals for the latter phase and the former phase, respectively.
Glacier changes in term of number, area, ice-volume and average length are their differences in different periods. Therefore, the error of change can be calculated by Equation (5) according to the law of error propagation.
$\mathop{m}_{\Delta }=\sqrt{{{\mathop{m}_{l}}^{2}}+{{\mathop{m}_{f}}^{2}}}$
where mΔ is the error of glacier change; ml and mf are the error of area/volume/average length for the latter phase and the former phase, respectively.

4 Results

4.1 The current status of the glaciers in the Sanjiangyuan Nature Reserve of China

In 2018, there were 1714 glaciers in the SNRC, with an area of 2331.15±54.84 km2, an ice volume of 188.90±6.41 km3, and an average length of 1475.4±15 m. The number of glaciers in this area was dominated by glaciers with an area of <0.5 km2. There were 1086 glaciers with each area less than 0.5 km2, accounting for 63% of the total number of glaciers. The area of glaciers was dominated by glaciers with an area of 5-50 km2 (Figure 6). There were only two glaciers with an area larger than 50 km2, and their areas were 89.02 km2 (Monomah Glacier) and 51.19 km2 (Glacier coded G091104E33504N), respectively.
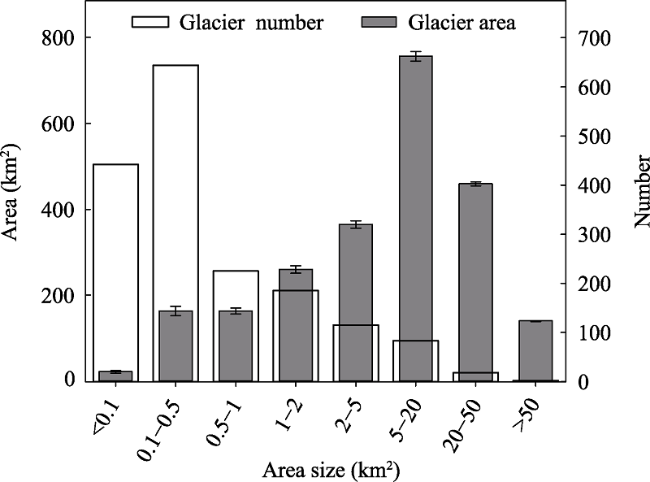
Figure 6 Numbers and areas of glaciers in different sizes in the Sanjiangyuan Nature Reserve of China in 2018
The Yangtze River Basin has the largest number, area, ice volume, and average length of glaciers, followed by the Tibetan Plateau endorheic region except for the number of the glaciers. The number and average length of the glaciers in the Mekong River Basin were larger than those of the Yellow River Basin, but the area and ice volume of glaciers were the smallest. In the sub-basins, the area, ice volume, and average length of the glaciers in the Jinsha River Basin were the largest, accounting for 44.03%, 40.37%, and 47.58% of the total amounts in the SNRC respectively, followed by those in the Siling Co Basin. The Minjiang River Basin has the minimal number, area, ice volume, and average length of the glaciers (Table 2).
Table 2 Statistics of glaciers in different basins in the Sanjiangyuan Nature Reserve of China
Name and code
of basin
Name and code
of sub-basin
Glacier number Glacier area Ice volume Glacier average length
(%) (km2) (%) (km3) (%) (m)
The Yellow
River Basin (5J)
Upper reach of
the Yellow River (5K3)
94 5.48 96.9±3.08 4.16±5.62 7.21±0.33 3.79±5.15 1382.13±15
The Yangtze
River Basin (5K)
Jinsha River
(5K4)
875 51.05 1026.63±24.63 44.03±44.91 76.22±1.98 40.37±30.89 1374.99±15
Minjiang River (5K6) 4 0.23 0.77±0.06 0.03±0.11 0.02±0.002 0.01±0.03 672±15
879 51.28 1027.4±24.69 44.06±45.42 76.24±1.98 40.38±30.89 1371.8±15
The Mekong
River Basin (5L)
Angqu River
(5L3)
66 3.85 20.43±1.04 0.88±1.86 0.89±0.05 0.47±0.78 756.36±15
Zhaqu River
(5L4)
198 11.55 73.24±3.58 3.14±6.51 3.32±0.15 1.76±2.34 841.92±15
264 15.40 93.67±4.62 4.02±8.37 4.21±0.20 2.23±3.12 820.53±15
The East Asia
endorheic region (5Y)
Qaidam endorheic region (5Y5) 225 13.13 404.26±7.38 17.34±13.46 38.11±0.30 20.18±4.68 1843.2±15
The Tibetan
Plateau endorheic region (5Z)
Ayako Kumku Lake and Hoh
Xil Lake (5Z1)
115 6.71 255.01±4.24 10.94±7.73 20.75±0.51 10.99±7.96 1994.43±15
Siling Co (5Z2) 137 7.99 454.34±5.43 19.49±9.9 42.35±0.69 22.43±10.76 2426.42±15
252 14.70 709.35±9.67 30.42±17.63 63.1±1.20 33.42±18.72 2229.29±15

4.2 The glacier change in the Sanjiangyuan Nature Reserve of China in 2000-2018

The number, area, ice volume, and average length of the glaciers in the SNRC decreased by 69, 271.95±132.06 km2, 18.59±8.83 km3, and 84.75±34 m in 2000-2018, respectively. It was found that the glacier area of different sizes decreased except for the glaciers with areas larger than 50 km2, within the study periods (Figure 7). Glaciers with area less than 0.1 km2 decreased the fastest, with a relative rate of area change of -5.85%·a-1 during 2000-2018. As the area increased, the relative rate of the area variation decreased. Glaciers with area of 5-20 km2 had the slowest relative rate of area change (-0.22%·a-1) in 2000-2018. Therefore, small glaciers are more likely to retreat in this region. The number of glaciers with an area larger than 0.5 km2 increased, which is attributed to the disintegration of many large glaciers during the study period. For example, the glacier coded G092093E33145N disintegrated into three glaciers within 2000-2011 (Figures 8a and 8b), the area was 1.36±0.12 km2 in 2000 and changed to 0.89±0.07 km2, 0.12±0.02 km2, and 0.05±0.01 km2 in 2011. The glacier with a code of G092093E33145N disintegrated into two glaciers within 2010-2019 (Figures 8c and 8d), the area was 6.27±0.23 km2 in 2010 and became to 5.91±0.10 km2, and 0.15±0.006 km2.
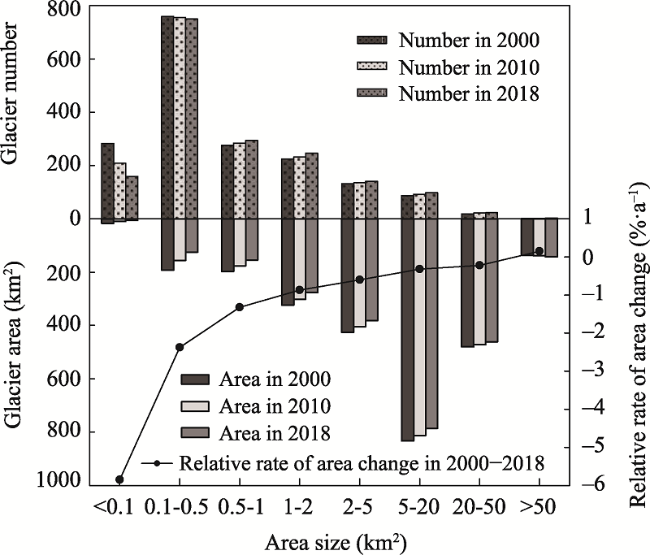
Figure 7 Changes in the numbers and areas of the glaciers in different sizes in the Sanjiangyuan Nature Reserve of China in 2000-2018
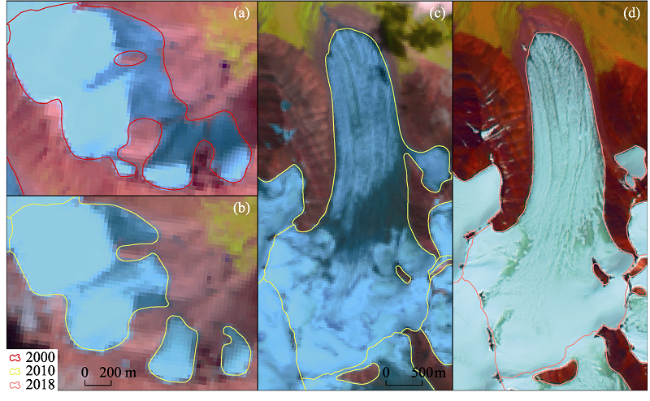
Figure 8 Diagram illustrating the glacier disintegration: (a) background: Landsat TM image (Bands 5, 4, 3) acquired on August 30, 2000; (b) background: Landsat TM image (Bands 5, 4, 3) acquired on August 29, 2011; (c) background: Landsat TM image (Bands 5, 4, 3) acquired on August 01, 2010; (d) background: Landsat OLI image (Bands 6, 5, 2, 8) acquired on July 25, 2019.
The glaciers in the SNRC are located at elevations of 4400-6800 m (Figure 9a). Glaciers area within 5100-6100 m was 2229.33 km2 in 2018, accounting for 95.63% of the total glacier area in this period. In 2000 and 2010, the glacier areas in this elevation range were 2492.15 km2 (95.72%) and 2365.42 km2 (95.72%), respectively. The reduction in the glacier area mainly occurred below 5900 m in 2000-2018 (Figure 9b), with an area loss of 269.23 km2, accounting for 98.84% of the total reduction in glacier area. The glaciers located at elevations of 4300-4500 m had the fastest area shrinkage rate (-19.9%·a-1). The median elevations for all glaciers are 5594.68 m, 5606.00 m, and 5616.03 m in 2000, 2010, and 2018 respectively, which gradually rose during the study periods, reflecting the continuous retreat of the glaciers in the SNRC.
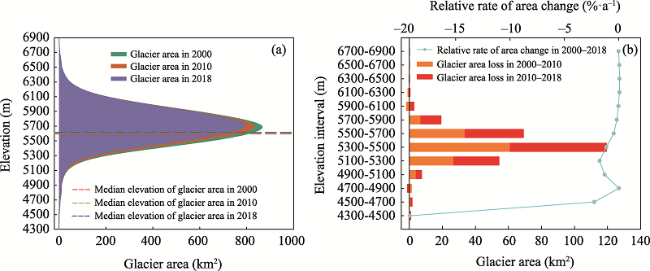
Figure 9 Glacial area change with increasing altitude and the median elevations of the glacier area in 2000, 2010, and 2018 (a). The area losses in 2000-2010 and 2010-2018 at each elevation gradient and the relative rate of area loss in 2000-2018 (b).
The glaciers in the headwater region of the Yangtze River had the largest area loss (-154.45 km2) and the shortest loss of average length (-102.17 m) during 2000-2018. The relative change rates in terms of area and average length in this region were -0.78%·a-1 and -0.40%·a-1, respectively. The area loss in the headwater region of the Mekong River was 41.5 km2 within 2000-2018, with the fastest relative change rate of -2.02%·a-1. The loss of average length in this region was 125.82 m (-0.79%·a-1). The area loss in the source area of the Yellow River was 15.52 km2 (-0.82%·a-1) in 2000-2018, and the loss of average length in this region was 125.54 m (-0.48%·a-1). Compared to the above three exorheic basins, the change rates of glaciers in two endorheic basins were slower during 2000-2018. The area losses of glaciers in the Tibetan Plateau endorheic region and the East Asia endorheic region were 16.63 km2 (-0.33%·a-1) and 43.83 km2 (-0.22%·a-1), respectively. And the changes of average length of glaciers in these two basins were -38.62 m (-0.14%·a-1) and -56.42 m (-0.12%·a-1), respectively.
In two periods of 2000-2010 and 2010-2018, the relative rates of area change in these five basins all gradually accelerated, from -0.66%·a-1 to -0.92%·a-1 in the headwater region of the Yangtze River, -0.54%·a-1 to -1.17%·a-1 in the headwater region of the Yellow River, -1.79%·a-1 to -2.30%·a-1 in the source area of the Mekong River, -0.20%·a-1 to -0.26%·a-1 in the East Asia endorheic region, and -0.27%·a-1 to -0.41%·a-1 in the Tibetan Plateau endorheic region. However, the relative rate of average length change exhibited a different mode. The Tibetan Plateau endorheic region, the headwater regions of the Yellow River and the Mekong River exhibited gradually slowing down change rates, while the East Asia endorheic region and the headwater region of the Yangtze River exhibited an accelerating trend (Figure 10). More attentions should be paid to the glaciers in the headwater region of the Yellow River, because the loss rate of glacier area in 2010-2018 was more than twice that in 2000-2010.
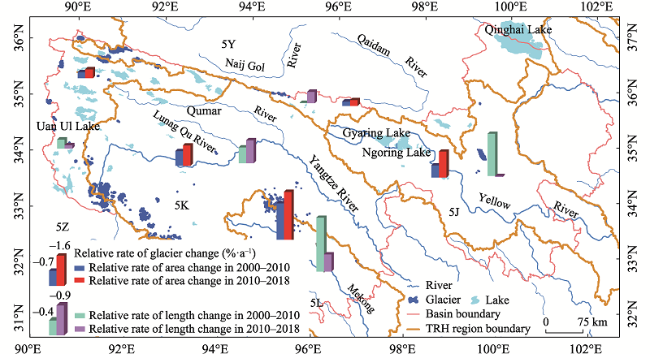
Figure 10 Regional differentiation in changes of glacier areas and lengths in the Sanjiangyuan Nature Reserve of China

5 Discussion

5.1 Causes of the glacier changes in the Sanjiangyuan Nature Reserve of China

5.1.1 Climate change

Climatic factors play a crucial role in the life cycle of glaciers. Temperature and precipitation are the main climate factors causing glacier changes. Precipitation affects the accumulation of glaciers, and temperature affects the ablation of glaciers (Xie and Liu, 2010). Climate change in the SNRC is a hotspot because it is located in the key area of the Tibetan Plateau. Bai et al. (2020) found that the warming rate (0.06°C/a) in this region was four times that of the world during 1982-2015, which shows the severe magnitude of warming. Liu et al. (2019) examined the precipitation change rate in this area in 1960-2015 and reported that the rate was 20.048 mm/10a. Han et al. (2020) qualified the temperature change in the SNRC from 1961 to 2016, and discovered that the average summer warming rate was 0.28°C/10a. Jin et al. (2020) concluded that the warming rate in the SNRC was 0.37°C/10a and precipitation increased rate was 8.41 mm/10a within 1961-2019. We also found that the average summer temperature and the annual precipitation have both increased in recent decades in the SNRC (Figure 11). The temperature change rate was 0.5°C/10a during 1988-2018. The fluctuation of average summer temperature was in 7℃-10℃, with a peak of 9.9℃ in 2016. The precipitation change rate was 26.7 mm/10a, and the average annual precipitation was 443.3 mm. Although the values of warming and humidification are not consistent due to different study periods, there is no doubt that this region is getting warmer and wetter.
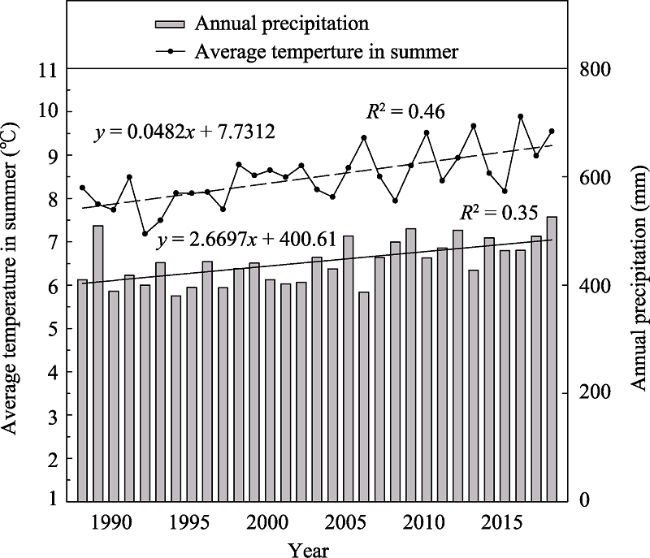
Figure 11 Temperature and precipitation changes in the Sanjiangyuan Nature Reserve of China in 1988-2018
The summer warming rate in the SNRC gradually decreased from the center to the edge of the region over the past decades (Figure 12). The Bayan Har Mountains in the headwater region of the Mekong River had the fastest rate of temperature rise, followed by the A'nyêmaqên Mountains in the headwater region of the Yellow River. The Tanggula Mountains in the headwater region of the Yangtze River had the slowest rate of temperature increase. The spatial variation in the precipitation was unobvious. In general, the increase rates in the southwestern and eastern regions of the study area were relatively fast. The rate of precipitation increase in the Tanggula Mountains was the fastest, and the rate of precipitation increase in the Bayan Har Mountains was slightly faster than that in the A'nyêmaqên Mountains. This conclusion is in accordance with that concluded by Liu et al. (2019), who also believed that the descending order of precipitation increase rate is the Yangtze River source area, the Mekong River source area, and the Yellow River source area.
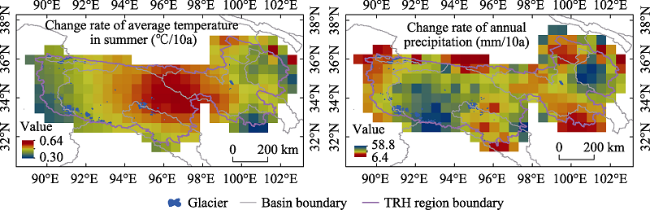
Figure 12 Spatial changes in temperature and precipitation in the Sanjiangyuan Nature Reserve of China in 1988-2018
We conducted significance tests on the rates of temperature and precipitation change in the distribution areas of glaciers. The results (Figure 13) showed that the rate of temperature change all passed the significance test, and the P-value was less than 0.001, indicating that the rate of temperature increase in the glacier areas was very accurate. The rate of precipitation increases in some of the glacier areas did not pass the significance test, with a P-value of greater than 0.05, but this is a normal phenomenon.
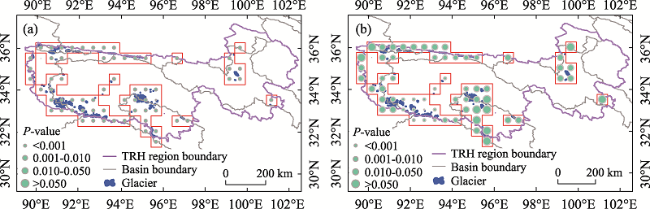
Figure 13 Significance tests of the temperature (a) and precipitation (b) change rates in the Sanjiangyuan Nature Reserve of China in 1988-2018

5.1.2 Topographic factors and glacier changes

Orientation can control the local heat budget and is the main topographic factors affecting glacier change. As shown in Figure 14a, the north-oriented glaciers had the largest area (625.55±30.33 km2) in the SNRC, followed by northeast-oriented glaciers (449.49±25.32 km2). The northwest-facing glaciers had the smallest area (268.83±12.35 km2). The area of glaciers in each orientation decreased in 2000-2018, and the largest loss in glacier area occurred in the north-oriented glaciers (-131.37±32.92 km2). The least reduction in area occurred in the east-oriented glaciers (-3.82±15.2 km2). A similar result was found for the relative rate of glacier loss (Figure 14b), i.e., the loss rate of glacier area was the fastest for the north-oriented glaciers (-1.3%·a-1), whereas it was the slowest for the east-oriented glaciers (-0.06%·a-1).
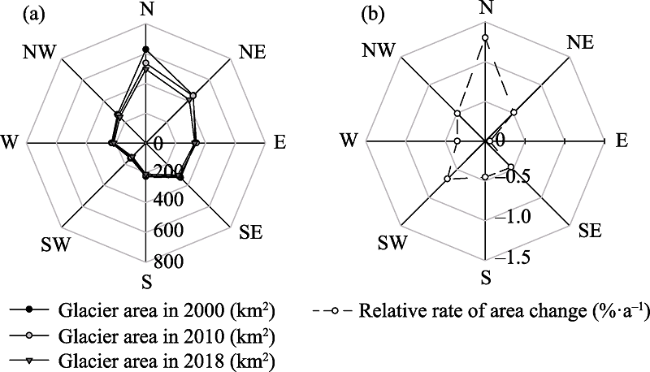
Figure 14 Glacier change in different orientations in the Sanjiangyuan Nature Reserve of China
The size and terminus elevation of glaciers are also primary factors affecting glacier changes. Previous studies (Jin and Chen, 2004; Li et al., 2011; Xu et al., 2016) have concluded that the climate change has a stronger influence on small glaciers, resulting in more dramatic melt than large glaciers. The lower the glacier's terminus, the warmer the temperature around the glacier's terminus, and the more likely the glacier will melt. We explored the relationships among glacier area, terminus elevation, and glacier size to analyze the differences of the glacier change in the SNRC (Figure 15). The average terminus elevation of the glaciers in the Tibetan Plateau endorheic region was the highest (5372.78 m), followed by the Yangtze River source area (5346.83 m). The terminus elevation of the glaciers in the Yellow River source area was the lowest (4986.88 m). The average size of the glaciers in the Tibetan Plateau endorheic region was the biggest (2.91 km2), followed by the East Asia endorheic region (1.83 km2). The average size of the glaciers in the Mekong River source area was the smallest (0.46 km2). Therefore, in addition to the influences of temperature and precipitation, the small size of glaciers in the Mekong River source area also positively affected their retreat rate. For the Yellow River source area, the lower elevation of glaciers' terminus played a key role in their rapid recession.
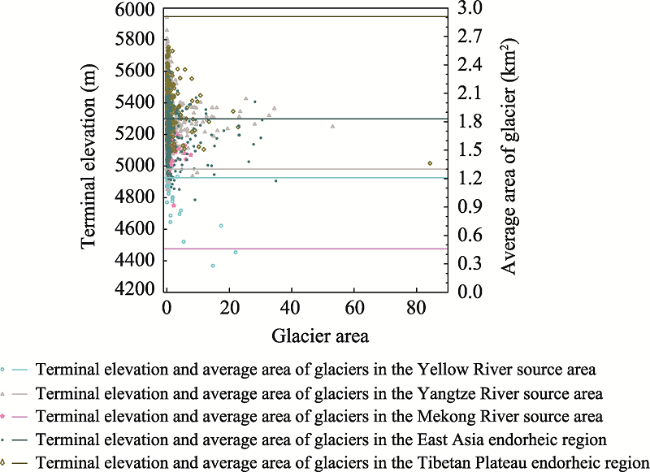
Figure 15 Relationships among glacier area, terminus elevation and glacier size in the Sanjiangyuan Nature Reserve of China

5.1.3 The advance/surge glaciers

Although most of the glaciers in the SNRC were characterized by retreat, nine glaciers advanced during the study period (Figure 16). The advancing glaciers are large with an area above 5 km2. Combining with the first and second Chinese Glacier Inventory datasets, we explored the length change of these nine glaciers between 1970-2018. Some of the nine glaciers were classified as surge-glaciers in some studies (Yan et al., 2019; Guo et al., 2020; King et al., 2021), and their criteria include: (1) rapid advance of glacier terminus; (2) ve locity acceleration over a part or all of a glacier surface; (3) surface elevation changes in both the accumulation and ablation zones of glaciers. King et al. (2021) reported the surge of glacier coded G091104E33504N initiated in 1994 and ceased in 2005. Yan et al. (2019) thought that the surge of this glacier might occur in 2000-2003. We discovered that this glacier was retreating before 2000, and experienced a dramatical advance (336.83 m) in 2000-2002, and then continued to advance at a gradually decreasing speed until 2005, with a total advance distance of 470.83 m (2000-2005). King et al. (2021) suggested that the surge period for glacier coded G090847E33480N was from 2002 to 2018, and the surge of this glacier started in 2008 and terminated in 2018. We found that this glacier advanced 219.4 m from 2008 to 2009 and then advanced at an average speed of 55.25 m/a until 2017, the total advance distance was 721.4 m in 2008-2017. Additionally, the glacier coded G091071E 33463N advanced 312.1 m from 2002 to 2005, which is also consistent with the surge duration of this glacier reported by Yan et al. (2019) and King et al. (2021).
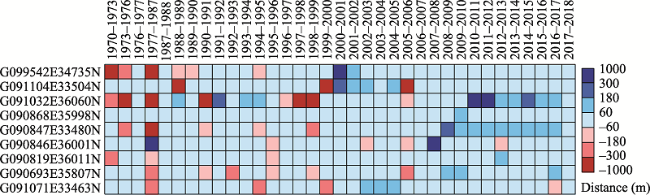
Figure 16 Chronology of the surge- and advance-glaciers in the Sanjiangyuan Nature Reserve of China between 1970 and 2018
Monomah Glacier with a code of G091032E36060N advanced 168.3 m in 1988-1989. It advanced again from 1991 to 1995 (522.3 m) with an average speed of 130.58 m/a. There was another dramatical advance (941.6 m) in 2010-2012 and then continued to maintain the advancement status until 2017 with an advance distance of 556 m (2012-2017). Guo et al. (2020) explored the change in thickness, motion, and surface feature of Monomah Glacier in 2000-2017 using the TanDEM-X, ALOS/PRISM, Sentinel-1A, and Landsat images, and reported the surge of this glacier started in 2009 and ended in 2016, with an advance distance of 1450 m, which was very close to our result.
Except for the above surging glaciers, we found that advance or surge also occurred in the other five glaciers in the SNRC. The glacier coded G099542E34735N in the A'nyêmaqên Mountains surged 427.43 m in 2000-2001 and 64.49 m in 2001-2002. The glacier coded G090868E35998N advanced in 2009-2010 (110.03 m). The glacier coded G091032E 36060N advanced 602.14 m during 1977-1987, with a speed of 60.2 m/a, and surged 307.1 m in 2007-2008. Glacier coded G090819E36011N advanced continuously during 2008-2013, but the distance was short (61 m) and its terminus was broadening. The glacier coded G090693E35807N surged 207.94 m from 2008 to 2010, and then continued to advance slightly, with a total distance of 66 m in 2010-2017.
There are two well-known theories on the trigger mechanism of glacier surge: thermal control (Kamb, 1987) and hydrological control (Murray, 2003). However, these two mechanisms are summarized from field investigation in Alaska (Kamb et al., 1985) and Svalbard (Murray, 2003), the mechanism for surge-glaciers in the Tibetan Plateau are ambiguous (Paul, 2020). Hewitt et al. (2017) suggested the active phase of hydrology-controlled glacier surge is shorter, and that of surge controlled by thermal condition is longer. Lv et al. (2016) found 13 surge-glaciers in the Karakoram Range and concluded that the quick-advance and short-term surging glaciers were governed by hydrological control. Therefore, Yan et al. (2019) believed the surges of glaciers coded G091071E33463N and G091104E33504N were hydrology-controlled, because their surge period only lasted for one or two years. Guo et al. (2020) reported the recent surge event of Monomah Glacier was controlled by thermal condition. The recent surge of this glacier lasted for 8 years and always occurred in summer and winter, these manifestations are consistent with the thermal-controlled glacier surge. Changes in temperature and precipitation may have played a weakly positive role in the surge events in the Geladandong ice cap (Lv et al., 2016). The identification of glacier surge mechanism cannot be determined by the surge duration, but also requires detailed information on surface velocity change and hydrology, etc. Therefore, the surge mechanisms of the remaining six glaciers are not yet confirmed.

5.2 Comparison with previous studies of glaciers in the Sanjiangyuan Nature Reserve of China

In this study, the area loss of glaciers in the A'nyêmaqên Mountains located in the headwater region of the Yellow River was determined to be 14.37 km2, and the loss rate was 0.80 km2·a-1 within 2000-2018. However, Liu et al. (2002) and Yang et al. (2003) suggested that the area loss rate and area reduction in this region were 0.64 km2·a-1 and 21.7 km2, respectively, in 1966-2000. The glacier area change and area change rate during 1969-2000 in the Geladandong Mountain located in the headwater region of the Yangtze River were -15.59 km2 and -0.50 km2·a-1 reported by Yang et al. (2003). According to Jin et al. (2013), glacier area change was -55.98 km2, and the area change rate was -1.55 km2·a-1 in this area in 1973-2009. These above two area change rates are lower than our result (-2.22 km2·a-1). Previous studies have also concluded that glaciers' change rate in the entire headwater region of the Yangtze River was -2.23 km2·a-1 during 1969/1971-1999/2002 (Xu et al., 2013), -3.91 km2·a-1 within 1970-2009 (Wu et al., 2013). These discrepancies may be attributed to the different data sources and the different study periods. The use of topographic maps can cause variations (Bhambri et al., 2013) and their accuracy for glacier study should be seriously considered. The study period of our investigation is later than those of previous studies, and the glaciers across the Tibetan Plateau have exhibited accelerated retreat since 1980, so the higher values obtained in this study than previous ones are consistent with the trend across the Tibetan Plateau.

6 Conclusions

In this study, we performed the first comprehensive examination of glacier change across the entire SNRC and explored the causes of the glacier changes. There were 1714 glaciers, with an area of 2331.15±54.84 km2, an ice volume of 188.90±6.41 km3, and an average length of 1475.4±15 m in the SNRC in 2018. The number of glaciers was dominated by glaciers with an area of <0.5 km2, and the glacier area was dominated by glaciers with a size of 5-50 km2.
Glaciers in the SNRC had been experiencing recession during 2000-2018. The number, area, ice volume, and average length of the glaciers decreased by 69,271.95±132.06 km2, 18.59±8.83 km3, and 84.75±34 m, respectively. The loss of glacier area mainly occurred below 5900 m, accounting for 98.84% of the total area reduction of glaciers. The glaciers located at elevations of 4300-4500 m had the largest relative rate of area loss (-19.9%·a-1). The median elevation of the glacier area increased from 5594.68 m to 5616.03 m from 2000 to 2018. The rates of glacier change in the five basins involved in the SNRC were different. The Mekong River witnessed the fastest area loss and length decrease (-2.02%·a-1 and -0.79%·a-1), whereas the East Asia endorheic region had the slowest values (-0.22%·a-1 and -0.12%·a-1). Meanwhile, the relative rates of glacier area change in each basin all gradually accelerated, especially for the Yellow River Basin which area loss rate of glaciers in 2010-2018 was more than twice that in 2000-2010.
The recession of glaciers in the SNRC was mainly attributed to the significant rise in temperature in the last three decades. Some other factors including the size, orientation and terminus elevation of glaciers also contributed to the heterogeneity of glacier change. The lower elevation of glaciers' terminus was the key topographical feature causing rapid retreat of glaciers in the Yellow River Basin, whereas the smaller size of glaciers in the Mekong River Basin was sensitive to climate change. Even so, advance or surge occurred in the nine glaciers in the SNRC during 2000-2018, which triggers that mechanism still needs to be further explored.
[1]
Aniya M, Sato H, Naruse R et al., 1996. The use of satellite and Airborne imagery to inventory outlet glaciers of the southern Patagonia Icefield, South America. Photogrammetric Engineering & Remote Sensing, 62(3): 1361-1370.

[2]
Bai Y, Guo C, Degen A A et al., 2020. Climate warming benefits alpine vegetation growth in Three-River Headwater Region, China. Science of the Total Environment, 742: 140574.

DOI

[3]
Bhambri R, Bolch T, Kawishwar P et al., 2013. Heterogeneity in glacier response in the upper Shoyok valley, northeast Karakoram. The Cryosphere, 7: 1385-1398.

DOI

[4]
Bhardwaj A, Joshi P K, Sam L et al., 2016. Remote sensing of alpine glaciers in visible and infrared wavelengths: A survey of advances and prospects. Geocarto International, 31(5): 557-574.

DOI

[5]
Bolch T, Menounos B, Wheate R, 2010. Landsat-based inventory of glaciers in western Canada, 1985-2005. Remote Sensing of Environment, 114(1): 127-137.

DOI

[6]
Bris L R, Paul F, 2013. An automatic method to create flow lines for determination of glacier length: A pilot study with Alaskan glaciers. Computers and Geosciences, 52(1): 234-245.

DOI

[7]
Cao M S, Li X, Chen X Z et al., 2006. Remote Sensing of Cryosphere. Beijing: Science Press. (in Chinese)

[8]
Chen D L, Xu B Q, Yao T D et al., 2015. Assessment of past, present and future environmental changes on the Tibetan Plateau. Chinese Science Bulletin, 60(32): 3025-3035. (in Chinese)

[9]
Ding Y J, Zhang S Q, Chen R S, 2020. Cryospheric hydrology: Decode the largest freshwater reservoir on Earth. Bulletin of the Chinese Academy of Sciences, 35(4): 414-424. (in Chinese)

[10]
Duan H Y, Yao X J, Liu S Y et al., 2019. Glacier change in the Tanggula Mountains, Tibetan Plateau, in 1969-2015. Journal of Mountain Science, 16(11): 2663-2678.

DOI

[11]
Gao Y P, Yao X J, Liu S Y et al., 2018. Methods and future trend of ice volume calculation of glacier. Arid Land Geography, 41(6): 1204-1213. (in Chinese)

[12]
Grinsted A, 2013. An estimate of global glacier volume. The Cryosphere, 7(1): 141-151.

DOI

[13]
Guo L, Li J, Wu L et al., 2020. Investigating the recent surge in the Monomah Glacier, Central Kunlun Mountain Range with multiple sources of remote sensing data. Remote Sensing, 12(6): 966.

DOI

[14]
Guo W Q, Liu S Y, Xu J L et al., 2015. The second Chinese glacier inventory: Data, methods and results. Journal of Glaciology, 61(226): 357-372.

DOI

[15]
Hall D K, Chang A T C, Siddalingaiah H, 1988. Reflectances of glaciers as calculated using Landsat-5 Thematic Mapper data. Remote Sensing of Environment, 25(3): 311-321.

DOI

[16]
Han F X, 2020. Variation characteristics of temperature in Sanjiangyuan area in 1961-2016. Qinghai Prataculture, 29(4): 38-44. (in Chinese)

[17]
Hewitt K, 2017. Tributary glacier surges: An exceptional concentration at Panmah Glacier, Karakoram Himalaya. Journal of Glaciology, 53(181): 181-188.

DOI

[18]
Hu F S, Yang T B, Wang J et al., 2017. Variation of the Malan ice cap and its response to climate change based on object-oriented extraction method. Arid Zone Research, 34(5): 1018-1026. (in Chinese)

[19]
Jiang J, Wang S M, 2004. Primary analyse of water resource, disasters and environment in the Changjiang River catchment. Quaternary Sciences, 24(5): 512-517.

[20]
Jin R, Che T, Li X et al., 2004. Glacier variation in the Pumqu basin derived from remote sensing data and GIS technique. Journal of Glaciology and Geocryology, 26(3): 261-266. (in Chinese)

[21]
Jin S S, Zhang Y H, Wu H G, 2013. Study on glacial advancement and retreatment in Geladandong region of Changjiangyuan in recent 40 years. Journal of Natural Resources, 28(12): 2095-2104. (in Chinese)

[22]
Jin Z, You Q L, Wu F Y et al., 2020. Changes of climate and climate extremes in the Three-Rivers` Headwaters region over the Tibetan Plateau during the past 60 years. Transactions of Atmospherics Sciences, 43(6): 1042-1055. (in Chinese)

[23]
Kääb A, 2002. Monitoring high-mountain terrain deformation from repeated air- and spaceborne optical data: Examples using digital aerial imagery and ASTER data. Photogrammetry & Remote Sensing, 57(1/2): 39-52.

[24]
Kamb B, Raymond C F, Harrison W D et al., 1985. Glacier surge mechanism: 1982-1983 surge of Variegated Glacier, Alaska. Alaska. Science, 227(4686): 469-479.

PMID

[25]
Kamb B, 1987. Glacier surge mechanism based on linked cavity configuration of the basal water conduit system. Journal of Geophysical Research, 92(B9): 9083-9100.

DOI

[26]
King O, Bhattacharya A, Bloch T et al., 2021. The presence and influence of glacier surging around the Geladandong ice caps, North East Tibetan Plateau. Advances in Climate Change Research, 12(3): 299-312.

DOI

[27]
Kienholz C, Rich J L, Arendt A A et al., 2014. A new method for deriving glacier centerlines applied to glaciers in Alaska and northwest Canada. The Cryosphere, 8(2): 503-519.

DOI

[28]
Li Z G, Yao T D, Ye Q H et al., 2011. Monitoring glacial variations based on remote sensing in the Luozha region, eastern Himalayas, 1980-2007. Geographical Research, 30(5): 939-952. (in Chinese)

[29]
Li X, Cheng G, Jin H et al., 2008. Cryospheric change in China. Global & Planetary Change, 62(3/4): 210-218.

[30]
Liu J, Yao X J, Liu S Y et al., 2020. Glacial changes in the Gangdisê Mountains from 1970 to 2016. Journal of Geographical Sciences, 30(1): 131-144.

DOI

[31]
Liu S Y, Ding Y J, Li J et al., 2006. Glaciers in response to recent climate warming in western China. Quaternary Sciences, 26(5): 762-771.

[32]
Liu S Y, Lu A X, Ding Y J et al., 2002. Glacier fluctuations and the inferred climate changes in the A′Nyêmaqên Mountains in the source area of the Yellow River. Journal of Glaciology and Geocryology, 24(6): 701-707. (in Chinese)

[33]
Liu S Y, Sun W X, Shen Y P et al., 2003. Glacier changes since the Little Ice Age maximum in the western Qilian Shan, northwest China, and consequences of glacier runoff for water supply. Journal of Glaciology, 49(164): 117-124.

DOI

[34]
Liu S Y, Yao X J, Guo W Q et al., 2015. The contemporary glaciers in China based on the Second Chinese Glacier Inventory. Acta Geographica Sinica, 70(1): 3-16. (in Chinese)

[35]
Liu X Q, Wu Z Z, Liu Y S et al., 2019. Spatial-temporal characteristics of precipitation from 1960 to 2015 in the Three Rivers' Headstream Region, Qinghai, China. Acta Geographica Sinica, 74(9): 1803-1820. (in Chinese)

[36]
Liu Y G, Wang N L, Zhang J H et al., 2019. Climate change and its impacts on mountain glaciers during 1960-2017 in western China. Journal of Arid Land, 11(4): 537-550.

DOI

[37]
Lu A X, Yao T D, Liu S Y et al., 2002. Glacier change in the Geladandong area of the Tibetan Plateau monitored by remote sensing. Journal of Glaciology and Geocryology, 24(5): 559-562. (in Chinese)

[38]
Lv M, Lu X, Guo H et al., 2016. A rapid glacier surge on Mount Tobe Feng, western China, 2015. Journal of Glaciology, 62(232): 407-409.

DOI

[39]
Machguth H, Huss M, 2014. The length of the world's glaciers: A new approach for the global calculation of center lines. The Cryosphere, 8(5): 1741-1755.

DOI

[40]
Meng X H, Chen H, Li Z G et al., 2020. Review of climate change and its environmental influence on the Three-River regions. Plateau Meteorology, 39(6): 1133-1143. (in Chinese)

[41]
Murray T, 2003. Is there a single surge mechanism? Contrasts in dynamics between glacier surges in Svalbard and other regions. Journal of Geophysical Research Solid Earth, 108(B5): 2337.

[42]
Oerlemans J, 1994. Quantifying global warming from the retreat of glaciers. Science, 264(5156): 243-244.

PMID

[43]
Paul F, 2020. A 60-year chronology of glacier surges in the central Karakoram from the analysis of satellite image time-series. Geomorphology, 352: 106993.

DOI

[44]
Paul F, Barrand N E, Baumann S et al., 2013. On the accuracy of glacier outlines derived from remote-sensing data. Annuals of Glaciology, 54(63): 171-182.

[45]
Paul F, Bolch T, Kääb A et al., 2015. The glaciers climate change initiative: Methods for creating glacier area, elevation change and velocity products. Remote Sensing of Environment, 162: 408-426.

DOI

[46]
Paul F, Huggel C, Kääb A, 2004. Combining satellite multispectral image data and a digital elevation model for mapping debris-covered glaciers. Remote Sensing of Environment, 89(4): 510-518.

DOI

[47]
Paul F, Kääb A, Maisch M et al., 2002. The new remote-sensing-derived Swiss glacier inventory: I. methods. Annals of Glaciology, 34(1): 355-361.

DOI

[48]
Pu J C, Yao T D, Wang N L et al., 2004. Fluctuations of the glaciers on the Qinghai-Tibetan Plateau during the past century. Journal of Glaciology and Geocryology, 26(5): 517-522. (in Chinese)

[49]
Qin D H, Yao T D, Ding Y J et al., 2017. An Introduction to the Cryospheric Science. Beijing: Science Press. (in Chinese)

[50]
Qiu J, 2008. China: The third pole. Nature, 454(7203): 393-396.

DOI

[51]
Racoviteanu A E, Paul F, Raup B H et al., 2009. Challenges and recommendations in mapping of glacier parameters from space: Results of the 2008 Global Land Ice Measurements from Space (GLIMS) workshop, Boulder, Colorado, USA. Annals of Glaciology, 50(53): 53-69.

DOI

[52]
Racoviteanu A E, Williams M W, Barry R G, 2008. Optical remote sensing of glacier characteristics: A review with focus on the Himalaya. Sensors, 8(5): 3355-3383.

PMID

[53]
Radić V, Hock R, 2010. Regional and global volumes of glaciers derived from statistical upscaling of glacier inventory data. Journal of Geophysical Research, 115: F01010.

[54]
Raup B H, Kääb A, Kargel J S et al., 2007. Remote sensing and GIS technology in the Global Land Ice Measurements from Space (GLIMS) project. Computers & Geosciences, 33(1): 104-125.

DOI

[55]
Rott H, 1994. Thematic studies in alpine areas by means of polarimetric SAR and optical imagery. Advances in Space Research, 14(3): 217-226.

[56]
Salomonson V V, Appel I, 2004. Estimating fractional snow cover from MODIS using the normalized difference snow index. Remote Sensing of Environment, 89(3): 351-360.

DOI

[57]
Shi Y F, 2001. Estimation of the water resources affected by climatic warming and glacier shrinkage before 2050 in west China. Journal of Glaciology and Geocryology, 23(4): 333-341. (in Chinese)

[58]
Sidjak R W, 1999. Glacier mapping of the Illecillewaet icefield, British Columbia, Canada, using Landsat TM and digital elevation data. International Journal of Remote Sensing, 20(2): 273-284.

DOI

[59]
Sun M P, Liu S Y, Yao X J et al., 2018. Glacier changes in the Qilian Mountains in the past half-century: Based on the revised first and second Chinese glacier inventory. Journal of Geographical Sciences, 28(2): 206-220.

DOI

[60]
Wang G F, Zhang Y T, Zhang J P et al., 2010. Comparative study of glaciers information extraction method based on remote sensing image. Geospatial Information, 8(3): 43-46. (in Chinese)

[61]
Wang P Y, Li Z Q, Cao M et al., 2010. Variation of Qingbingtan Glacier No.72 in Mountain Tuomuer region during past 45 years. Scientia Geographica Sinica, 30(6): 962-967. (in Chinese)

[62]
Wang P Y, Li Z Q, Huai B J et al., 2015. Spatial variability of glacial changes and their effects on water resources in the Chinese Tianshan Mountains during the last five decades. Journal of Arid Land, 7(6): 717-727.

DOI

[63]
Wei W, Zhang K, Zhou J, 2020. Review and prospect of human-land relationship in Three River Headwaters region: Based on the perspective of people, events, time and space. Advances in Earth Science, 35(1): 26-37.

[64]
Williams J R S, Hall D K, Sigurðsson O et al., 1997. Comparison of satellite-derived with ground-based measurements of the fluctuations of the margins of Vatnajokull, Iceland 1973-1992. Annals of Glaciology, 24: 72-80.

DOI

[65]
Wu S S, Yao Z J, Huang H Q et al., 2013. Glacier retreat and its effect on stream flow in the source region of the Yangtze River. Journal of Geographical Sciences, 23(5): 849-859.

DOI

[66]
Xie Z C, Feng Q H, Wang X et al., 2005. Modeling the response of glacier system to climate warming: Taking glaciers in China as an example. Research of Soil and Water Conservation, 12(5): 81-86. (in Chinese)

[67]
Xie Z C, Liu C H, 2010. Introduction to Glaciology. Shanghai: Shanghai Science Popular Press. (in Chinese)

[68]
Xie Z C, Wang X, Kang E S et al., 2006. Glacial runoff in China: An evaluation and prediction for the future 50 years. Journal of Glaciology and Geocryology, 28(4): 457-466. (in Chinese)

[69]
Xu A W, Yang T B, Wang C Q et al., 2016. Variation of glaciers in the Shaksgam River Basin, Karakoram Mountains during 1978-2015. Progress in Geography, 35(7): 878-888. (in Chinese)

[70]
Xu J L, Zhang S Q, ShangGuan D H, 2013. Glacier change in headwaters of the Yangtze River in recent three decades. Arid Zone Research, 30(5): 919-926. (in Chinese)

[71]
Yan J, Lv M, Ruan Z et al., 2019. Evolution of surge-type glaciers in the Yangtze River headwater using multi-source remote sensing data. Remote Sensing, 11(24): 2991.

DOI

[72]
Yan L L, Wang J, 2013. Study of extracting glacier information from remote sensing. Journal of Glaciology and Geocryology, 35(1): 110-118. (in Chinese)

[73]
Yang J P, Ding Y J, Liu S Y et al., 2003. Glacier change and its effect on surface runoff in the source regions of the Yangtze and Yellow rivers. Journal of Natural Resources, 18(5): 595-602. (in Chinese)

[74]
Yao T D, Wu G J, Xu B Q et al., 2019. Asian water tower change and its impact. Bulletin of Chinese Academy of Sciences, 34(11): 1203-1209. (in Chinese)

[75]
Yao X J, Liu S Y, Zhu Y et al., 2015. Design and implementation of an automatic method for deriving glacier centerlines based on GIS. Journal of Glaciology and Geocryology, 37(6): 1563-1570. (in Chinese)

[76]
Zhang D H, Yao X J, Duan H Y et al., 2021. A new automatic approach for extracting glacier centerlines based on Euclidean allocation. The Cryosphere, 15(4): 1955-1973.

DOI

[77]
Zhang J T, He Y X, Shangguan D H et al., 2012. Impact of intensive glacier ablation on arid regions of northwest China and its countermeasure. Journal of Glaciology and Geocryology, 34(4): 848-854. (in Chinese)

[78]
Zhou Z H, Han N, Liu J J et al., 2020. Glacier variations and their response to climate change in an arid inland river basin of northwest China. Journal of Arid Land, 12(3): 357-373.

DOI

Outlines

/