Special Issue: Climate Change and Its Regional Response

Tree-ring-based drought variability in northern China over the past three centuries

  • ZENG Xueli , 1, 2 ,
  • LIU Yu , 1, 3, 4, 5, * ,
  • SONG Huiming 1, 3 ,
  • LI Qiang 1, 3 ,
  • CAI Qiufang 1, 3, 5 ,
  • FANG Congxi 1 ,
  • SUN Changfeng 1, 3 ,
  • REN Meng 1, 6
Expand
  • 1. The State Key Laboratory of Loess and Quaternary Geology, Institute of Earth Environment, CAS, Xi'an 710061, China
  • 2. University of the Chinese Academy of Sciences, Beijing 100049, China
  • 3. CAS Center for Excellence in Quaternary Science and Global Change, CAS, Xi'an 710061, China
  • 4. Laboratory for Ocean Dynamics and Climate, Pilot Qingdao National Laboratory for Marine Science and Technology, Qingdao 266237, Shandong, China
  • 5. School of Human Settlements and Civil Engineering, Xi'an Jiaotong University, Xi'an 710049, China
  • 6. Xi'an Institute for Innovative Earth Environment Research, Xi'an 710061, China
*Liu Yu (1963-), Professor, E-mail:

Zeng Xueli (1995-), PhD Candidate, E-mail:

Received date: 2021-06-04

  Accepted date: 2021-09-17

  Online published: 2022-04-25

Supported by

The Strategic Priority Research Program of the Chinese Academy of Sciences(XDB40000000)

National Natural Science Foundation of China(41630531)

State Key Laboratory of Loess and Quaternary Geology, Institute of Earth Environment, CAS(SKLLQG2041)

Abstract

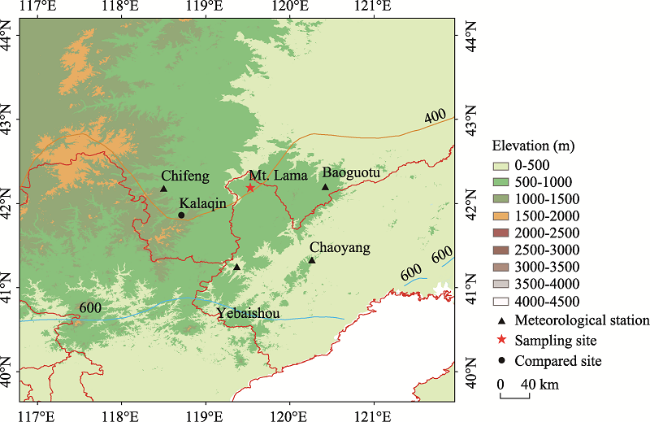
Droughts are the most frequent natural disaster in regions at the margins of the East Asian summer monsoon (EASM), which pose threats to agriculture, the economy, and human lives. However, the limitations of only approximately 60 years of meteorological observations hamper our understanding of the characteristics and mechanisms of local hydroclimate. Trees growing in the marginal region of the EASM are usually sensitive to moisture variations and have played important roles in past hydroclimatic reconstructions. Here, a 303-year tree-ring-width chronology of Pinus tabulaeformis from Mt. Lama, which is located in the junction of the Liaoning Province and Inner Mongolia, China, was used to reconstruct the May-August Palmer drought severity index (PDSI) in the marginal region of the EASM. The transfer function explains 48.0% (or 47.2% after adjusting for the loss of the degrees of freedom) of the variance over the calibration period from 1946 to 2012. A spatial correlation analysis demonstrates that our PDSI reconstruction can represent the drought variability on the northernmost margin of the EASM. The winter Asian polar vortex area index showed a delayed impact on the summer EASM precipitation in the following year.

Cite this article

ZENG Xueli , LIU Yu , SONG Huiming , LI Qiang , CAI Qiufang , FANG Congxi , SUN Changfeng , REN Meng . Tree-ring-based drought variability in northern China over the past three centuries[J]. Journal of Geographical Sciences, 2022 , 32(2) : 214 -224 . DOI: 10.1007/s11442-022-1943-3

1 Introduction

The EASM is the dominant climate systems affecting China. Its significant interannual variabilities lead to great fluctuations in precipitation and cause extreme climate events (Wang et al., 2012). Especially in the marginal area of the EASM, the large variability of precipitation has resulted in frequent droughts and flooding in summer (Xu and Qian, 2003). Severe drought events occur during the years when the EASM is too weak to reach the marginal region in North and Northwest China, causing serious impacts on the economy, agriculture, and human lives (Cheng, 2001). For example, severe drought in 2000 caused great losses in China (Li et al., 2003).
Previous studies have revealed a drying trend over recent years in arid and semiarid regions of Asia (Liu et al., 2019; Zhang et al., 2020). In the context of the last 260 years, an obvious increasing trend was found in the frequency of severe droughts and summer heatwaves over inner East Asia in recent decades (Zhang et al., 2020). There is an obvious decreasing trend of precipitation on the northwestern margin of the EASM since the 1930s, which could be related to the increasing anthropogenic sulfate aerosol emissions (Liu et al., 2019). However, whether a similar drying trend occurred on the northern margin of the EASM is not yet fully understood due to the lack of climate records with high resolutions and long timescales. Trees in the marginal region of the EASM have been proven to be sensitive to moisture variability (Liang et al., 2007; Liu et al., 2010, 2011). Hydroclimate reconstructions derived from tree-ring records can provide context for assessing the current climatic conditions on long timescales.
Only a few hydroclimate studies with annual resolution have been conducted on the northern margin of the EASM, which are mainly derived from tree-ring records. A 163-year regional drought history was reconstructed based on tree-ring width chronologies in the eastern Ortindag Sandy Land, which revealed severe drought since the mid-1960s (Liang et al., 2007). In a nearby region, Chifeng-Weichang, an obvious drying trend since the late 1990s was recorded in the precipitation reconstruction (Liu et al., 2010). However, the density of tree-ring-based hydroclimate records on the northern margin of the EASM remains comparably low, hampering us to deeply understand the mechanism of hydroclimate variability on interannual and longer timescales. In this study, we aim to build a tree-ring-width chronology in the northern margin of the EASM and reconstruct local hydroclimate series. Based on the reconstruction, we will investigate the drought variability in the history, assess the drying trend of the northern margin of the EASM in the context of global warming, and explore the possible underlying forcing mechanisms for our study region.

2 Materials and methods

2.1 Study region and tree-ring-width chronology

Our sampling site is located on Mt. Lama (119.53°E, 42.19°N), which is a rocky hill with shallow soils. Very few Chinese pines (Pinus tabulaeformis), a species widely employed in dendroclimatological studies in northern China, are distributed sporadically on Mt. Lama. A total of 32 cores were collected from 17 healthy Chinese pines by increment corers in the summer of 2013. According to standard dendrochronological methods, these cores were fixed and then surfaced by sandpaper until the yearly boundaries were easily to distinguish under a microscope (Stokes and Smiley, 1996). Tree-ring-width of each core was measured by using the LINTAB 5 with a resolution of 0.01 mm and crossdated by using TSAP software. We used the COFECHA program to control the quality of crossdating and ring-width measurements (Holmes, 1983).
The ARSTAN program was employed to establish the ring-width chronologies (Cook and Kairiukstis, 1990). The traditional linear and negative exponential function method was selected to remove the non-climate signals. To retain both low and high frequency climate informations, the STD chronology was chosen for climate response analysis and climate reconstruction. The reliable period of the chronology starts from 1710, after which the subsample signal strength (SSS) is greater than 0.85 (Wigley et al., 1984).

2.2 Climate data

The climatic data from four meteorological stations, Chifeng (118.5°E, 42.18°N, 668.6 m a.s.l.), Chaoyang (120.26°N, 41.33°E, 174.3 m a.s.l.), Yebaishou (119.37°N, 41.25°E, 422 m a.s.l.) and Baoguotu (120.42°N, 42.2°E, 400.5 m a.s.l), were used to generate a regional climate dataset (Figures 1 and 3). The data from the four stations show similar variation patterns characterized by rainy and hot summers and dry and cold winters. The average climate data from the four stations show that the annual precipitation is 360 mm, 69% of which is concentrated in summer. These are typical climate characteristics in the marginal region of the EASM. The annual average temperature of the study region increased by approximately 1.5°C, and the rainfall decreased by approximately 85 mm from 1960 to 2015 (Wang et al., 2015), implying warmer and drier climate conditions in recent years.
Figure 1 Sampling site, other sites for comparison, and nearby weather stations. The orange line indicates the 400-mm/yr precipitation isoline and the blue line indicates the 600-mm/yr precipitation isoline.
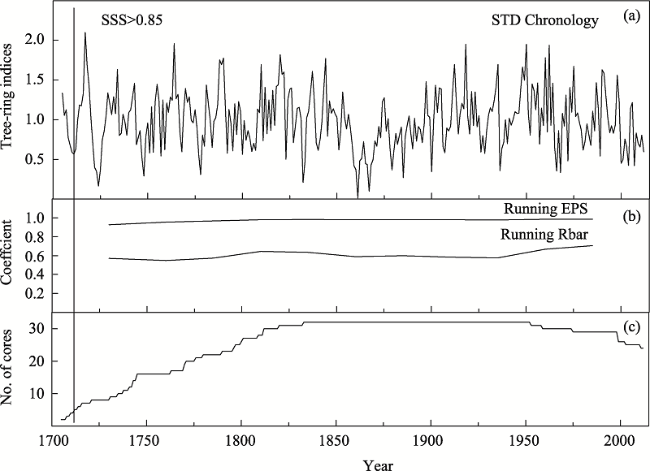
Figure 2 STD chronology of Mt. Lama (a), running Rbar and EPS (b), and sample size (c)
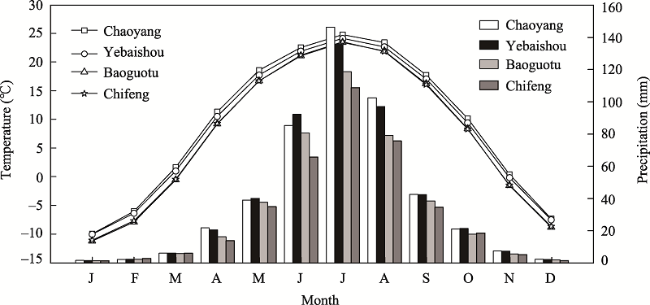
Figure 3 Monthly mean temperature (lines) and monthly total precipitation (bars) at the Chifeng, Chaoyang, Yebaishou and Baoguotu stations
The PDSI was designed to represent drought conditions by using a water balance model which takes account of water supply (precipitation), demand (evapotranspiration) and loss (runoff) (Palmer, 1965; Dai et al., 2004). The PDSI records usually show strong association with tree-ring chronologies, especially in arid and semiarid regions. The nearby self-calibrating PDSI (scPDSI) grid data (43.75°N, 118.75°E) (Dai et al., 2011) since 1946 AD, before which there were many missing values, were used in this study.

2.3 Statistical analysis

Pearson correlation analysis was performed to examine the relationship between the STD chronology and climatic data. The stability and reliability of the reconstruction was validated by the split calibration-verification method (Meko and Graybill, 1995). Various statistical parameters, for example, sign test (ST), reduction of error (RE) and coefficient of efficiency (CE), were employed to evaluate the transfer function performance. Positive values of the RE and CE usually denote acceptable model skill (Cook et al., 1999). A spatial correlation analysis was conducted to evaluate the regional representativeness of Lama PDSI reconstruction using the University Corporation for Atmospheric Research (UCAR) scPDSI dataset (http://climexp.knmi.nl).

3 Results and discussion

3.1 Climate response

The calculations indicate that the Lama STD chronology is negatively correlated with temperature and positively correlated with precipitation in most months. This climate-growth pattern is typical in semiarid regions of China and has been found in a number of dendroclimatological studies (Fang et al., 2010; Song et al., 2011; Mei et al., 2019). Significant correlations between the STD chronology and climatic factors, e.g., precipitation and temperature, mainly concentrated during May-July, which suggests that the hydrothermal conditions of the fast-growing season play important roles in radial growth (Figure 4a). After different combinations, the Lama STD chronology showed the highest correlation with the total precipitation from prior August to current July, r=0.593 (1953-2012, p<0.001), whereas May-June temperature showed the highest correlation with tree-ring series r=-0.549 (1953-2012, p<0.001) (Figure 4a).
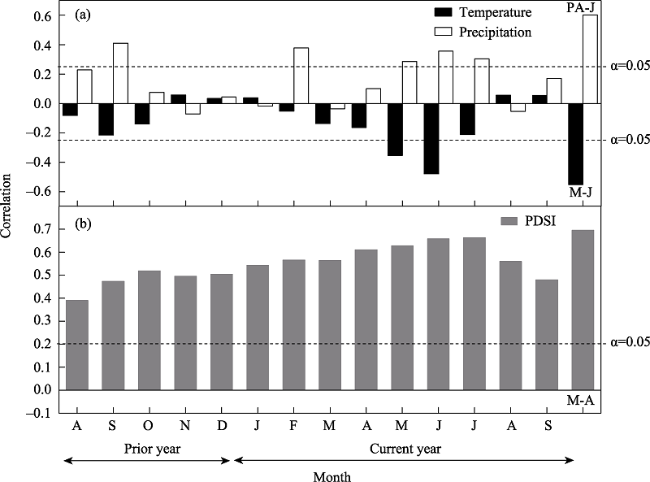
Figure 4 Correlations between Lama STD chronology and the monthly mean temperature and total precipitation during 1953-2012 (a), and the grid PDSI data during 1946-2012 (b)
The monthly PDSI and Lama STD chronology are highly correlated from prior August to current September (Figure 4b). PDSI series are calculated based on observed precipitation and temperature records, and thus it can represent soil moisture (Palmer, 1965). During the growing season in our study region, drought events are usually caused by low precipitation and high temperature, which can further increase soil water evaporation. Severe water stress can lead to tree growth decline and even mortality. After comparing various combinations of different climatic factors, the Lama STD chronology showed the highest correlation with May-August mean PDSI r=0.695 (1946-2012, p<0.001).

3.2 Drought reconstruction for Mt. Lama

The local May-August PDSI was reconstructed by using the STD chronology from Mt. Lama. The transfer function is as follows:
PDSI58=3.926Wt-4.9056
(n=67; r=0.695; R2=48.0%; R2adj=47.2%; D/W=1.091; p<0.001).
PDSI58 is the mean PDSI during May-August, Wt represents the Lama STD chronology in year t. The reconstruction function explains 47.2% of the actual PDSI changes between 1946 and 2012. The statistics of split calibration-verification analysis (Table 1), e.g., positive values of RE and CE, demonstrate the reliability and stability of the transfer function over time. Therefore, the May to August PDSI for Mt. Lama was reconstructed from 1710 to 2012 (Figure 5). The reconstructed PDSI58 shows similar variation to the actual PDSI records at high and low frequencies (Figure 5).
Table 1 Statistics for a split calibration-verification procedure
Calibration Verification
Period r R2 ST Period r R2 RE CE ST t
1946-1975 0.629** 0.396 20 1976-2012 0.719** 0.517 0.447 0.049 17 5.847**
1983-2012 0.752** 0.565 23 1946-1982 0.623** 0.389 0.430 0.011 26 5.829**
1946-2012 0.693** 0.480 50

Note: ** represents p < 0.001.

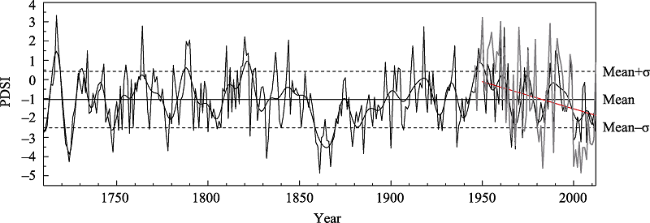
Figure 5 Reconstructed PDSI58 for Mt. Lama during 1710-2012 (black line) and the observed PDSI58 during 1946-2012 (gray line) (the smoothed line denotes a 10-year low-pass filter of the reconstruction)

3.3 Characteristics of drought variability on Mt. Lama

Our PDSI reconstruction displays the drought variations on Mt. Lama at the annual to decadal scales. To assess the occurrence of drought events, we defined drought years as PDSI values below -2.50 (mean-1σ), and wet years as PDSI values higher than 0.43 (mean+1σ). There have been nine dry years since the 1950s, which accounted for 18.4% of the total 49 dry years, indicating an increase in drought intensity during recent years. The ten most severe drought events occurred in 1861, 1867, 1724, 1832, 1885, 1748, 1778, 1968, 1900, and 1723. The worst drought in 1861 has rarely been reported in previous studies but was found in a nearby tree-ring record (Liu et al., 2011) and regional historical documents, such as in Inner Mongolia, Hebei and Shanxi (Wen, 2008), implying that it may be a regional drought event. The late 1920s drought, the worst drought in northwestern and northern China (Liang et al., 2006; Liu et al., 2020), is not prominent on Mt. Lama. The 1900 drought is widely discovered in tree-ring records in northern China (Liu et al., 2017; Mei et al., 2019) but is not found in northwestern China (Liu et al., 2013). All these comparisons demonstrate the spatial heterogeneity of annual hydroclimate variability.
On the decadal scale, the reconstructed drought series displays an obvious drying tendency since the 1950s, which has been found in a number of tree-ring hydroclimate reconstructions in northern China (Li et al., 2006; Liu et al., 2020). The increase in anthropogenic sulfate aerosols has been proven to be related to the drying trend in the northwestern marginal area of the EASM (Liu et al., 2019). The Yellow River, the longest in northern China, also showed an unprecedented decreasing since the 1970s, which was attributed to the decreasing of the Asian monsoon precipitation and increasing of anthropogenic water consumption especially the agricultural irrigation (Liu et al., 2020). Summer heatwave and soil moisture reconstruction over inner East Asia showed that the severe drought conditions would continue in the future (Zhang et al., 2019), which should be paid more attention by scientists and governments. The most severe drought of the reconstructed series occurred during the 1860s with a duration of 8 years, which has been identified by other tree-ring series in the northern marginal region of EASM, such as in Chifeng-Weichang (Liu et al., 2010), Kalaqin (Liu et al., 2011) and Lamadong in Inner Mongolia (Liu et al., 2017). The association among them reflects the synchronous hydroclimate variability over the northern marginal region of the EASM.

3.4 Regional representativeness

The annual precipitation variability has been reconstructed based on STD chronology at Kalaqin (Liu et al., 2011) which is approximately 100 km from Mt. Lama. The two hydroclimate records show good similarity at annual to decadal scales (Figure 6). The annual correlation between them was significant, with r=0.68 (n=238, p<0.001). This comparison not only verified our drought reconstruction, but also reflected coherent hydroclimatic variability, which was attributed to the influence of the EASM. Consistent spatial correlation patterns (Figure 7) were revealed by the grid data and the PDSI reconstruction, indicating the Lama PDSI reconstruction can represent the drought variability on the northernmost margin of the EASM. Spatial correlation suggested no obvious relationships between Lama drought reconstructions and the western margin of the EASM, implying different hydroclimatic factors on the northern and western margins of the EASM.
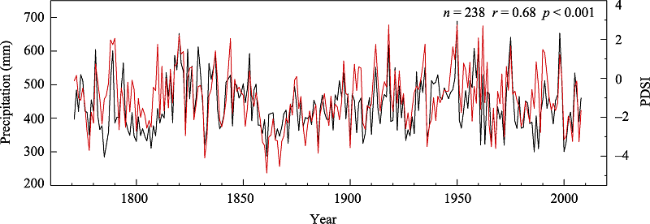
Figure 6 Correlation between our reconstructed PDSI58 (red line) and precipitation in Kalaqin (black line)
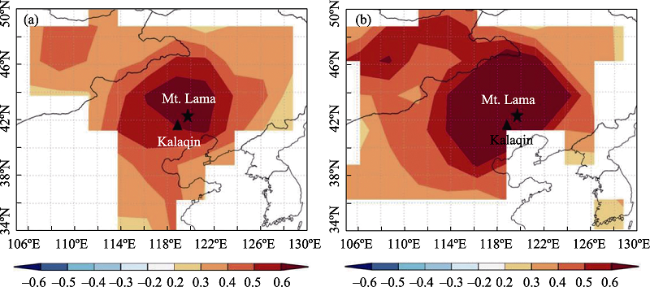
Figure 7 Spatial correlations between our reconstructed PDSI58 (a) and observed PDSI58 (b) with the grid scPDSI data of Dai et al. (2011) during 1946-2012

3.5 Possible driving factors

The observed climatic data in our study region show that June-August precipitation ac counts for 69% of yearly precipitation, which is strongly related to EASM. A significant correlation was found between our drought reconstruction and July-September EASM index (Zhao et al., 2015), with r=0.46 (n=65, p<0.001) (Figure 8). However, some inconsistencies were also found, which means that the existing EASM index cannot fully capture the annual hydroclimate variability in the northern marginal region of the EASM. The EASM usually breaks out in the central Indochina Peninsula in late April or early May, then gradually advances northward, and finally arrives at the northernmost position, our study region, in July (Wang and Lin, 2002). The strength of the EASM in different stages is not consistent. Most EASM indexes reflect precipitation variability in southern China, especially the Mei-yu-Changma-Bai-u area (Zhao et al., 2015), and are not suitable to represent the monsoon strength in the marginal region of the EASM. More effort should be made to reconstruct EASM indexes specifically aimed at the EASM marginal region, which is frequently affected by droughts.
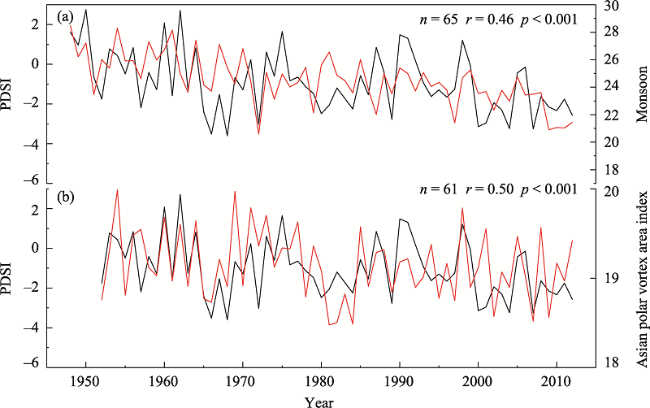
Figure 8 Correlation between reconstructed PDSI (black line) with summer monsoon (a) (June to September) and the Asian polar vortex area index (b) (last November to January) (red line)
A significant positive correlation was shown between our PDSI reconstruction for Mt. Lama and the Asian polar vortex area index during the period of the prior November to the current January, with r=0.50 (n=61, p<0.001) (Figure 8). The comparison (Figure 8) indicates that the large Asian polar vortex area in winter may be related to humid summers in the northern marginal region of the EASM, and vice versa. A previous study also found that the winter polar vortex strongly influenced the precipitation variability over northern China in summer (Huang et al., 2004). The polar vortex is a planetary-scale cyclone around both poles in the middle or high latitudes (Zhu et al., 2018), and usually shows close relationship with the Arctic Oscillation (AO), particularly during winter (Deng et al., 2006; Wu et al., 2008). The winter AO/North Arctic Oscillation (NAO)-forced wave train propagates eastward and strongly influences precipitation over East Asia in summer (Sung et al., 2006), which is a kind of Eurasian teleconnection pattern (EU). The negative EU pattern is accompanied with a blocking event and strong polar vortex which will lead to a strong western Pacific subtropical high and low summer precipitation in northern China (Zhao et al., 2016). Studies have revealed a weakening trend of polar vortex caused by the melting of arctic sea ice in recent decades (Zhang et al., 2016), which will exert strong influence on the precipitation variability in China.

4 Conclusions

The Chinese pine ring-width chronology from Mt. Lama, China, in the northern marginal region of the EASM, was used to reconstruct local May-August PDSI in the past 303 years. The transfer function explains 48.0% of the variance during the calibration period from 1946 to 2012. The reconstructed drought series displays a noticeable drying trend since the 1950s, which could be caused by the increase in anthropogenic sulfate aerosols. Our PDSI reconstruction showed a significant correlation with a nearby tree-ring-based precipitation reconstruction, suggesting a common influence of the EASM. Spatial correlation analysis indicates that the Lama May-August PDSI reconstruction can represent the drought variability on the northernmost margin of the EASM. The EASM and Asian polar vortex area index exert strong influences on the drought variabilities over the northern marginal region of the EASM.
[1]
Cheng D L, 2001. Drought and drought relief in 2000. China Flood & Drought Management, (1): 30-35. (in Chinese)

[2]
Cook E R, Kairiukstis L A, 1990. Methods of Dendrochronology: Applications in the Environmental Sciences. Dordrecht: Kluwer Academic Publishers, 394pp.

[3]
Cook E R, Meko D M, Stahle D W et al., 1999. Drought reconstructions for the continental United States. Journal of Climate, 12(4): 1145-1162.

DOI

[4]
Dai A G, 2011. Characteristics and trends in various forms of the Palmer Drought Severity Index during 1900-2008. Journal of Geophysical Research Atmospheres, 116(D12): doi: 10.1029/2010JD015541.

[5]
Dai A G, Trenberth K E, Qian T, 2004. A global dataset of Palmer drought severity index for 1870-2002: Relationship with soil moisture and effects of surface warming. Journal of Geophysical Research Atmospheres, 5(6): 1117-1130.

[6]
Deng W T, Sun Z B. 2006. Variational analysis of Arctic Oscillation and polar vortex in winter. Transactions of Atmospheric Sciences, 29(5): 613-619. (in Chinese)

[7]
Fang K Y, Gou X H, Chen F H et al., 2010. Tree‐ring based drought reconstruction for Guiqing Mountain (China): Linkage to the Indian and Pacific Oceans. International Journal of Climatology, 30(8): 1137-1145.

DOI

[8]
Huang J Y, Liu G, Zhao X Y. 2004. Effects of subtropical and polar vortex factors on summer precipitation in China. Chinese Journal of Atmospheric Sciences, 28(4): 517-526. (in Chinese)

[9]
Holmes R L, 1983. Computer-assisted quality control in tree-ring dating and measurement. Tree-Ring Bulletin, 43: 69-78.

[10]
Li M S, Li S, Li Y H, 2003. Analysis of drought disasters in China in the past 50 years. Chinese Agricultural Meteorology, 24(1): 8-11. (in Chinese)

[11]
Li Q, Liu Y, Cai Q F et al., 2006. Reconstruction of annual precipitation since 1686A.D. from Ningwu region, Shanxi province. Quaternary Sciences, 26(6): 999-1006. (in Chinese)

[12]
Liang E Y, Liu X H, Yuan Y J et al., 2006. The 1920s drought recorded by tree rings and historical documents in the semi-arid and arid areas of northern China. Climatic Change, 79(3/4): 403-432.

DOI

[13]
Liang E Y, Shao X M, Liu H Y et al., 2007. Tree-ring based PDSI reconstruction since AD 1842 in the Ortindag Sand Land, east Inner Mongolia. Chinese Science Bulletin, 52(19): 2715-2721.

DOI

[14]
Liu Y, Cai W J, Sun C F et al., 2019. Anthropogenic aerosols cause recent pronounced weakening of Asian summer monsoon relative to last four centuries. Geophysical Research Letters, 46(10): 5469-5479.

DOI

[15]
Liu Y, Lei Y, Sun B et al., 2013. Annual precipitation in Liancheng, China, since 1777AD derived from tree rings of Chinese pine (Pinus tabulaeformis Carr.) International Journal of Biometeorology, 57(6): 927-934.

DOI PMID

[16]
Liu Y, Song H M, An Z S et al., 2020. Recent anthropogenic curtailing of Yellow River runoff and sediment load is unprecedented over the past 500 y. Proceedings of the National Academy of Sciences, 117(31): 201922349.

[17]
Liu Y, Tian H, Song H M et al., 2010. Tree-ring precipitation reconstruction in the Chifeng-Weichang region, China, and East Asian summer monsoon variation since AD 1777. Journal of Geophysical Research, 115: D06103.

[18]
Liu Y, Wang C Y, Hao W J et al., 2011. Tree-ring-based annual precipitation reconstruction in Kalaqin, Inner Mongolia for the last 238 years. Chinese Science Bulletin, 56(28/29): 2995-3002.

DOI

[19]
Liu Y, Zhang X J, Song H M et al., 2017. Tree-ring-width-based PDSI reconstruction for central Inner Mongolia, China over the past 333 years. Climate Dynamics, 48(3/4): 867-879.

DOI

[20]
Mei R C, Song H M, Liu Y et al., 2019. Tree-ring width-based precipitation reconstruction in Zhaogaoguan, China since 1805 AD. Quaternary International, 510(2019): 44-51.

DOI

[21]
Meko D M, Graybill D A, 1995. Tree-ring reconstruction of Upper Gila River discharge. Water Resources Bulletin, 31(4): 605-616.

DOI

[22]
Palmer W C, 1965. Meteorological drought. Washington, DC: US Department of Commerce, 45.

[23]
Song H M, Liu Y, 2011. PDSI variations at Kongtong Mountain, China, inferred from a 283-year Pinus tabulaeformis ring width chronology. Journal of Geophysical Research: Atmospheres, 116(22): doi: 10.1029/2011JD016220.

[24]
Sung M K, Kwon W T, Baek H J et al., 2006. A possible impact of the North Atlantic Oscillation on the East Asian summer monsoon precipitation. Geophysical Research Letters, 33: L21713. doi: 10.1029/2006GL027253.

DOI

[25]
Stokes M A, Smiley T L, 1968. An Introduction to Tree Ring Dating. Chicago: The University of Chicago Press.

[26]
Wang B, Lin H, 2002. Rainy season of the Asian-Pacific summer monsoon. Journal of Climate, 15(4): 386-398.

DOI

[27]
Wang H J, Sun J Q, Chen H P et al., 2012. Extreme climate in China: Facts, simulation and projection. Meteorologische Ztschrift, 21(3): 279-304.

[28]
Wang Z M, He L J, 2015. Impact of climate change on agricultural meteorology and pests and diseases in Jianping County. China Agricultural Information, 16: 79-80. (in Chinese)

[29]
Wen K G, 2008. Chinese Meteorological Disaster:Inner Mongolia Volume. Beijing: China Meteorological Press, 384pp.

[30]
Wigley T M L, Briffa K R, Jones P D, 1984. On the average value of correlated time series, with applications in dendroclimatology and hydrometeorology. Journal of Climate and Applied Meteorology, 23(2): 201-213.

DOI

[31]
Wu B Y, Zhang R H, D'Arrigo R, 2008. Arctic dipole anomaly and summer rainfall in Northeast China. Chinese Science Bulletin, 53(14): 2222-2229.

[32]
Xu Y, Qian W H, 2003. Research on East Asian Summer Monsoon: A review. Acta Geographica Sinica, 58(Suppl.1): 138-146. (in Chinese)

[33]
Zhang J K, Tian W S, Chipperfield M P et al., 2016. Persistent shift of the Arctic polar vortex towards the Eurasian continent in recent decades. Nature Climate Change, 6(12): 1094-1099.

DOI

[34]
Zhang P, Jeong J H, Yoon J H et al., 2020. Abrupt shift to hotter and drier climate over inner East Asia beyond the tipping point. Science, 370(6520): 1095-1099.

DOI

[35]
Zhao G J, Huang G, Wu R G et al., 2015. A new upper-level circulation index for the East Asian Summer Monsoon variability. Journal of Climate, 28(24): 9977-9996.

DOI

[36]
Zhao J H, Yang L, Gu B H et al., 2016. On the relationship between the winter Eurasian teleconnection pattern and the following summer precipitation over China. Advances in Atmospheric Sciences, 33(6): 743-752.

DOI

[37]
Zhu X, Wei Z G, Dong W J et al., 2018. Possible influence of Asian polar vertex contraction on rainfall deficits in China in autumn. Dynamics of Atmospheres and Oceans, 82: 64-75. doi: 10.1016/j.dynatmoce.2018.04.001.

DOI

Outlines

/