Special Issue: Climate Change and Its Regional Response

Three modes of climate change since the Last Glacial Maximum in arid and semi-arid regions of the Asian continent

  • ZHANG Yuxin ,
  • LI Yu , *
Expand
  • Key Laboratory of Western China's Environmental Systems (Ministry of Education), College of Earth and Environmental Sciences, Center for Hydrologic Cycle and Water Resources in Arid Region, Lanzhou University, Lanzhou 730000, China
*Li Yu (1981-), PhD and Professor, specialized in paleoclimatic change. E-mail:

Zhang Yuxin (1996-), specialized in paleoclimatic change. E-mail:

Received date: 2021-04-02

  Accepted date: 2021-11-15

  Online published: 2022-04-25

Supported by

The National Natural Science Foundation of China(42077415)

The National Natural Science Foundation of China(41822708)

The Second Tibetan Plateau Scientific Expedition and Research Program(STEP)

The Second Tibetan Plateau Scientific Expedition and Research Program(2019QZKK0202)

The National Key Research and Development Program of China(2019YFC0507401)

The Strategic Priority Research Program of Chinese Academy of Sciences(XDA20100102)

The 111 Project(BP0618001)

Abstract

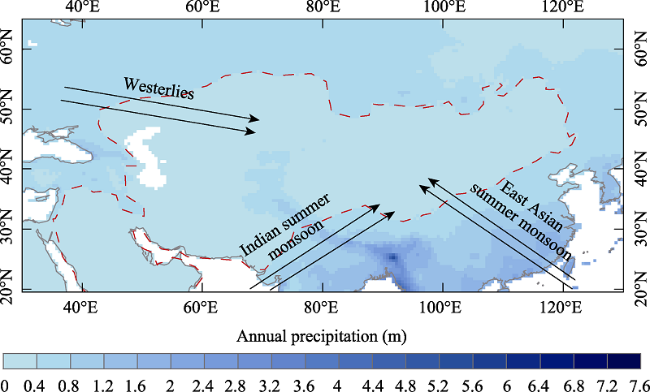
The westerly winds and East Asian summer monsoon play a leading role in climate change of southwestern North America and eastern Asia since the Last Glacial Maximum (LGM), respectively. Their convergence in arid and semi-arid regions of the Asian continent (AAC) makes the regional climate change more complicated on the millennial-scale. There are still limitations in applying paleoclimate records and climate simulations of characteristic periods to investigate climate change patterns since the LGM in this region. In this study, we adopt two indexes indicating effective moisture and rely on a continuous simulation, a time slice simulation, and numerous paleoclimate records to comprehensively investigate the climate change modes and their driving mechanisms since the LGM in AAC. Results demonstrate a millennial-scale climate differentiation phenomenon and three climate change modes possibly occurring in AAC since the LGM. The western AAC largely controlled by the westerly winds is featured as wet climates during the LGM but relatively dry climates during the mid-Holocene (MH), coinciding with the climate change mode in southwestern North America. Conversely, dry conditions during the LGM and relatively wet conditions during the MH are reflected in eastern AAC governed by the East Asian summer monsoon, which leans to the climate change mode in eastern Asia. If climate change in central AAC is forced by the interaction of two circulations, it expresses wet conditions in both the LGM and MH, tending to a combination of the southwestern North American and eastern Asian modes. Precipitation and evaporation exert different intensities in influencing three climate modes of different periods. Furthermore, we identify the significant driving effects of greenhouse gases and ice sheets on westerly-dominated zones of AAC, while orbit-driven insolation on monsoon-dominated zones of AAC.

Cite this article

ZHANG Yuxin , LI Yu . Three modes of climate change since the Last Glacial Maximum in arid and semi-arid regions of the Asian continent[J]. Journal of Geographical Sciences, 2022 , 32(2) : 195 -213 . DOI: 10.1007/s11442-022-1942-4

1 Introduction

Following the summer insolation variation of the Northern Hemisphere low-latitudes, the low-latitude monsoons are generally weak in the LGM and enhance during the early-to-mid Holocene (Kutzbach, 1981; COHMAP Members, 1988). The corresponding regional hydrological response is expressed as dry climates at the LGM and relatively wet climates at the MH in East Asian monsoon regions (Qin and Yu, 1998; Kohfeld and Harrison, 2000; Yanase and Abe-Ouchi, 2007; Herzschuh, 2006; Wang et al., 2017a). The westerly winds generally regulate the millennial-scale climate evolution of southwestern North America. Large ice sheets at high-latitudes of the Northern Hemisphere during the LGM force the southward displacement and intensification of the westerlies, bringing more precipitation to southwestern North America (COHMAP Members, 1988; Laîné et al., 2009; Wang et al., 2018), and then, retreated ice sheets in the MH lead the westerlies to move northward. Accordingly, southwestern North America is characterized by a wet climate at the LGM and a dry climate at the MH (Thompson and Anderson, 2000; Wanner et al., 2008; Lyle et al., 2012; Oster et al., 2015; Lowry and Morrill, 2019). The climate change modes driven by low-latitude monsoons and mid-latitude westerly winds are significantly different on the millennial-scale in eastern Asia and southwestern North America. However, the confluence of westerly winds and monsoons in AAC, makes the source of water vapor complex (Böhner, 2006; Li et al., 2008; Jin et al., 2012), triggering special attention over the millennial-scale climate change modes in this region (Li, 1990; Wu and Guo, 2000; Chen et al., 2008, 2019; An and Chen, 2009; Li et al., 2011).
In AAC, numerous paleoclimate records are proposed to investigate the millennial-scale climate change modes since the LGM. The reconstructed evolution of the water depth in Lake Luanhaizi based on macrofossil, pollen, biomarker, and isotope data indicates a dry condition during the LGM, but a relatively wet condition resulted from the stronger summer monsoon in the MH (Herzschuh et al., 2005). Likewise, chronological and geomorphic evidence of shorelines in Qinghai Lake proves a lower lake elevation during the LGM than MH (Madsen et al., 2008). And the wet climate during the MH in Qinghai Lake could be linked to insolation-driven changes in the East Asian monsoon (Shen et al., 2005). The vegetation dominated by Chenopodiaceae that adapts well to the arid environment from 31.5 to 14.7 cal ka BP is an indicator of dry conditions in the Yili Valley of AAC (Zhao et al., 2013). The reconstructions of paleoclimate change at Lakes Balikun and Manas also support the dry climate during the LGM in AAC (Rhodes et al., 1996; An et al., 2013). Whereas, the lacustrine sediments of drill cores from Aydin Lake and Lop Nur document the high lake status and wet climate during the LGM, which is against the above conventional conclusions (Li et al., 1989; Luo et al., 2009). And the characteristics of higher lake level during the LGM and lower lake level during the MH in northwestern Asia are reflected in the comprehensive geological records compiled from mainland Asian lakes (Qin and Yu, 1998). Moreover, the LGM wet climate and the MH wet climate are simultaneously confirmed by the variation of pedogenic carbonate δ18O in the eolian sedimentary sequence of the Qilian Mountains (QL) (Li et al., 2020). Although those records indirectly reconstruct three climate change patterns in AAC to a certain extent by using proxies such as physical parameters, chemical parameters, or biological fossils that respond to climate change, some limitations still exist in speculating past climate change by using paleoclimate proxies which have inherent complexities (Tierney et al., 2020).
The direct simulation results of precipitation, temperature, wind speed, etc. provided by climate models can intuitively reflect climate change, but there are also uncertainties restricted by many factors (Tierney et al., 2020). The combination of paleoclimate records and simulations seems to be a better way to retrospect past climate change and investigate its driving mechanism. With the improvement of climate simulation system, various achievements of paleoclimate simulation have been made in the exploration of paleoclimate evolution and the interpretation of driving mechanism on paleoclimate change in Asia. Yu et al. (2003) applied paleoclimate simulations to explore the possible mechanisms of dry conditions in eastern China and wet conditions in western China during the LGM. On the basis of model experiments, the patterns with higher lake levels in western Central Asia and lower lake levels in monsoonal Asia at the LGM are identified by Li and Morrill (2013). The movement of the westerly jet stream revealed by paleoclimate models is considered as a trigger of the LGM wet climate in the northern Qinghai-Tibet Plateau (Li et al., 2020). The paleoclimate coupling models simulate a dry climate pattern in eastern Asia during the LGM, corresponding well with the paleoclimate reconstructions (Yanase and Abe-Ouchi, 2007). By performing the coupled climate simulations, the spatial differences in climate response over mid-latitude Central Asia and monsoonal Asia between the early, middle and late Holocene have also been thoroughly investigated (Li and Morrill, 2010; Jin et al. 2012). Existing studies mainly aim at climate simulations during the characteristic periods since the LGM, while lack continuous climate simulations. Therefore, conducting a continuous paleoclimate simulation and combining it with a time slice paleoclimate simulation and paleoclimate records, are of crucial significance to comprehensively reveal the millennial-scale climate change modes in AAC.
In this paper, we attempted to evaluate the millennial-scale climate evolution patterns in AAC since the LGM by carrying out a continuous climate simulation and a time slice climate simulation, by using two effective moisture indexes. Several paleoclimate records were used to validate simulation results. Moreover, the influencing factors and possible underlying physical mechanisms of these climate change modes were also discussed. In AAC which suffers severe water shortages, climate change should deserve more attention than that in other regions, and understanding the modes and mechanisms of its primitive hydroclimate change on the millennial-scale is essential for future climate projection and regional water management.

2 Materials and experimental design

2.1 Dataset of modern observation and paleoclimate models

As a widely used climate dataset, the Climatic Research Unit gridded Time Series version 4.03 dataset (CRU TS4.03) is created by the University of East Anglia and has a resolution of 0.5° latitude by 0.5° longitude. Except for Antarctica, this dataset contains ten meteorological variables and covers global land from 1901 to 2018, including mean 2 m temperature, diurnal 2 m temperature, precipitation rate, vapor pressure, wet days, cloud cover, frost days, minimum 2 m temperature, maximum 2 m temperature and potential evapotranspiration. All variables are derived by interpolating anomalies of monthly stations' observations using angular-distance weighting (ADW) (Harris et al., 2020). Here we selected the precipitation variable from the CRU TS4.03 dataset to determine the extent of AAC. Based on the annual precipitation between 1901 and 2018, areas with less than 400 mm (0.4 m) of precipitation in the Asian continent are simply classified as AAC (Wu et al., 2014), and this extent is further modified according to Feng and Fu (2013) (Figure 1).
Figure 1 Map showing the extent of AAC and dominant circulation systems
In recent years, datasets of the transient climate evolution over the past 21000 years (TraCE 21 ka) and the Paleoclimate Modelling Intercomparison Project Phase 3 (PMIP 3) are widely applied in paleoclimate simulations. The Community Climate System Model version 3 (CCSM 3) of the National Center for Atmospheric Research (NCAR) completes the TraCE 21 ka with a resolution of ~3.75° latitude by ~3.75° longitude (He, 2011). This project not only provides the full forcings transient simulation but also four single-forcing transient simulations that consist of only orbitally-driven insolation forcing, only atmospheric greenhouse gas forcing, only ice sheets forcing and only meltwater fluxes forcing, which makes great contributions to paleoclimate research around the world (He et al., 2013; Cheng et al., 2014; Liu et al., 2014; Zhang et al., 2020a). The PMIP project has gone through three phases since its implementation, and the fourth stage is being carried out. There are 25 coupled climate models in PMIP 3, providing abundant simulation data for paleoclimate research (Jin and Otto-Bliesner, 2009). Although these models are constructed differently and have different spatial resolutions, they have all been forced by identical boundary conditions (Table 1) (Kohfeld and Harrison, 2000). Both single model and multi-model ensembles are often employed in paleoclimate simulation of Asia (Jiang and Lang, 2010; Jin et al., 2012; Li et al., 2018, 2020). Generally, the equally-weighted average of several models is more in line with observations than any single model (Lambert and Boer, 2001). However, if one of the models has an extreme value at a certain grid, then the average value will be affected by the extreme value and become larger or smaller. To eliminate the influence of extreme value in models, more and more researchers are inclined to use the median of multiple models for their simulations (Wehrli et al., 2018; Li et al., 2020).
Table 1 Boundary conditions for PMIP 3 models at the LGM and MH
Boundary conditions Last Glacial Maximum Mid-Holocene
Eccentricity 0.018994 0.018682
Obliquity (°) 22.949° 24.105°
Longitude of perihelion (°) 114.42° 0.87°
CO2 (ppm) 185 280
CH4 (ppb) 350 650
N2O (ppb) 200 270
Ice sheet Peltier (2004) 21 ka Peltier (2004) 0 ka
Vegetation Present-day Present-day
In TraCE 21 ka, we used the datasets of full forcings and four single forcings to simulate continuous climate change of AAC and investigated its possible driving mechanism since the LGM. Meanwhile, multi-models of CNRM-CM5, CCSM4, MIROC-ESM, GISS-E2-R, MPI-ESM-P, and MRI-CGCM3 from PMIP 3 were chosen to perform time slice paleoclimate simulation of LGM and MH (Table 2). Due to the different resolutions of PMIP 3 models, we preprocessed the datasets with a unified resolution of 0.5°×0.5° and selected median values of 6 models.
Table 2 Details of used PMIP 3 models
Model name Grid number (lon×lat) Levels Resolution (lon °) Resolution (lat °)
CNRM-CM5 256×128 17 1.40625 1.40625
CCSM4 288×192 17 1.25 0.9375
MIROC-ESM 128×64 35 2.8125 2.8125
GISS-E2-R 144×90 17 2.5 2
MPI-ESM-P 192×96 25 1.875 1.875
MRI-CGCM3 320×160 23 1.125 1.125

2.2 Virtual lake simulation and P-E simulation

By assuming that each grid cell is a freshwater lake with 1 m depth, we constructed virtual lake systems rather than actual lakes and calculated virtual lake evaporation using a one-dimensional energy balance model based on Hostetler and Bartlein's model (1990). The energy balance of lake surface is not only regulated by the lake evaporation but also by the shortwave and longwave radiation absorbed by the water surface, longwave radiation emitted by the water surface and sensible heat flux. Therefore, variables of air temperature, surface temperature, wind speed, longwave radiation and shortwave radiation from the TraCE model are input into the lake energy balance model to achieve the calculation of lake evaporation, and we set decade time step for running the lake energy balance model. A detailed description of this model is shown in Li and Morrill (2010) of which the results prove that this model performs well in simulating paleo-hydrological change in Asia.
After calculating lake evaporation, the evaporation and variables of precipitation and runoff from the TraCE model are all incorporated into the lake water balance model to determine the changing direction of virtual lake level. The lake water balance model with steady-state conditions of climate is described as follows (Li and Morrill, 2010):
$D={{A}_{B}}R+{{A}_{L}}({{P}_{L}}-{{E}_{L}})$
where D is discharge from the lake (m3/year), AB and AL are watershed area (m2) and lake area (m2), R is runoff from the drainage basin (m/year), PL is on-lake precipitation (m/year) and EL is lake evaporation (m/year). For a hypothetical lake, it is necessary to determine the value of AB and AL so that the process of lake level change cannot be calculated well. We thus regarded grid cells of ${{P}_{L}}-{{E}_{L}}\ge 0$as open lakes (D>0) which regulate the water balance through the discharge of lake water (Equation 1). And the grid cells of ${{P}_{L}}-{{E}_{L}}<0$ are identified as closed lakes (D=0) of which the net loss of lake water is compensated by runoff into the lake, and these grid cells adjust to water balance change by changing the ratio of AL to AB, as shown in Equation 2.
${{A}_{L}}/{{A}_{B}}=R/\left( {{E}_{L}}-{{P}_{L}} \right)$
where AL/AB represents lake level. The direction of continuous virtual lake level change is considered as an index of effective moisture change in AAC. Besides, variables of precipitation and evaporation from PMIP 3 models are used to perform precipitation minus evaporation simulations (P-E), which can be considered as another index evaluating the hydroclimate change of AAC at the millennial-scale.

2.3 Paleoclimate records and lake status database

Numerous paleoclimate records from the published literature have been compiled in this study to explore climate change in AAC among the LGM and MH in conjunction with paleoclimate simulations. When selecting records, these records must first have a reliable chronology, and then be able to indicate moisture changes, and have available data during the LGM and MH. After using the interpolation method to unify the selected records into a 10-year resolution, the mean value of LGM does subtraction with that of MH is used to determine the moisture anomaly between the LGM and MH. We also added some lake level records during the LGM and MH from the Global Lake Status Data Base (GLSDB) (Kohfeld and Harrison, 2000; Harrison et al., 2003) to enrich our study (Table 3).
Table 3 Wet/dry climate status of LGM relative to MH
Records name Latitude Longitude Record status Proxies used References
Hajar mountains 22.83 59 Dry Sedimentation rates Fuchs et al., 2008
Huguang Maar Lake 21.15 110.28 Dry Water content Mingram et al., 2004
Gutian peat 26.09 110.37 Dry δ13Corg Man et al., 2016
Lake Caohai 27 104.67 Dry δ13C Lin and Wei, 2000
Qilu Hu 24.18 102.75 Dry CaCO3 Hodell et al., 1999
Lake Tianchi 25.87 99.27 Dry C/N Jiang et al., 2019
Lake Ximencuo 33.38 101.1 Dry Pollen Herzschuh et al., 2014
Lake Kuhai 35.3 99.2 Dry Pollen Wischnewski et al., 2011
Qinghai Lake 36.53 99.6 Dry Carbonate Madsen et al., 2008
Sanjiaocheng 38.2 103.34 Dry TOC Zhang et al., 2004
Xiaogou 36 105 Dry TOC Wu et al., 2009
Xunyi Loess 35.72 109.42 Dry δ13C Lu et al., 2013
Luochuan loess deposits 35.03 108.22 Dry δ13C Lu et al., 2013
Hala Lake 38.2 97.4 Dry OM Yan and Wünnemann, 2014
Hovsgol Lake 50.54 101.16 Dry Lake level Murakami et al., 2010
Achit Nuur 49.42 90.52 Wet MAP Sun et al., 2013
Karakul Lake 39.02 73.53 Dry Sediments Heinecke et al., 2017
Zabuye Lake 31.35 84.07 Wet δ18OCarb Wang et al., 2002
Van Lake 38.5 43 Dry TIC Öğretmen, 2012
Yitang Lake 40.3 94.97 Dry δ13C Zhao et al., 2015
Luanhaizi 37.59 101.35 Dry Pollen Herzschuh et al., 2005
Lop Nur 40.78 91.05 Wet Grain size Luo et al., 2009
Aydin 42.53 89.17 Wet Sediments Li et al., 1989
Lake Manas 45.75 86 Dry Pollen Rhodes et al., 1996
Balikun Lake 43.7 92.8 Dry / GLSDB
Bangge Lake 31.75 89.57 Wet / GLSDB
Beysehir 37.75 31.5 Wet / GLSDB
Dachaidan-Xiaochaidan salt lakes 37.5 95.37 Wet / GLSDB
Erhai 25.84 99.98 Wet / GLSDB
Ioannina 39.66 20.88 Wet / GLSDB
Konya 37.5 33 Wet / GLSDB
Manxing Lake 22 100.6 Dry / GLSDB
Zeribar 35.53 46.12 Wet / GLSDB
Zhacang Caka 32.6 82.38 Wet / GLSDB

2.4 Relevant mathematical analysis methods

Other mathematical methods have been applied in this study. The linear trend estimation and running average methods are selected to measure the variation degree of the century-scale precipitation and millennial-scale effective moisture changes in AAC. The empirical orthogonal function method (EOF) which can analyze the structural features of the matrix data and extract the feature vectors of the main data is chosen to further decompose the spatial and temporal features of climate variation in AAC. Meanwhile, for studying the driving mechanism of climate change in AAC, the Pearson correlation coefficient method is used to calculate the correlation between the full forced effective moisture simulation and the four single-factor forced effective moisture simulation.

3 Results

3.1 Characteristics of modern precipitation in AAC

Here we only analyzed the spatio-temporal variations of summer and annual precipitation from 1901 to 2018. An overall upward trend is detected in the annual precipitation during the study period in AAC (Figure 2a), which is in agreement with the phenomenon of climatic humidification in northwestern China in recent years (Shi et al., 2007). Even though the changing trend of summer precipitation is roughly similar to that of annual precipitation, there are differences in westernmost AAC, indicating that summer precipitation contributes little to annual precipitation in westernmost AAC (Figure 2b). Besides the spatio-temporal variations of summer precipitation are explored using EOF analysis, which shows that summer precipitation presents significant spatial differences in AAC. Figure 2c reveals the spatial distribution of EOF decomposition modes of summer precipitation in AAC, and the variance contribution rate of EOF1 is 7.26. The positive values are mostly distributed in southern AAC while the negative values are mostly located in northeastern and northwestern AAC. In other words, the opposite pattern of summer precipitation variations on the interannual-scale possibly exhibits between northern and southern AAC. From the time series of EOF1 and its 9-year running average series (Figure 2d), this mode has obvious interannual variations. PCA1 of summer precipitation (1901-2018) is unstable with many turning points, exhibiting a low level during 1900-1930 and an increasing trend since 1990. Combined with variation of EOF1, these features suggest summer precipitation in southern AAC is relatively less in the early 20th century and obviously increases in the 21st century. The reverse situation has been obtained in northeastern and northwestern AAC.
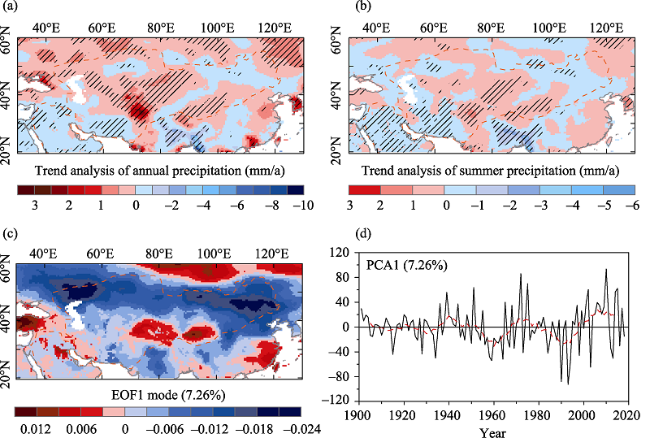
Figure 2 Variation of interannual precipitation in AAC during 1901-2018: (a) trend analysis of annual precipitation from 1901 to 2018; (b) trend analysis of summer precipitation from 1901 to 2018; (c) EOF1 spatial distribution of summer precipitation from 1901 to 2018; (d) time series of the principal components related to EOF1. Red (blue) colors in trend analysis represent the upward (downward) trend and the shadow areas are where the trends are statistically significant at 5% level.

3.2 Millennial-scale climate change modeling in AAC

Using virtual lake simulations controlled by various meteorological factors, we comprehensively simulated the millennial-scale evolution characteristics of effective moisture in AAC. Trend analysis of continuous effective moisture change since the LGM shows that there is a prominent spatial differentiation between eastern and central-western AAC (Figure 3a). The effective moisture of central-western AAC presents a downward trend since the LGM while that in eastern AAC is on the contrary. This differentiation phenomenon is correspondingly reflected in the spatial distribution of EOF1 (Figure 3b). As shown in temporal variations of the first principal component (Figure 3c), the significant turning point of effective moisture change appears around 11800 years before present, suggesting that the climate in central-western AAC is wetter during the LGM than that in the Holocene, while the climate in eastern AAC is drier at the LGM relative to Holocene. According to the atmospheric circulation systems of AAC, the eastern AAC is dominated by the East Asian summer monsoon and the western AAC is governed by the westerly winds. It is further speculated that this spatial differentiation may be related to the monsoon-dominated climate and westerly-dominated climate. To further clarify the feature of effective moisture change over time in AAC, we extracted the mean state of effective moisture evolution in westerly-dominated zones, monsoon-dominated zones, and their intersection zones from the spatial characteristics of EOF1. Because the intensity of the East Asian summer monsoon and westerly winds is constantly varying since the LGM, in fact, there is not a monsoon/westerly winds boundary as clear as the simulation suggests. Therefore, the range on both sides of the clear boundary shown in EOF1 is jointly defined as the intersection zones (Figure 3b). The effective moisture changes manifest that a period of wetter climate occurs at LGM in westerly-dominated zones, at MH in monsoon-dominated zones, and at both the LGM and MH in intersection zones (Figures 3d-3f). As the components regulating effective moisture, precipitation and lake evaporation are used to analyze the causes for effective moisture variation in three zones, where the time series of evaporation exhibit similar changing trends, i.e., the evaporation of LGM is weak and gradually strengthens from early to late Holocene. However, the precipitation in westerly-dominated zones shows a slightly higher level in LGM than in MH, thus, the higher moisture in the LGM relative to MH results from the combined effect of high precipitation and low evaporation. The effective moisture fluctuation in monsoon-dominated zones is highly consistent with precipitation variation, indicating that precipitation is the main cause controlling effective moisture variation in this region. The higher precipitation of intersection zones occurred in MH, which illustrates that high precipitation is responsible for the wet climate of MH while the wet climate of LGM can be attributed to low evaporation.
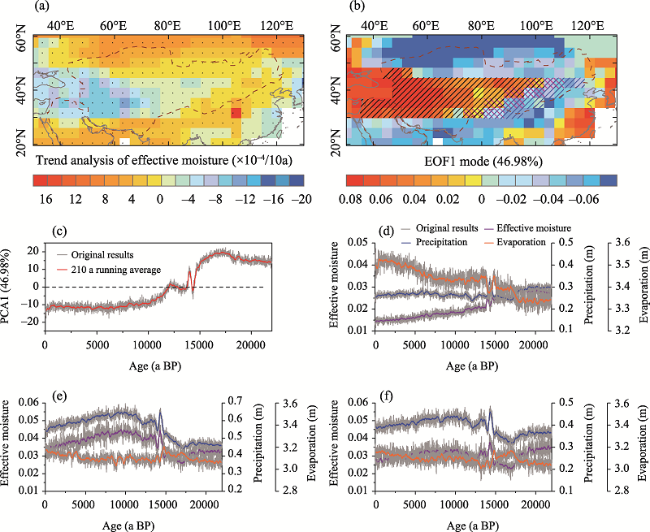
Figure 3 Spatio-temporal difference of effective moisture simulation in AAC since the LGM: (a) trend analysis of effective moisture change since the LGM; (b) EOF1 spatial distribution based on effective moisture since the LGM; (c) time series of the principal components related to EOF1; (d-f) time series of effective moisture (purple), precipitation (blue) and evaporation (orange) extracted from the westerly-dominated zones (black slant lines), monsoon-dominated zones (blue slant lines) and their intersection zones (red crosshatches), respectively. The gray line represents the calculated original values and the colored lines represent the 210-year average running series; red (blue) colors in trend analysis represent the upward (downward) trend and the dot areas are where the trends are statistically significant at 5% level.
To verify the climate change patterns in AAC reflected by the continuous effective moisture simulation, we used PMIP3 models to perform a time slice simulation of P-E between the LGM and MH, and combined with numerous paleoclimate records (Figure 4). The P-E simulations show a general climate differentiation between western AAC which is characterized by a wet climate during the LGM relative to MH, and central-eastern AAC which is featured as a dry climate during the LGM relative to MH. The boundary of climate differentiation in time slice simulation is more biased towards the western AAC than that in continuous sim-ulation. The records of AAC during the LGM also reproduce the regional difference of climate change, suggesting that most records indicating dry climate are concentrated in eastern AAC and most records indicating wet climate are situated in central AAC. The records display an easterly climate differentiation boundary, which is perhaps corresponded to that in continuous simulation. All in all, there is no doubt that a significant differentiation of climate change mode occurs between monsoon-dominated zones and westerly-dominated zones in AAC. It is worth noting that the regional distribution of monsoon-dominated zones and westerly-dominated zones in AAC is not absolute. Since the intensity of the East Asian summer monsoon and westerly winds is constantly changing on the millennial-scale, their intersection zones will be adjusted accordingly. On the whole, the eastern AAC is inclined to be dominated by the East Asian summer monsoon, the western AAC tends to be dominated by westerly winds, and the central AAC is likely to be affected by both circulation systems.
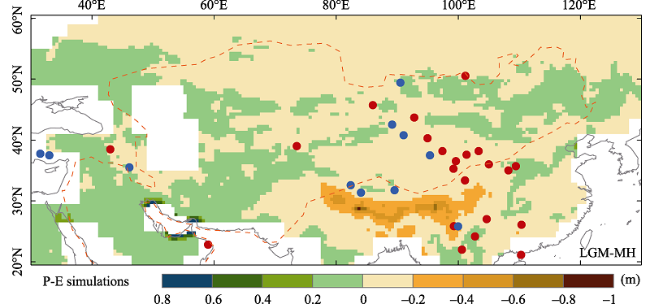
Figure 4 P-E simulations according to the PMIP 3 models. The blue (red) dots represent the wet (dry) climate at the LGM relative to MH, which is described in Table 3.

3.3 Possible driving mechanisms

We simulated the effective moisture evolution under four single forcings, including orbitally-driven insolation, greenhouse gases, ice sheets and meltwater fluxes, and identified the role of individual forces in influencing climate change in AAC. Under only orbitally-driven insolation, the simulated effective moisture shows an increased trend in most AAC, but a decreased trend around its southwestern part since the LGM (Figure 5a). The simulated effective moisture regulated only by greenhouse gas forcing suggests that most western AAC is in a downward trend which is opposite to that in eastern AAC since the LGM (Figure 5b). Driven only by ice sheets, a downward trend of simulated effective moisture displays in most AAC, and the upward trend only exists in a small part of northwestern AAC (Figure 5c). The effective moisture change driven only by the Northern Hemisphere meltwater fluxes forcing in AAC is on the rise since the LGM (Figure 5d).
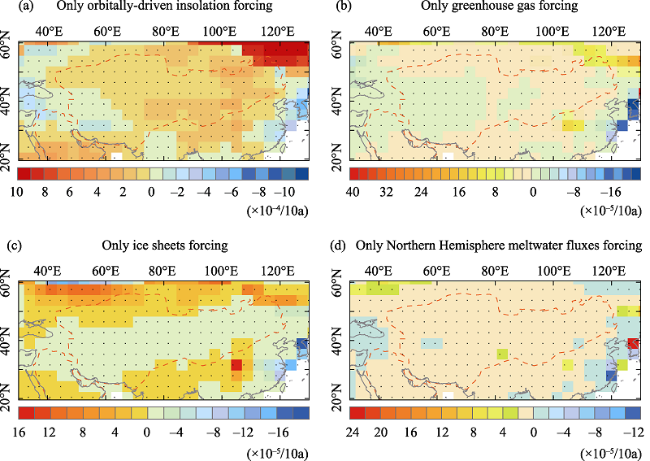
Figure 5 Trend analysis of effective moisture change under only orbitally-driven insolation forcing, only greenhouse gas forcing, only ice sheets forcing and only Northern Hemisphere meltwater fluxes forcing since the LGM. Red (blue) colors represent the upward (downward) trend and the dot areas are where the trends are statistically significant at 5% level.
To more intuitively explore the relationship between effective moisture change under four single forcings and full forcings, we conducted a spatial correlation analysis. A significant positive correlation of simulated effective moisture between under orbitally-driven insolation forcing and under full forcings is observed in eastern AAC (Figure 6a), which indicates that insolation forcing promotes the effective moisture evolution in eastern AAC. The effective moisture variation driven by greenhouse gas forcing has a prominent positive correlation with that driven by full forcings in western AAC, reflecting the strongly encouraged effect of greenhouse gas on the effective moisture evolution in this region (Figure 6b). From Figure 6c, ice sheets forcing also makes great contributions to effective moisture evolution in the same region. However, a very weak correlation between the effective moisture controlled by meltwater fluxes forcing and controlled by full forcings is found in AAC, which correspondingly indicates the weak influence of meltwater fluxes on effective moisture evolution (Figure 6d).
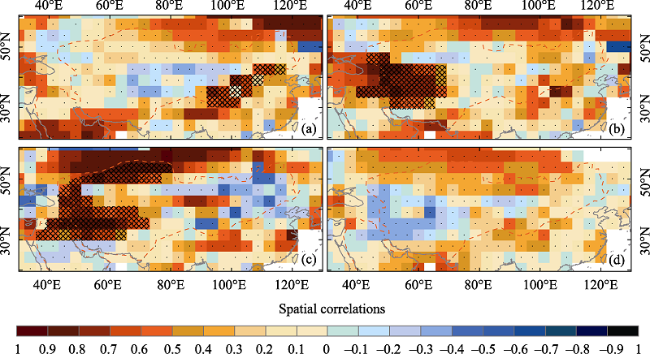
Figure 6 Spatial correlation analysis of effective moisture between full forcings and only orbitally-driven insolation forcing (a), only greenhouse gas forcing (b), only ice sheets forcing (c) and only Northern Hemisphere meltwater fluxes forcing (d). Red (blue) colors represent the positive correlation (negative correlation) and the crosshatches represent the regions with significant correlation, and dot areas are where the correlations are statistically significant at 5% level.

4 Discussion

Investigating the past climate evolution is key to confirming future climate change (Tierney et al., 2020). The LGM with larger ice sheets, lower greenhouse gas content and lower summer insolation is the period of the greatest contrast with modern times (Bereiter et al., 2015; Berger and Loutre, 1991; Sowers et al., 2003) (Figures 7a-7c). Even if the driving mechanism is different, the MH triggered by natural oriented astronomical climate forcing can be considered as an ideal analog of modern global warming which is closely linked to anthropogenic activities (Li et al., 2018). Consequently, studying paleoclimate change since the LGM, especially during the LGM and MH, is of great significance for assessing future hydroclimate changes.
Climate change responds differently to the East Asian summer monsoon and westerly winds which are two important components of atmospheric circulation systems in the Northern Hemisphere. Their confluence in AAC complicates the millennial-scale climate change which can be dominated by East Asian summer monsoon, or westerlies, or both. Lakes Lahontan, Surprise and Owens in southwestern North America are typically subject to the westerly winds of the Northern Hemisphere, and their records all present higher lake levels during the LGM and last deglaciation relative to MH (Briggs et al., 2005; Broecker et al., 2009; Ibarra et al., 2014; Bacon et al., 2006; Figures 7d-f). Compilations of sedimentological, biogeological and hydrological data from the Eurasian continent indicate that this phenomenon of high lake levels during the LGM also happens around circum-Mediterranean and Central Asia, forming a belt of wet climate from southwestern North America to Central Asia (Qin and Yu, 1998; Yu et al., 2000). It is therefore speculated that the climate change mode of regions dominated by the westerlies in AAC is consistent with that in southwestern North America. However, the moisture and precipitation curves synthesized from other multiple records reveal a dry climate at the LGM and a wet climate at the MH in AAC (Li et al., 2017; Herzschuh, 2006; Figures 7g-7h), which is biased toward the climate change mode of eastern Asia influenced by the East Asian summer monsoon (Yuan et al., 2004; Wang et al., 2017a). The millennial-scale differentiation of “monsoon” and “westerly” modes in northwest China was first proposed in the 1990s (Li, 1990). Until recently, the carbonate δ18O records from the QL aeolian sedimentary profile suggest the existence of wet climate in AAC not only during the LGM but also during the MH (Li et al., 2020; Figure 7i), which is possibly a combination of “monsoon” and “westerly” modes. The results of our continuous simulations match well with paleoclimate records mentioned above, confirming the three climate change modes since the LGM in AAC.
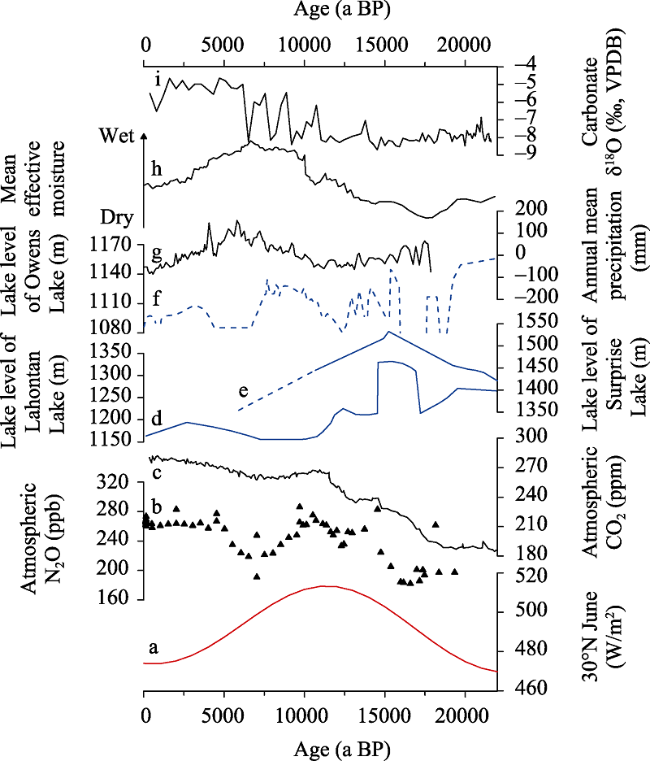
Figure 7 Global paleoclimate records: (a) The summer insolation at 30°N since the LGM (Berger and Loutre, 1991); (b) The N2O records in GISP2 and Taylor Dome ice core (Sowers et al., 2003); (c) the CO2 records in Antarctic ice cores (Bereiter et al., 2015); (d) lake level records from Lake Lahontan (Briggs et al., 2005; Broecker et al., 2009); (e) lake level records from Lake Surprise (Ibarra et al., 2014); (f) lake level records from Lake Owens (Bacon et al., 2006); (g) reconstruction of annual precipitation based on pollen data in Dalianhai and Qinghai lakes (Li et al., 2017); (h) reconstruction of mean effective moisture from monsoonal Central Asia (Herzschuh, 2006); (i) the carbonate δ18O records from the QL section (Li et al., 2020).
Researches on using paleoclimate simulation to identify the possible influencing factors of Asian climate change since the LGM have been carried out frequently. Li and Liu (2016) pointed out that the increased and decreased precipitation are respectively responsible for the higher lake level in western China and lower lake level in eastern China during the LGM than MH. Whereas, other research has reported that both decreased evaporation and increased precipitation contribute to the wet conditions in western China, and less summer precipitation results in the dry conditions in eastern China during the LGM (Yu et al., 2003). Likewise, simulations of Asian lake level change suggest the higher lake level in western Central Asia caused by low evaporation and high precipitation, and the lower lake level in
eastern Asia induced by less precipitation during the LGM (Li and Morrill, 2013). Comparison of climate change in the LGM relative to MH in Asian closed basins which are mainly located in the arid and semi-arid regions, also presents that a wetter climate around the western part is caused by a combination of evaporation and precipitation, and precipitation is the dominated factor leading to a drier climate around the eastern part (Zhang et al., 2020b). Anyway, it is widely accepted that in the LGM, the climate change mode of westerly-dominated zones results from the combined effect of high precipitation and low evaporation, while low precipitation plays a vital role in climate change mode of monsoon-dominated zones in AAC.
The change of meteorological elements is always closely related to the change of atmospheric circulations. From the perspective of paleoclimatology, the intensity and position of monsoons and westerly winds vary greatly between LGM and MH, induced by the primary forces such as solar insolation, greenhouse gas and continental ice sheets (Yuan et al., 2004; Oster et al., 2015; Sime et al., 2016; Wang et al., 2017b). During the LGM, the westerlies of the Northern Hemisphere shift southward and enhance as a result of the expanded continental ice sheets in high-latitudes, and more precipitation is taken into southwestern North America, circum-Mediterranean, and Central Asia (COHMAP Members, 1988; Yu et al., 2000; Wang et al., 2018). Meanwhile, the lower temperature associated with lower greenhouse gases generates a reduction of evaporation (Yu et al., 2000; Figures 7a-7c). Obviously, the forces of ice sheets and greenhouse gases exert significant influences on millennial-scale climate change in westerly-dominated zones of AAC, which is also embodied in our results (Figures 6b and 6c). The variation of summer insolation in low-latitudes is the primary force regulating the change of millennial-scale low-latitude summer monsoons (COHMAP Members, 1988; Yuan et al., 2004; Chen et al., 2008). The reduced difference in surface temperature and pressure between land and sea triggered by lower summer insolation during the LGM finally weakens the East Asian summer monsoon, further producing less summer precipitation, however, when entering the early-to-mid Holocene, the increased summer insolation strengthens the summer monsoons by amplifying regional sea-land thermal contrast, generating more water vapor (COHMAP Members, 1988). Similarly, it is apparent that the insolation force shows considerable connections with the climate change in monsoon-dominated zones of AAC (Figure 6a). These assessments provide some new perspectives to understand the modes and mechanisms of climate change over AAC, and remind us that addressing the challenges of future climate change should focus on the difference of primitive environments in AAC.

5 Conclusion

Based on a continuous simulation, a time slice simulation and numerous paleoclimate records, a systematic study was conducted in climate change modes of AAC since the LGM by using two effective moisture indexes. Both the continuous simulation, time slice simulation and records reveal the differentiation of millennial-scale climate change in AAC, suggesting three climate change modes possibly existing in AAC since the LGM. In western AAC, the climate evolution since the LGM is mainly regulated by millennial-scale westerly winds, which is characterized by wet climates during the LGM but relatively dry climates at the MH, more inclining to the climate change mode of southwestern North America. The opposite pattern with a dry condition in the LGM and a wet condition in the MH is captured in eastern AAC controlled by the East Asian summer monsoon, conforming to the mode of eastern Asia on the millennial-scale. If climate change in central AAC is influenced by the combined effect of two circulations, wet climates will appear in both the LGM and MH, tending to a combination of the southwestern North American and eastern Asian modes. The joint influence of precipitation and evaporation contributes to climate change mode in westerly-dominated zones, and precipitation is the key factor affecting climate change mode in monsoon-dominated zones. For their intersection zones, the major controlling factors of climate change vary in different periods. For various forces driving millennial-scale climate change, greenhouse gases and ice sheets play important roles in westerly-dominated zones of AAC, where orbit-driven insolation profoundly affects monsoon-dominated zones.
[1]
An C B, Chen F H, 2009. The pattern of Holocene climate change in the arid Central Asia: A case study based on lakes. Journal of Lake Sciences, 21(3): 329-334. (in Chinese)

DOI

[2]
An C B, Tao S C, Zhao J J et al., 2013. Late Quaternary (30.7-9.0 cal ka BP) vegetation history in Central Asia inferred from pollen records of Lake Balikun, northwest China. Journal of Paleolimnology, 49(2): 145-154.

DOI

[3]
Bacon S N, Burke R M, Pezzopane S K et al., 2006. Last Glacial Maximum and Holocene lake levels of Owens Lake, eastern California, USA. Quaternary Science Reviews, 25(11/12): 1264-1282.

DOI

[4]
Bereiter B, Eggleston S, Schmitt J et al., 2015. Revision of the EPICA Dome C CO2 record from 800 to 600 kyr before present. Geophysical Research Letters, 42(2): 542-549.

DOI

[5]
Berger A, Loutre M F, 1991. Insolation values for the climate of the last 10 million years. Quaternary Science Reviews, 10(4): 297-317.

DOI

[6]
Böhner J, 2006. General climatic controls and topoclimatic variations in central and high Asia. Boreas, 35(2): 279-295.

DOI

[7]
Briggs R W, Wesnousky S G, Adams K D, 2005. Late Pleistocene and late Holocene lake highstands in the Pyramid Lake subbasin of Lake Lahontan, Nevada, USA. Quaternary Research, 64(2): 257-263.

DOI

[8]
Broecker W S, McGee D, Adams K D et al., 2009. A Great Basin-wide dry episode during the first half of the Mystery Interval? Quaternary Science Reviews, 28(25/26): 2557-2563.

DOI

[9]
Chen F H, Chen J H, Huang W et al., 2019. Westerlies Asia and monsoonal Asia: Spatiotemporal differences in climate change and possible mechanisms on decadal to sub-orbital timescales. Earth-Science Reviews, 192: 337-354.

DOI

[10]
Chen F H, Yu Z C, Yang M L et al., 2008. Holocene moisture evolution in arid Central Asia and its out-of-phase relationship with Asian monsoon history. Quaternary Science Reviews, 27(3/4): 351-364.

DOI

[11]
Cheng J, Liu Z Y, He F et al., 2014. Model-proxy comparison for overshoot phenomenon of Atlantic thermohaline circulation at Bølling-Allerød. Chinese Science Bulletin, 59(33): 4510-4515.

DOI

[12]
COHMAP Members, 1988. Climate changes of the last 18,000 years: Observations and model simulations. Science, 241(4869): 1043-1052.

DOI

[13]
Feng S, Fu Q, 2013. Expansion of global drylands under a warming climate. Atmospheric Chemistry and Physics, 13(19): 10081-10094.

[14]
Fuchs M, Buerkert A, 2008. A 20 ka sediment record from the Hajar Mountain range in N-Oman, and its implication for detecting arid-humid periods on the southeastern Arabian Peninsula. Earth and Planetary Science Letters, 265(3/4): 546-558.

DOI

[15]
Harris I, Osborn T J, Jones P et al., 2020. Version 4 of the CRU TS monthly high-resolution gridded multivariate climate dataset. Scientific Data, 7(1): 109.

DOI PMID

[16]
Harrison S P, Kutzbach J E, Liu Z et al., 2003. Mid-Holocene climates of the Americas: A dynamical response to changed seasonality. Climate Dynamics, 20(7): 663-688.

DOI

[17]
He F, 2011. Simulating transient climate evolution of the Last Deglaciation with CCSM 3. Wisconsin: University of Wisconsin.

[18]
He F, Shakun J D, Clark P U et al., 2013. Northern Hemisphere forcing of Southern Hemisphere climate during the last deglaciation. Nature, 494(7435): 81-85.

DOI

[19]
Heinecke L, Mischke S, Adler K et al., 2017. Climatic and limnological changes at Lake Karakul (Tajikistan) during the last -29 cal ka. Journal of Paleolimnology, 58(3): 317-334.

DOI

[20]
Herzschuh U, 2006. Palaeo-moisture evolution in monsoonal Central Asia during the last 50,000 years. Quaternary Science Reviews 25(1/2): 163-178.

DOI

[21]
Herzschuh U, Borkowski J, Schewe J et al., 2014. Moisture-advection feedback supports strong early-to-mid Holocene monsoon climate on the eastern Tibetan Plateau as inferred from a pollen-based reconstruction. Palaeogeography, Palaeoclimatology, Palaeoecology, 402: 44-54.

DOI

[22]
Herzschuh U, Zhang C J, Mischke S et al., 2005. A late Quaternary lake record from the Qilian Mountains (NW China): Evolution of the primary production and the water depth reconstructed from macrofossil, pollen, biomarker, and isotope data. Global and Planetary Change, 46(1/4): 361-379.

DOI

[23]
Hodell D A, Brenner M, Kanfoush S L et al., 1999. Paleoclimate of southwestern China for the past 50,000 yr inferred from lake sediment records. Quaternary Research, 52(3): 369-380.

DOI

[24]
Hostetler S W, Bartlein P J, 1990. Simulation of lake evaporation with application to modeling lake level variations of Harney-Malheur Lake, Oregon. Water Resources Research, 26(10): 2603-2612.

[25]
Ibarra D E, Egger A E, Weaver K L et al., 2014. Rise and fall of Late Pleistocene pluvial lakes in response to reduced evaporation and precipitation: Evidence from Lake Surprise, California. Geological Society of America Bulletin, 126(11/12): 1387-1415.

DOI

[26]
Jiang D B, Lang X M, 2010. Last Glacial Maximum East Asian monsoon: Results of PMIP simulations. Journal of Climate, 23(18): 5030-5038.

DOI

[27]
Jiang W Y, Leroy S A G, Yang S L et al., 2019. Synchronous strengthening of the Indian and East Asian monsoons in response to global warming since the Last Deglaciation. Geophysical Research Letters, 46(7): 3944-3952.

DOI

[28]
Jin L Y, Chen F H, Morrill C et al., 2012. Causes of early Holocene desertification in arid central Asia. Climate Dynamics, 38(7/8): 1577-1591.

DOI

[29]
Jin L Y, Otto-Bliesner B L, 2009. Advances of PMIP in the last 10 years and its key themes of future research plan. Quaternary Sciences, 29(6): 1015-1024. (in Chinese)

[30]
Kohfeld K E, Harrison S P, 2000. How well can we simulate past climates? Evaluating the models using global palaeoenvironmental datasets. Quaternary Science Reviews, 19(1/5): 321-346.

DOI

[31]
Kutzbach J E, 1981. Monsoon climate of the early Holocene: Climate experiment with the earth's orbital parameters for 9000 years ago. Science, 214(4516): 59-61.

PMID

[32]
Laîné A, Kageyama M, Salas-Mélia D et al., 2009. Northern Hemisphere storm tracks during the Last Glacial Maximum in the PMIP2 ocean-atmosphere coupled models: Energetic study, seasonal cycle, precipitation. Climate Dynamic, 32(5): 593-614.

DOI

[33]
Lambert S J, Boer G J, 2001. CMIP1 evaluation and intercomparison of coupled climate models. Climate Dynamics, 17(2): 83-106.

DOI

[34]
Li B X, Cai B Q, Liang Q S, 1989. The characteristics of lacustrine sediments in Aydin Lake, Turpan Basin, Xinjiang, China. Chinese Science Bulletin, (8): 608-610. (in Chinese)

[35]
Li J J, 1990. The pattern of environmental changes since Late Pleistocene in northwestern China. Quaternary Sciences, (3): 197-204. (in Chinese)

[36]
Li J Y, Dodson J, Hong Y et al., 2017. Quantitative precipitation estimates for the northeastern Qinghai-Tibetan Plateau over the last 18,000 years. Journal of Geophysical Research Atmosphere, 122(10): 5132-5143.

[37]
Li W L, Wang K L, Fu S M et al., 2008. The interrelationship between regional westerly index and the water vapor budget in northwest China. Journal of Glaciology and Geocryology, 30(1): 28-34. (in Chinese)

[38]
Li Y, Liu Y, 2016. The response of lake records to the circulation system and climate zones in China since the Last Glacial Maximum. Acta Geographica Sinica, 71(11): 1898-1910. (in Chinese)

[39]
Li Y, Liu Y, Ye W T et al., 2018. A new assessment of modern climate change, China: An approach based on paleo-climate. Earth-Science Reviews, 177: 458-477.

DOI

[40]
Li Y, Morrill C, 2010. Multiple factors causing Holocene lake-level change in monsoonal and arid Central Asia as identified by model experiments. Climate Dynamic, 35(6): 1119-1132.

DOI

[41]
Li Y, Morrill C, 2013. Lake levels in Asia at the Last Glacial Maximum as indicators of hydrologic sensitivity to greenhouse gas concentrations. Quaternary Science Reviews, 60: 1-12.

DOI

[42]
Li Y, Peng S M, Liu H B et al., 2020. Westerly jet stream controlled climate change mode since the Last Glacial Maximum in the northern Qinghai-Tibet Plateau. Earth and Planetary Science Letters, 549: 116529.

DOI

[43]
Li Y, Wang N A, Li Z L et al., 2011. Holocene palynological records and their responses to the controversies of climate system in the Shiyang River drainage basin. Chinese Science Bulletin, 56(2): 535-546. (in Chinese)

DOI

[44]
Lin R F, Wei K Q, 2000. A δ13C record of the organic matter in lacustrine sediments of the core ZHJ from Lake Caohai and its palaeoclimate implications. Geochimica, 29(4): 390-396. (in Chinese)

[45]
Liu Z Y, Zhu J, Rosenthal Y et al., 2014. The Holocene temperature conundrum. Proceedings of the National Academy of Sciences, 111(34): E3501-E3505.

[46]
Lowry D P, Morrill C, 2019. Is the Last Glacial Maximum a reverse analog for future hydroclimate changes in the Americas? Climate Dynamics, 52(7/8): 4407-4427.

DOI

[47]
Lu H Y, Yi S W, Liu Z Y et al., 2013. Variation of East Asian monsoon precipitation during the past 21 k.y. and potential CO2 forcing. Geology, 41(9): 1023-1026.

DOI

[48]
Luo C, Peng Z C, Yang D et al., 2009. A lacustrine record from Lop Nur, Xinjiang, China: Implications for paleoclimate change during Late Pleistocene. Journal of Asian Earth Sciences, 34(1): 38-45.

DOI

[49]
Lyle M, Heusser L, Ravelo C et al., 2012. Out of the Tropics: The Pacific, Great Basin Lakes, and Late Pleistocene water cycle in the western United States. Science, 337(6102): 1629-1633.

DOI

[50]
Madsen D B, Ma H Z, Rhode D et al., 2008. Age constraints on the late Quaternary evolution of Qinghai Lake, Tibetan Plateau. Quaternary Research, 69(2): 316-325.

DOI

[51]
Man M L, Zheng Z, Li J et al., 2016. Carbon isotope compositions and climate changes of the past 20,000 years inferred from a mountainous peat bog of northern Guangxi. Tropical Geography, 36(3): 468-476. (in Chinese)

[52]
Mingram J, Schettler G, Nowaczyk N et al., 2004. The Huguang maar lake: A high-resolution record of palaeoenvironmental and palaeoclimatic changes over the last 78,000 years from south China. Quaternary International, 122(1): 85-107.

DOI

[53]
Murakami T, Katsuta N, Yamamoto K et al., 2010. A 27-kyr record of environmental change in Central Asia inferred from the sediment record of Lake Hovsgol, northwest Mongolia. Journal of Paleolimnology, 43(2): 369-383.

DOI

[54]
Oster J L, Ibarra D E, Winnick M J et al., 2015. Steering of westerly storms over western North America at the Last Glacial Maximum. Nature Geoscience, 8(3): 201-205.

DOI

[55]
Öğretmen N, 2012. Paleoenvironmental changes in Lake Van during the Last Glacial-Holocene[D]. Istanbul: Istanbul Technical University.

[56]
Qin B, Yu G, 1998. Implications of lake level variations at 6 ka and 18 ka in mainland Asia. Global and Planetary Change, 18(1/2): 59-72.

DOI

[57]
Rhodes T E, Gasse F, Lin R F et al., 1996. A Late Pleistocene-Holocene lacustrine record from Lake Manas, Zunggar (northern Xinjiang, western China). Palaeogeography, Palaeoclimatology, Palaeoecology, 120(1/2): 105-121.

DOI

[58]
Shen J, Liu X Q, Wang S M et al., 2005. Palaeoclimatic changes in the Qinghai Lake area during the last 18,000 years. Quaternary International, 136(1): 131-140.

DOI

[59]
Shi Y F, Shen Y P, Kang E et al., 2007. Recent and future climate change in northwest China. Climatic Change, 80(3): 379-393.

DOI

[60]
Sime L C, Hodgson D, Bracegirdle T J et al., 2016. Sea ice led to poleward-shifted winds at the Last Glacial Maximum: The influence of state dependency on CMIP5 and PMIP3 models. Climate of the Past, 12(12): 2241-2253.

DOI

[61]
Sowers T, Alley R B, Jubenville J, 2003. Ice core records of atmospheric N2O covering the last 106,000 years. Science, 301(5635): 945-948.

PMID

[62]
Sun A Z, Feng Z D, Ran M et al., 2013. Pollen-recorded bioclimatic variations of the last 22,600 years retrieved from Achit Nuur core in the western Mongolian Plateau. Quaternary International, 311: 36-43.

DOI

[63]
Tierney J E, Poulsen C J, Montañez I P et al., 2020. Past climates inform our future. Science, 370(6517): 3701-3709.

[64]
Thompson R S, Anderson K H, 2000. Biomes of western North America at 18,000, 6000 and 0 C-14 yr BP reconstructed from pollen and packrat midden data. Journal of Biogeography, 27(3): 555-584.

DOI

[65]
Wang N, Jiang D B, Lang X M, 2018. Northern westerlies during the Last Glacial Maximum: Results from CMIP5 simulations. Journal of Climate, 31(3): 1135-1153.

DOI

[66]
Wang P X, Wang B, Cheng H et al., 2017b. The global monsoon across time scales: Mechanisms and outstanding issues. Earth-Science Reviews, 174: 84-121.

DOI

[67]
Wang R L, Scarpitta S C, Zhang S C et al., 2002. Later Pleistocene/Holocene climate conditions of Qinghai-Xizhang Plateau (Tibet) based on carbon and oxygen stable isotopes of Zabuye Lake sediments. Earth and Planetary Science Letters, 203(1): 461-477.

DOI

[68]
Wang Y B, Bekeschus B, Handorf D et al., 2017a. Coherent tropical-subtropical Holocene see-saw moisture patterns in the Eastern Hemisphere monsoon systems. Quaternary Science Reviews, 169: 231-242.

DOI

[69]
Wanner H, Beer J, Bütikofer J et al., 2008. Mid- to Late Holocene climate change: An overview. Quaternary Science Reviews, 27(19/20): 1791-1828.

DOI

[70]
Wehrli K, Guillod B P, Hauser M et al., 2018. Assessing the dynamic versus thermodynamic origin of climate model biases. Geophysical Research Letters, 45(16): 8471-8479.

DOI

[71]
Wischnewski J, Mischke S, Wang Y B et al., 2011. Reconstructing climate variability on the northeastern Tibetan Plateau since the last Lateglacial: A multi-proxy, dual-site approach comparing terrestrial and aquatic signals. Quaternary Science Reviews, 30(1/2): 82-97.

DOI

[72]
Wu H B, Guo Z T, 2000. Evolution and drought events in arid region of northern China since the Last Glacial Maximum. Quaternary Sciences, 20(6): 548-558. (in Chinese)

[73]
Wu H N, Ma Y Z, Feng Z D et al., 2009. A high resolution record of vegetation and environmental variation through the last -25,000 years in the western part of the Chinese Loess Plateau. Palaeogeography, Palaeoclimatology, Palaeoecology, 273(1): 191-199.

DOI

[74]
Wu X, Huang W, Chen F H, 2014. Construction and application of monthly air temperature and precipitation gridded datasets with high resolution (0.025°×0.025°) over China during 1951-2012. Journal of Lanzhou University (Natural Sciences), 50(2): 213-220. (in Chinese)

[75]
Yan D D, Wünnemann B, 2014. Late Quaternary water depth changes in Hala Lake, northeastern Tibetan Plateau, derived from ostracod assemblages and sediment properties in multiple sediment records. Quaternary Science Reviews, 95: 95-114.

DOI

[76]
Yanase W, Abe-Ouchi A, 2007. The LGM surface climate and atmospheric circulation over East Asia and the North Pacific in the PMIP2 coupled model simulations. Climate of the Past, 3: 439-451.

DOI

[77]
Yu G, Xue B, Liu J et al., 2003. LGM lake records from China and an analysis of climate dynamics using a modelling approach. Global and Planetary Change, 38(3): 223-256.

DOI

[78]
Yu G, Xue B, Wang S M et al., 2000. Chinese lakes records and the climate significance during Last Glacial Maximum. Chinese Science Bulletin, 45(3): 250-255. (in Chinese)

DOI

[79]
Yuan D, Cheng H Y, Edwards R L et al., 2004. Timing, duration, and transitions of the Last Interglacial Asian monsoon. Science, 304(5670): 575-578.

DOI

[80]
Zhao K L, Li X Q, Dodson J et al., 2013. Climate instability during the last deglaciation in Central Asia, reconstructed by pollen data from Yili Valley, NW China. Review of Palaeobotany and Palynology, 189: 8-17.

DOI

[81]
Zhao L Y, Lu H Y, Zhang E L et al., 2015. Lake level and paleoenvironment variations in Yitang Lake (northwestern China) during the past 23 ka revealed by stable carbon isotopic composition of organic matter of lacustrine sediments. Quaternary Sciences, 35(1): 172-179. (in Chinese)

[82]
Zhang C J, Chen F H, Shang H M et al., 2004. The paleoenvironmental significance organic carbon isotope in lacustrince sediments in the arid China: An example from Sanjiaocheng palaeolake in Minqin. Quaternary Sciences, 24(1): 88-94. (in Chinese)

[83]
Zhang X Z, Li Y, Ye W T et al., 2020b. Wet-dry status change in global closed basins between the mid-Holocene and the Last Glacial Maximum and its implication for future projection. Climate of the Past, 16: 1987-1998.

DOI

[84]
Zhang Y R, Renssen H, Seppä H et al., 2020a. Spatial contrasts of the Holocene hydroclimate trend between North and East Asia. Quaternary Science Reviews, 227: 106036.

DOI

Outlines

/