Chemical fertilizer rate, use efficiency and reduction of cereal crops in China, 1998-2018

  • XIN Liangjie
Expand
  • Key Laboratory of Land Surface Pattern and Simulation, Institute of Geographic Sciences and Natural Resources Research, CAS, Beijing 100101, China

Xin Liangjie (1979-), PhD and Associate Professor, specialized in land use change and its effects. E-mail:

Received date: 2020-11-05

  Accepted date: 2021-08-10

  Online published: 2022-03-25

Supported by

The Second Tibetan Plateau Scientific Expedition and Research Program(2019QZKK0603)

Strategic Priority Research Program of Chinese Academy of Sciences(XDA20040000)

Strategic Priority Research Program of Chinese Academy of Sciences(XDA20090000)

Abstract

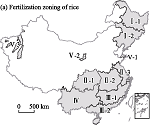
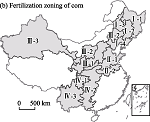
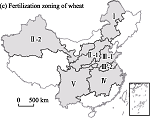
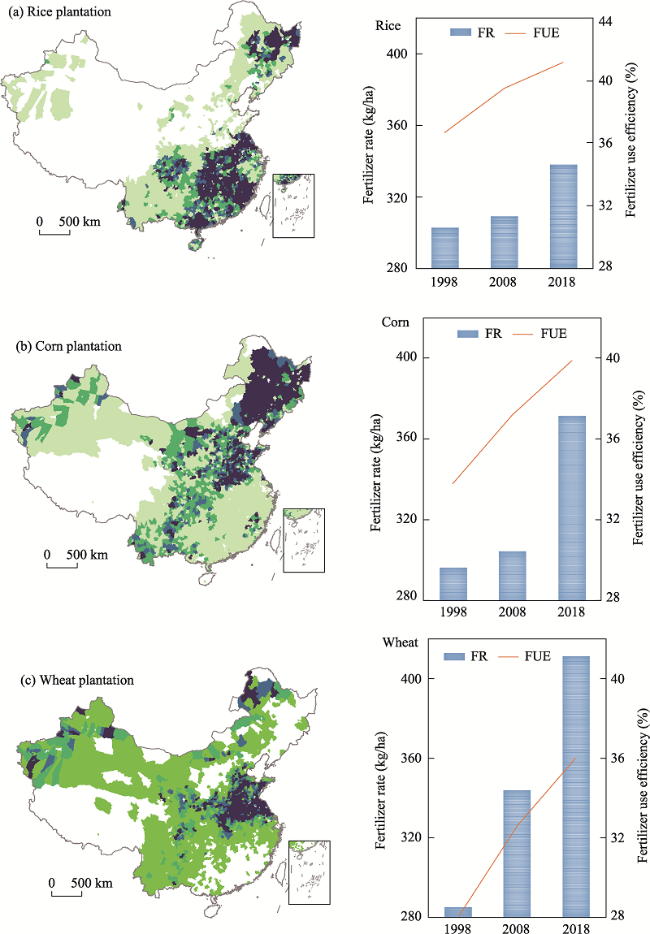
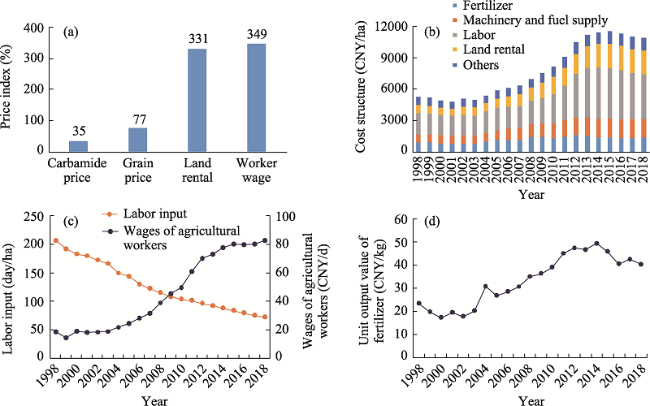
This paper studied the fertilizer rate (FR), fertilizer use efficiency (FUE) and fertilizer overuse rate (FOR) of rice, corn and wheat in China from 1998 to 2018 and briefly analysed the reasons why farmers were willing to apply more fertilizers. (1) The FR of grain in China reached 373.7 kg/ha in 2018, an increase of 26.8% compared to that in 1998. In 2018, the FR for corn was the highest, at 411.2 kg/ha, compared to the values of 338.3 kg/ha for rice and 371.7 kg/ha for wheat. (2) In recent years, the FUE of grain in China has obviously improved, with values of 32.9% in 1998, 36.7% in 2008, and 39.3% in 2018. In 2018, the FUE for rice was the highest (41.2%), followed by that for corn (39.9%), and the FUE for wheat was the lowest (36.0%). (3) By 2018, fertilizer was overused in all zones of rice, corn and wheat. In 2018, the average FOR for wheat reached 69.0%, which was 35.9% higher than that for corn and 42.8% higher than that for rice. (4) The lower price of chemical fertilizers was the main reason leading to overapplication. (5) Establishing market mechanisms and adjusting regional planting structures can be effective in reducing the application of chemical fertilizers.

Cite this article

XIN Liangjie . Chemical fertilizer rate, use efficiency and reduction of cereal crops in China, 1998-2018[J]. Journal of Geographical Sciences, 2022 , 32(1) : 65 -78 . DOI: 10.1007/s11442-022-1936-2

1 Introduction

Chemical fertilizers have played a pivotal role in the success of agricultural production systems. The widespread use of fertilizers has greatly contributed to the substantial increase in global grain production in the last six decades, including that in China (Li et al., 2013; Li et al., 2014). China is the most populous country in the world and has been suffering from famine for a long time. The Chinese government has attached great importance to agricultural production and food security. Since the 1970s, China has vigorously promoted the development of the chemical fertilizer industry and controlled fertilizer prices. Thus, the unit level and total amount of fertilizer application in China has increased rapidly since then (Chen et al., 2018). In 1994, China’s total fertilizer consumption surpassed that of the United States of America and has since consistently ranked first globally (Xin et al., 2012). Due to the widespread use of fertilizers and other improvements, China’s agricultural production has made great progress in the past 40 years. China’s total grain production was more than double from 1980 to 2018. Currently, China’s per capita consumption of grain obviously exceeds the world average. China has made a great achievement of food security, feeding 22% of the world population with 9% of the global arable land.
The excessive use of chemical fertilizers is a worldwide problem, and the situation is even worse in the developing world, including China. According to the World Bank, China accounts for more than 30% of the total global fertilizer consumption. However, China’s total area of cultivated land accounts for only approximately 9% of the world’s total (Cui et al., 2010). The overuse of fertilizers increases agricultural production but causes low fertilizer efficiency and serious environmental pollution (Lassaletta et al., 2014). Fertilizer use efficiency varies greatly across countries, for instance, the phosphorus use efficiency was about 95% in high-income countries, about 40% in China and India, and about 82% in sub-Saharan Africa in 2010. While the nitrogen use efficiency for cereal was 41% in the United States, 30% in China, and only 21% in India in 2015 (Drechsel et al., 2015; Bouwman et al., 2017; Dhillon et al., 2017; Omara et al., 2019). According to the Ministry of Environmental Protection of China, the average efficiency of fertilizers for three major grain crops (rice, corn and wheat) has improved each year. However, it reached only 37.8% in 2017 (Wu et al., 2019), which was lower than the value of 65% in North America (Zhang et al., 2015). Research results from academia show that the situation may be far worse than what official numbers show (Quan et al., 2019; Wehmeyer et al., 2020). A study by Lassaletta et al. (2014) even showed that China displayed a regularly decreasing trend of nitrogen use efficiency from 1960 to 2010, and the same decrease in nitrogen use efficiency was also found in most parts of the United States (Swaney et al., 2020).
Additionally, the continuous over-application of chemical fertilizer has caused widespread agricultural non-point source pollution (Shi et al., 2018; Wu and Ge, 2019), soil acidification (Zhou et al., 2014) and excessive emissions of greenhouse gas in China (Jiang et al., 2020). Although it is well known that chemical fertilizers are overused in agricultural production in China, research results about the extent of fertilizer overapplication vary widely, extending from 30% to 116% (Huang et al., 2008; Li et al., 2013; Zhang et al., 2015; Quan et al., 2020). There are also differences between regions. For example, some results show that fertilizer application levels and excessive extents in the eastern coastal area and the middle and lower reaches of the Yangtze River are obviously higher than those of other areas (Wang et al., 2015; Liu et al., 2016; Wang et al., 2017). The reasons for different or even opposite conclusions are mainly because of differences in data sources, research methods and research objects. Moreover, most studies have adopted the uniform standard to measure the degree of overuse, ignoring planting systems and crop types in different regions. Therefore, the characteristics of the fertilizer application level of three major grain crops (rice, corn and wheat) in China were analysed firstly. Then, fertilizer use efficiency (FUE) was studied. Third, we measured the extent of fertilizer overuse based on the reasonable application level recommended by the country. Last, the main reasons why farmers were willing to apply more fertilizer were analysed.

2 Methodology and data sources

2.1 Methodology

2.1.1 China’s agricultural regions

China occupies a vast territory, but the cultivation rate of the whole land area is only approximately 9%. Cultivated land is mainly distributed in East China. Approximately 71% of China’s cultivated area is used for grain crops. Rice, wheat and corn are the most important grain crops in China, which is divided into nine agricultural regions according to the similarity principle of climate and agricultural production (Figure 1).
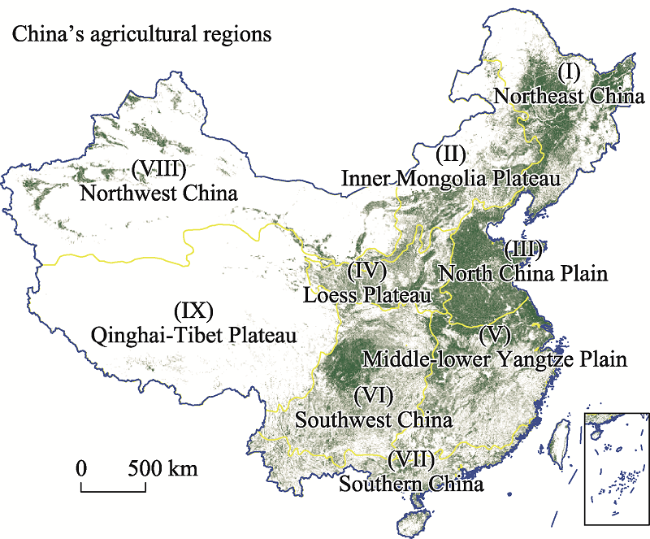
Figure 1 Distribution of China’s cultivated land and nine agricultural regions of China

2.1.2 Grain fertilizer use efficiency

FUE is a critically important concept in the evaluation of crop production systems. FUE is a key indicator used to assess the effective utilization rate of fertilizer and could be used to address environmental pollution from fertilizer inputs (Lassaletta et al., 2014). There are six main FUE measurement and calculation terms: partial factor productivity, agronomic efficiency, partial nutrient balance, apparent recovery efficiency by difference, internal utilization efficiency, and physiological efficiency (Table 1) (Fixen et al., 2015).
Table 1 Common FUE terms and their applications
Term Formula Note
Partial factor productivity PFP = Y/F Y = Yield of harvested portion of crops with nutrients applied
F = Amount of nutrients applied
Y0 = Yield with no nutrients applied
UH = Nutrient content of harvested portion of crops
U = Total nutrient uptake in aboveground crop biomass with nutrient applied
U0 = Nutrient uptake in aboveground crop biomass with no nutrients applied
Agronomic efficiency AE = (Y-Y0)/F
Partial nutrient balance PNB = UH/F
Apparent recovery efficiency by difference RE = (U-U0)/F
Internal utilization efficiency IE = Y/U
Physiological efficiency PE = (Y-Y0)/(U-U0)
In this paper, FUE refers to the apparent recovery efficiency by difference, which is usually defined as the difference in nutrient uptake in aboveground parts of the plant between the fertilized and unfertilized crops relative to the quantity of nutrients applied. RE is most used as a short-term indicator of the impact of applied nutrients on productivity and as input data for nutrient recommendations based on omission plot yields. However, in the calculation formula of RE, U and U0 include only the contents of nutrients in aboveground crop biomass, but not include the contents of nutrients in the roots (Chen et al., 2002). In fact, the root/shoot ratio of grain crops can reach 0.25 or even higher (Li et al., 2009; Ma et al., 2010; Williams et al., 2013).
Therefore, we improved the calculation method, as follows:
$U = {G_i} \times {D_G} + {S_i} \times {D_S} + {R_i} \times {D_R}$
where Gi, Si, and Ri are the contents of nutrients in the grain, straw and root of crop i, respectively. DG, DS, and DR are the biomasses of grain, straw and root, respectively. We used the same method to calculate U0.
Here, harvest indices and root/shoot ratios were used to estimate crop straw and root biomasses per unit area (Table 2).
Table 2 Harvest indices and root/shoot ratios among nine agricultural regions of China (%)
Indices Crop
Harvest index Corn 0.48 0.43 0.51 0.51 0.48 0.56 0.48 0.44 0.54
Rice 0.52 0.50 0.37 0.46 0.57 0.58 0.50 0.49 0.55
Wheat 0.50 0.45 0.50 0.42 0.45 0.34 0.46 0.54 0.42
Root/shoot ratio Corn 0.11 0.14 0.13 0.16 0.12 0.13 0.15 0.11 0.16
Rice 0.13 0.18 0.06 0.25 0.17 0.11 0.20 0.19 0.14
Wheat 0.20 0.15 0.20 0.15 0.24 0.14 0.28 0.16 0.06

Data source: Wang et al., 2016

The N, P and K contents of straw/roots and grains of rice, wheat and corn are reported in Table 3.
Table 3 The N, P, and K contents in the grains and straw/roots of rice, wheat and corn in China (%)
Crop Nutrient contents in grain Nutrient contents in straw/roots
N P2O5 K2O N P2O5 K2O
Rice 1.46 0.62 1.92 0.83 0.27 2.06
Wheat 2.46 0.85 2.77 0.62 0.16 1.23
Corn 2.58 0.98 2.78 0.87 0.31 1.34

Data source: Song et al., 2018

2.1.3 Fertilizer overuse rate (FOR)

The following equation was used to calculate the overuse extent of fertilizers:
${R_i} = \left( {{B_i} - {O_i}} \right)/{O_i} \times 100\% $
where Bi represents the actual fertilizer usage applied to crop i per unit area, and Oi represents the optimal fertilizer usage rate for crop i.

2.2 Data sources

The data, including fertilizer inputs, labour inputs and other inputs, wages of agricultural workers, grain yields and output values of the three major grain crops, for the period 1998-2018 were gathered from the National Farm Product Cost-benefit Survey issued by the National Development and Reform Commission. Data for fertilizer inputs include the total NPK (N+P2O5+K2O) nutrient inputs from nitrogenous, phosphate, potash, and compound fertilizers. All economic data were converted into 1998 constant Chinese Yuan (CNY) by the consumer price indices, which were gathered from the National Bureau of Statistics of China (http://www.stats.gov.cn/).
Optimal fertilization is important for both crop production and environmental protection. In China, there had not been a satisfactory reference standard to guide farmers’ fertilization methods for a long time (Lv et al., 2015). The Ministry of Agriculture and Rural Affairs of China has developed and implemented a nationwide project called Formula Fertilization by Soil Testing since 2005. The fertilizer utilization characteristics of grain crops and the spatial characteristics of soil nutrients have been studied in depth in this project. The Ministry of Agriculture and Rural Affairs of China issued Regional fertilizer recommendation rates for wheat, corn and rice in 2013 based on the results of this project. Here, the recommended fertilizer application rates are considered optimal in Equation 2 for calculating the overuse extent of fertilizer.

3 Results

3.1 FR and FUE at different scales

3.1.1 National scale

The FR of grain in China has increased rapidly since 1998. This upward trend was particularly evident during 2004 and 2018, with an average annual growth rate of 5.9 kg/ha. The fitting function was Y=5.9314X+257.81 (R2=0.9544). In 2018, the application intensity of chemical fertilizers in China reached 373.7 kg/ha, an increase of 26.8%, compared to that in 1998. By 2018, the FR in grain production in China was more than three times the world average.
The FRs of rice, wheat and corn were all at the level of approximately 300 kg/ha during 1998 and 2004. However, after 2004, the FR of wheat increased rapidly, and the growth rate of corn was relatively slow. By 2018, the differences among the FRs of rice, wheat and corn were very obvious, with values of 338.3 kg/ha, 371.7 kg/ha, and 411.2 kg/ha, respectively (Figure 2). The FR of wheat was higher than that of 10.6% for corn and 21.6% for rice.
Figure 2 FRs and FUEs of rice, corn and wheat of China
In recent years, the FUE of grain in China has obviously improved, with values of 32.9% in 1998, 36.7% in 2008, and 39.3% in 2018. Our research conclusions about China’s FUE are the same as those in most studies (Bai et al., 2019; Long et al., 2018; Huang and Jiang, 2019; Kusano et al., 2019; He et al., 2020) but contrary to the results in the study by Lassaletta et al. (2014). In China, the FUEs for rice were 36.7%, 39.5% and 41.2%, the FUEs for corn were 33.8%, 37.2% and 39.9%, and the FUEs for wheat were 28.1%, 32.6% and 36.0% in 1998, 2008, and 2018, respectively. The FUE for rice was the highest, followed by that of corn, and the FUE for wheat was the lowest.

3.1.2 Regional scale

Table 4 shows the estimations of FRs and FUEs for rice, wheat and corn of the different regions in China.
Table 4 The FRs and FUEs for rice, wheat and corn in 1998, 2008, and 2018 (%)
Zone 1998 2008 2018 Growth rate
1998-2018
FR FUE FR FUE FR FUE FR FUE
I-1 215.1 36.3 289.1 45.6 344.1 41.5 60.0 14.3
I-2 313.5 39.6 345.8 43 380.6 44.6 21.4 12.6
II-1 208.3 47.7 271.5 48.8 276.6 54.4 32.8 14.0
II-2 288.5 41.3 311.5 41.1 364.4 43.6 26.3 5.6
II-3 320.1 36.9 335.3 38.6 407.6 39 27.3 5.7
III-1 306.4 31.3 295.2 35.3 309.6 38.4 1.0 22.7
III-2 301.9 32.1 302.4 32.1 364.2 32.3 20.6 0.6
IV 267.8 39.9 315.6 37.5 324 40.2 21.0 0.8
V-1 446.6 34 504.6 34 483.2 39.1 8.2 15.0
V-2 452.1 38.8 390 40 467.4 41.8 3.4 7.7
V-3 456.9 34.2 504.6 34.7 483.2 40.7 5.8 19.0
I-1 222 42 233.7 44.1 338 43.5 52.3 3.6
I-2 398.4 34.3 342 26.2 449.4 38.6 12.8 12.5
I-3 378.8 35.7 329.3 29.7 422.4 39.9 11.5 11.8
I-4 324.2 38.6 317.4 29 370.5 40.8 14.3 5.7
II-1 231.6 38.8 296.9 38.6 338.6 40.6 46.2 4.6
II-2 234.5 29.4 302 31.2 382.4 33.7 63.1 14.6
III-1 277.6 35.7 301.4 31.8 314.5 33.7 13.3 -5.6
III-2 359.1 32.8 316.7 33.2 395.4 45.4 10.1 38.4
III-3 454.5 26.3 381.2 30.5 496.6 34.4 9.3 30.8
IV-1 276 25.3 302.4 34.9 320.4 44.5 16.1 75.9
IV-2 293.8 23.6 315.5 37 333.6 36.1 13.5 53.0
IV-3 320.6 23 368.9 26.6 387.8 31.2 21.0 35.7
I 328.8 15.3 443.9 18.7 562.2 20 71.0 30.7
II-1 235.8 29.1 335.2 30.1 413.4 36.9 75.3 26.8
II-2 365.8 22.3 322.9 24.5 420.1 25 14.8 12.1
III-1 374.9 29.7 382.1 35.2 429.5 34.8 14.6 17.2
III-2 351.3 23.8 355.5 34.5 430.2 31.7 22.5 33.2
IV 298.2 25.8 310.3 34.1 367.6 35.8 23.3 38.8
V 189.5 40.2 191.1 38.4 201.1 42.1 6.1 4.7
Rice is cultivated in approximately 18% of the cultivated area, grown mainly in South and Northeast China. The FRs in 11 rice cultivation zones all showed upward trends from 1998 to 2018, but the current FR level and the degree of increase were obviously different. In 2018, the FRs in China’s mid-latitudes (V-1, V-2, V-3, II-3) were relatively high, and the FR in II-1 (mainly in Sichuan Basin) rice cultivation zone was the lowest in China, at a level of 276.6 kg/ha.
The FUEs in all 11 rice cultivation zones improved from 1998 to 2018, but the current FUE level and the degrees of increase were obviously different. In 2018, the FUE in the II-1 rice cultivation zone was the highest in China, reaching 54.4%, and the FUE in the III-2 (Guangdong and Hainan provinces) rice cultivation zone was the lowest, at only 32.3%. The III-1 (Fujian and Jiangxi provinces) rice cultivation zone had the highest FUE growth rate of 22.7% from 1998 to 2018. The III-2 and IV (Guizhou and Yunnan provinces) rice zones had the lowest FUE growth rates, with values less than 1%.
Corn is the most important crop and is widely distributed in China, and it is grown in approximately 25% of the cultivated area. The corn plantation area is divided into 12 zones according to the similarity principle of climate and agricultural production. Most of the nation’s corn is grown in North and Northeast China. The FRs in all 12 corn zones showed upward trends from 1998 to 2018, with the increase ranging from 9.3% to 52.8%. The growth rates of the FRs in I-1 (Heilongjiang Province) and in II-1 and II-2 (North China Plain) were relatively high, and the growth rates in I-2, I-3, and I-4 (Northeast China Plain) and III-1, III-2, and III-3 (Loess Plateau) were relatively low.
The FUEs in almost all corn zones (except III-1) improved from 1998 to 2018, with growth rates ranging from 3.6% to 75.9%. The growth rate of the FUE in IV-2 (Sichuan Basin) was the highest, and the value in I-1 was the lowest. In 2018, the FURs in the Northeast China Plain, North China Plain, and Sichuan Basin were relatively high, with average values over 40%, and they were relatively low in West China.
Wheat is grown in approximately 15% of the cultivated area, especially in the North China Plain. However, the two subregions of the North China Plain, III-1 and III-2, had relatively higher FRs, but the FUEs were not good. The FR for wheat in I (northeast of Inner Mongolia) was the highest in China, at a level of 562.2 kg/ha, but had the lowest FUE of 20.0%. Zone V (Sichuan Basin and Yunnan-Guizhou Plateau) had the lowest FR and the highest FUE values.

3.2 Fertilizer overuse rate (FOR)

According to the regional fertilizer recommendation rates for wheat, corn and rice in 2013, the recommended FRs in China for rice, corn and wheat were 304.1, 284.4, and 240.0 kg/ha, respectively.
FORs for rice, corn and wheat in China increased significantly from 1998 to 2018 (Table 5). By 2018, fertilizer was overused in all zones for rice, corn and wheat. The average FOR for rice in 2018 reached 26.2% compared to 5.9% in 1998 and 15.5% in 2008. The most serious overuse of rice appeared in I-1 and I-2 (Northeast China Plain), and the situation in II-1 (Sichuan Basin) was the best, with an overuse rate of only 1.4% in 2018. The average fertilizer overuse rate for corn in 2018 reached 33.1% compared to 9.7% in 1998 and 11.6% in 2008. The zones of I-2 (Jilin Province), I-3 (eastern Inner Mongolia), III-3 (Xinjiang) and IV-3 (Yunnan-Guizhou Plateau) had the highest fertilizer overuse rates, and the overuse rates in zones III-1 and IV-1 were relatively lower.
Table 5 FORs for rice, corn and wheat in 1998, 2008, and 2018
Crop Zone Recommended rate (kg/ha) Overuse rate (%)
1998 2008 2018
Rice I-1 228.1 -5.7 26.7 50.9
I-2 265.2 18.2 30.4 43.5
II-1 272.7 -23.6 -0.4 1.4
II-2 290.9 -0.8 7.1 25.3
II-3 364.6 -12.2 -8.0 11.8
III-1 285.2 7.4 3.5 8.6
III-2 269.1 12.2 12.4 35.3
IV 275.0 -2.6 14.8 17.8
V-1 364.6 22.5 38.4 32.5
V-2 364.6 24.0 7.0 28.2
V-3 364.6 25.3 38.4 32.5
Average 304.1 5.9 15.5 26.2
Corn I-1 254.9 -12.9 -8.3 32.6
I-2 314.6 26.6 8.7 42.8
I-3 278.6 36.0 18.2 51.6
I-4 286.4 13.2 10.8 29.4
II-1 251.9 -8.1 17.9 34.4
II-2 288.8 -18.8 4.6 32.4
III-1 275.5 0.8 9.4 14.2
III-2 302.6 18.7 4.7 30.7
III-3 331.2 37.2 15.1 49.9
IV-1 295.4 -6.6 2.4 8.5
IV-2 261.6 12.3 20.6 27.5
IV-3 271.7 18.0 35.8 42.7
Average 284.4 9.7 11.6 33.1
Wheat I 234.6 40.2 89.2 139.6
II-1 192.4 22.6 74.2 114.9
II-2 238.2 53.6 35.6 76.4
III-1 290.4 29.1 31.6 47.9
III-2 288.5 21.8 23.2 49.1
IV 250.2 19.2 24.0 46.9
V 185.7 2.0 2.9 8.3
Average 240.0 26.9 40.1 69.0
Among the three grain crops, the degree of fertilizer overuse of wheat was the most serious. In 2018, the average fertilizer overuse rate for wheat reached 69.0%, which was 35.9%
higher than that for corn and 42.8% higher than that for rice. The overuse rates in zones I and II-1 were especially serious, at levels of 139.6% and 114.9%, respectively. Zone V had the lowest FOR, with a value of 8.3%.

4 Discussion

4.1 Why do farmers excessively use chemical fertilizers?

To ensure grain production, the Chinese government increased the subsidies of grain production and grain purchase prices, promoted domestic fertilizer production through subsidies and other support policies, and controlled domestic fertilizer prices through market intervention and trade restriction policies. The market prices of fertilizers were artificially distorted. Land rental and the wages of agricultural workers have increased more than 300% over the last 20 years, while fertilizer prices have increased by only 35% (Figure 3a). Therefore, although the application of chemical fertilizers had gradually increased in recent years, the increase in fertilizer cost was not obvious. The fertilizer cost in grain production increased by 438 CNY per hectare from 1998 to 2018 compared to the output value per hectare, indicating an increase of 3236 CNY (Figure 3b). At the same time, the wage of China’s agricultural labourers grew rapidly, increasing from 18 CNY per day to 83 CNY per day (Figure 3c). Thus, farmers were more willing to increase their inputs of pesticides and fertilizers, machinery and other production factors as much as possible to replace the labour input for agricultural production (Dai et al., 2015). In terms of fertilization practices, traditional corn plantations were generally fertilized three times: applying base fertilizer once and topdressing twice. Currently, corn is fertilized only once, i.e., at sowing time (Li et al., 2010; Ma et al., 2020).
Figure 3 Labour, chemical fertilizer inputs and output value of China’s grain production, 1998-2018. All values are deflated by the consumer price indices (1998=1).
The method has also changed from manual fertilization to efficient mechanical fertilization. A reduced frequency of fertilization increased fertilizer loss. Thus, farmers need to compensate for the loss of fertilization by applying more chemical fertilizers to their fields. For farmers, applying more fertilization can avoid the risk of yield reduction, and it is economically feasible (Figure 3d).

5 Conclusions and policy implications

The consumption of fertilizers in China has skyrocketed in recent decades. Currently, China consumes more than 30% of the total global fertilizer but has only 9% of the world’s arable land. This paper studied FR, FUE and FOR for rice, corn and wheat in China from 1998 to 2018 and briefly analysed the reasons why farmers were willing to apply more fertilizers. The main conclusions are presented as follows.
(1) The FR of grain in China has increased rapidly since 1998. In 2018, the application intensity of chemical fertilizers in China reached 373.7 kg/ha, more than three times the world average. The fertilizer application rate of corn was the highest, at 411.2 kg/ha, compared to the rate of 338.3 kg/ha of rice and the rate of 371.7 kg/ha of wheat.
(2) In recent years, FUEs of grain in China improved obviously, with values of 32.9% in 1998, 36.7% in 2008, and 39.3% in 2018. In 2018, the FUE for rice was the highest (41.2%), followed by that of corn (39.9%), and the FUE for wheat was the lowest (36.0%).
(3) The FORs for rice, corn and wheat in China increased significantly from 1998 to 2018. By 2018, fertilizer became overused in all zones for rice, corn and wheat. The average FOR for rice in China reached 26.2% in 2018 compared to 5.9% in 1998 and 15.5% in 2008. In 2018, the average FOR for wheat reached 69.0%, which was 35.9% higher than that for corn and 42.8% higher than that for rice.
(4) Compared with other production materials, the lower price of chemical fertilizers was the main reason leading to overapplication.
(5) The most serious fertilizer overuse appeared in the I-1 and I-2 (Northeast China Plain) rice zones, and the situation in II-1 (Sichuan Basin) was the best, with an overuse rate of only 1.4% in 2018. The I-2, I-3, III-3 and IV-3 corn zones had the highest FORs, and the overuse rates in the zones of III-1 and IV-1 were relatively lower. The overuse rates in the I and II-1 wheat zones were especially serious, and Zone V had the lowest FOR.
Based on this research, we provide the following two suggestions to reduce chemical fertilizer application and improve FUE.
(1) Promoting formula fertilization by soil testing.
According to the main conclusions of this study, the situation of fertilizer oveuse in China is still serious. In 2018, the average FOR for wheat, corn and rice reached 69.0%, 33.1% and 26.2%, respectively. Soil testing and formula fertilization technology shows unique advantages in reducing chemical fertilizer application, improving FUE, and protecting environment (Zeng et al., 2012; Chen et al., 2014; Shi et al., 2020; Purnomo and Subiksa, 2021).
At present, China’s formula fertilization technology has not yet been implemented and heavily promoted nationwide. The government should increase the financing of formula fertilization technology, which will provide more comprehensive basis for the optimization of fertilization scheme, improvement of fertilization formula, measurement of technical index system of formula fertilizer and technical standard to ensure sustainable development of agriculture.
(2) Adjusting regional planting structure.
The planting area reduction of crops with a higher FOR and a lower FUE can be effective in reducing the application of chemical fertilizers. In recent years, China’s economy has developed rapidly, and the dietary consumption structure of residents has also rapidly improved. This change in the food structure causes the consumption of the main staple grains of rice and wheat to decrease, while the demand of corn used for feed will gradually increase. Based on this research, the FUE for wheat was lower and the FOR was higher than those for corn and rice. In addition, with the improvement of dietary consumption structure, China’s wheat consumption is gradually decreasing. Therefore, we suggest first reducing the planting area of wheat with a higher FR and a lower FUE. Table 6 provides the suggestions for how to adjust regional planting structure. The II-1 rice zone had the lowest FR and the highest FUE, and more rice should be planted in this zone, and the planting area should be reduced in the III-2 rice zone with the lowest FUE and growth rate. It is recommended that more corn should be grown in zones I-1, II-1, and IV-1, and less corn should be grown in zones I-2 and III-3. It is recommended that more wheat should be planted in Zone V. It is estimated that the total amount of fertilizer application can be reduced by approximately 1.6% by adjusting the planting structure.
Table 6 Suggestions for planting structure adjustment
Item Reducing area Maintaining the status quo Increasing area
Rice III-2, V-1, V-2, V-3 I-1, I-2, II-2, II-3, IV II-1, III-1
Corn I-2, I-3, III-3, IV-3 II-2, III-1, IV-2 I-1, I-4, II-1, III-2, IV-1
Wheat I, II-1, II-2 III-1, III-2, IV V
[1]
Bai X, Wang Y, Huo X et al., 2019. Assessing fertilizer use efficiency and its determinants for apple production in China. Ecological Indicators, 104: 268-278.

DOI

[2]
Bouwman A F, Beusen A H W, Lassaletta L et al., 2017. Lessons from temporal and spatial patterns in global use of N and P fertilizer on cropland. Scientific Reports, 7(1): 1-11.

DOI

[3]
Chen C, Pan J J, Shu K L et al., 2014. A review of precision fertilization research. Environmental Earth Sciences, 71(9): 4073-4080.

DOI

[4]
Chen T, Zeng X, Hu Q, 2002. Utilization efficiency of chemical fertilizers among different counties in China. Acta Geographica Sinica, 57(5): 531-538. (in Chinese)

[5]
Chen X, Ma L, Ma W, 2018. What has caused the use of fertilizers to skyrocket in China? Nutrient Cycling in Agroecosystems, 110(2): 241-255.

DOI

[6]
Cui Z, Chen X, Zhang F, 2010. Current nitrogen management status and measures to improve the intensive wheat-maize system in China. Ambio, 39(5/6): 376-384.

DOI

[7]
Dai H, Sun T, Zhang K et al., 2015. Research on rural nonpoint source pollution in the process of urban-rural integration in the economically-developed area in China based on the improved STIRPAT model. Sustainability, 7(1): 782-793. https://doi.org/10.3390/su7010782.

DOI

[8]
Dhillon J, Torres G, Driver E et al., 2017. World phosphorus use efficiency in cereal crops. Agronomy Journal, 109(4): 1670-1677.

DOI

[9]
Drechsel P, Heffer P, Magen H et al., 2015. Managing water and fertilizer for sustainable agricultural intensification. International Fertilizer Industry Association (IFA), International Water Management Institute (IWMI), International Plant Nutrition Institute (IPNI), and International Potash Institute (IPI). Paris, France.

[10]
Fixen P, Brentrup F, Bruulsema T et al., 2015. Nutrient/fertilizer use efficiency: Measurement, current situation and trends. In: International Fertilizer Industry Association (IFA), International Water Management Institute (IWMI), International Plant Nutrition Institute (IPNI), and International Potash Institute (IPI). Managing Water and Fertilizer for Sustainable Agricultural Intensification. Paris, Chapter 2, 8-38.

[11]
He R, Shao C F, Shi R G, et al., 2020. Development trend and driving factors of agricultural chemical fertilizer efficiency in China. Sustainability, 12(11): 4607. doi: 10.3390/su12114607.

DOI

[12]
Huang J K, Hu R, Cao J et al., 2008. Training programs and in-the-field guidance to reduce China’s overuse of fertilizer without hurting profitability. Journal of Soil and Water Conservation, 63(5): 165-167.

[13]
Huang W, Jiang L, 2019. Efficiency performance of fertilizer use in arable agricultural production in China. China Agricultural Economic Review, 11(1): 52-69.

DOI

[14]
Jiang J Y, Jiang S, Xu J, 2020. Lowering nitrogen inputs and optimizing fertilizer types can reduce direct and indirect greenhouse gas emissions from rice-wheat rotation systems. European Journal of Soil Biology, 97: doi: 10.1016/j.ejsobi.2020.103152.

DOI

[15]
Kusano E, Yin C, Chien H, 2019. Fertilizer-use efficiency of farmers using manure in Liaozhong County, China. Jarq-Japan Agricultural Research Quarterly, 53(2): 127-133.

DOI

[16]
Lassaletta L, Billen G, Grizzetti B et al., 2014. 50 year trends in nitrogen use efficiency of world cropping systems: The relationship between yield and nitrogen input to cropland. Environmental Research Letters, 9(10): doi: 10.1088/1748-9326/9/10/105011.

DOI

[17]
Li J, Li S, Liu Y, 2009. Effects of increased ammonia on root/shoot ratio, grain yield and nitrogen use efficiency of two wheat varieties with various N supply. Plant Soil and Environment, 55(7): 273-280.

DOI

[18]
Li W, Ou Q, Chen Y, 2014. Decomposition of China’s CO2 emissions from agriculture utilizing an improved Kaya identity. Environmental Science and Pollution Research, 21(22): 13000-13006.

DOI

[19]
Li Y, Zhang W, Ma L et al., 2013. An analysis of China’s fertilizer policies: Impacts on the industry, food security, and the environment. Journal of Environmental Quality, 42(4): 972-981.

DOI

[20]
Li Z, Wang X, Wei J et al., 2010. Life cycle assessment of fertilization in corn production in different regions of China. Acta Scientiae Circumstantiae, 30(9): 1912-1920. (in Chinese)

[21]
Liu X, Wang H, Zhou J et al., 2016. Effect of N fertilization pattern on rice yield, N use efficiency and fertilizer-N fate in the Yangtze River Basin, China. Plos One, 11(11). doi: 10.1371/journal.pone.0166002.

DOI

[22]
Long X L, Luo Y S, Sun H P et al., 2018. Fertilizer using intensity and environmental efficiency for China’s agriculture sector from 1997 to 2014. Natural Hazards, 92(3): 1573-1591.

DOI

[23]
Lv S, Wang X, Liu G, 2015. A simple and reasonable calculation equation of balanced fertilization. Agronomy-Basel, 52: 180-187.

[24]
Ma F L, Zhang S Y, Gao D Q et al., 2020. The problems and countermeasures of fertilization for corn in the eastern mountainous area of Jilin Province. Modern Agricultural Science and Technology, 24: 147-148, 152. (in Chinese)

[25]
Ma S, Li F, Xu B et al., 2010. Effect of lowering the root/shoot ratio by pruning roots on water use efficiency and grain yield of winter wheat. Field Crops Research, 115(2): 158-164.

DOI

[26]
Omara P, Aula L, Oyebiyi F et al., 2019. World cereal nitrogen use efficiency trends: Review and current knowledge. Agrosystems, Geosciences & Environment, 2(1): 1-8.

[27]
Purnomo J, Subiksa I G M, 2021. Effect of P fertilizer formula to the growth and yield of sweet corn on peatland. IOP Conference Series: Earth and Environmental Science, 648(1): 012194.

[28]
Quan Z, Li S, Zhang X et al., 2020. Fertilizer nitrogen use efficiency and fates in maize cropping systems across China: Field N-15 tracer studies. Soil & Tillage Research, 197: doi: 10.1016/j.still.2019.104498.

DOI

[29]
Shi K, Shang J, 2018. Research on the fertilizer application behavior and agricultural non-point source pollution control in green agricultural planting. Boletin De Malariologia Y Salud Ambiental, 58(1): 12-19.

[30]
Shi P, Guo M, Ou S et al., 2020. Formula fertilization of nitrogen and potassium fertilizers reduces cadmium accumulation in Panax notoginseng. Archives of Agronomy and Soil Science, 66(3): 343-357.

DOI

[31]
Song D, Hou S, Wang X, 2018. Nutrient resource quantity of crop straw and its potential of substituting. Journal of Plant Nutrition and Fertilizers, 24(1): 1-21. (in Chinese)

[32]
Swaney D P, Howarth R W, Hong B, 2018. Nitrogen use efficiency and crop production: Patterns of regional variation in the United States, 1987-2012. Science of the Total Environment, 635: 498-511.

DOI

[33]
Wang L, Zheng H, Zhao H et al., 2017. Nitrogen balance dynamics during 2000-2010 in the Yangtze River Basin croplands, with special reference to the relative contributions of cropland area and synthetic fertilizer N application rate changes. Plos One, 12(7). doi: 10.1371/journal.pone.0180613.

DOI

[34]
Wang S, Tan Y, Fan H et al., 2015. Responses of soil microarthropods to inorganic and organic fertilizers in a poplar plantation in a coastal area of eastern China. Applied Soil Ecology, 89: 69-75.

DOI

[35]
Wang Y, Wang M, Shi X et al., 2016. Spatial patterns of net primary productivity of crops in China. Acta Ecologica Sinica, 36(19): 6318-6327. (in Chinese)

[36]
Wehmeyer H, de Guia Annalyn H, Melanie C, 2020. Reduction of fertilizer use in South China: Impacts and implications on smallholder rice farmers. Sustainability, 12(6): doi: 10.3390/su12062240.

DOI

[37]
Williams J, McCool D, Reardon C et al., 2013. Root: Shoot ratios and belowground biomass distribution for Pacific Northwest dryland crops. Journal of Soil and Water Conservation, 68(5): 349-360.

DOI

[38]
Wu H, Ge Y, 2019. Excessive application of fertilizer, agricultural non-point source pollution, and farmers’ policy choice. Sustainability, 11(4): doi: 10.3390/su11041165.

DOI

[39]
Wu Y, Wang E, Miao C, 2019. Fertilizer use in China: The role of agricultural support policies. Sustainability, 11(16): doi: 10.3390/su11164391.

DOI

[40]
Xin L J, Li X B, Tan M H, 2012. Temporal and regional variations of China’s fertilizer consumption by crops during 1998-2008. Journal of Geographical Sciences, 22(4): 643-652.

DOI

[41]
Zeng X M, Fan B J, Xu F S et al., 2012. Effects of modified fertilization technology on the grain yield and nitrogen use efficiency of midseason rice. Field Crops Research, 137: 203-212.

DOI

[42]
Zhang X, Davidson E, Mauzerall D et al., 2015. Managing nitrogen for sustainable development. Nature, 528(7580): 51-59.

DOI

[43]
Zhou J, Xia F, Liu X et al., 2014. Effects of nitrogen fertilizer on the acidification of two typical acid soils in South China. Journal of Soils and Sediments, 14(2): 415-422.

DOI

Outlines

/