
Journal of Geographical Sciences >
The coupling relationship between urbanization and ecological resilience in the Pearl River Delta
|
Wang Shaojian (1986-), Associate Professor, specialized in urban geography and regional development. E-mail: 1987wangshaojian@163.com |
Received date: 2021-03-01
Accepted date: 2021-12-18
Online published: 2022-03-25
Supported by
Ministry of Education Humanities Social Sciences Research Project(21YJAZH087)
Guangdong Special Support Program; Pearl River S&T Nova Program of Guangzhou(201806010187)
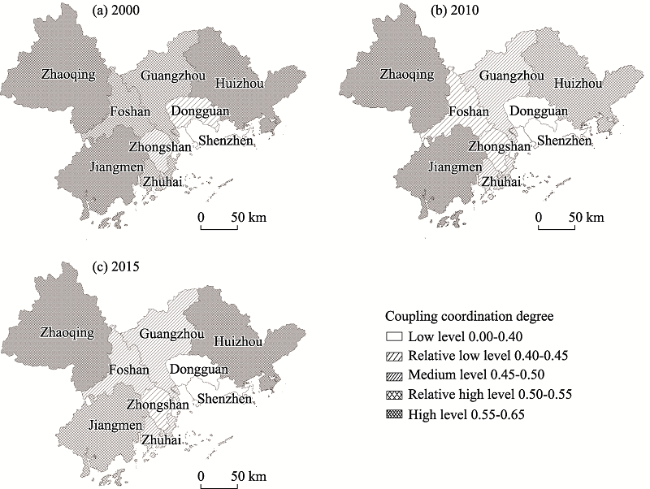
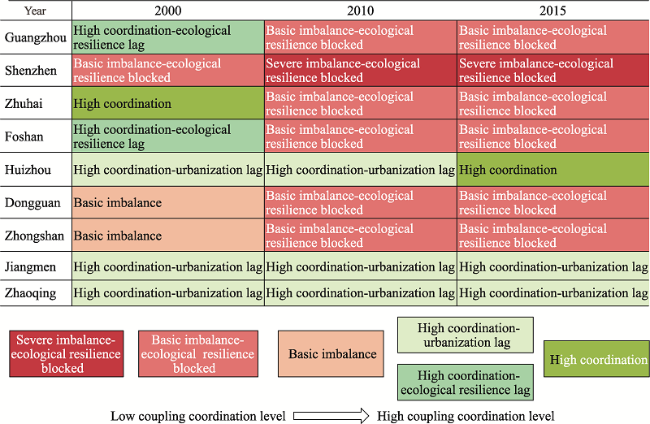
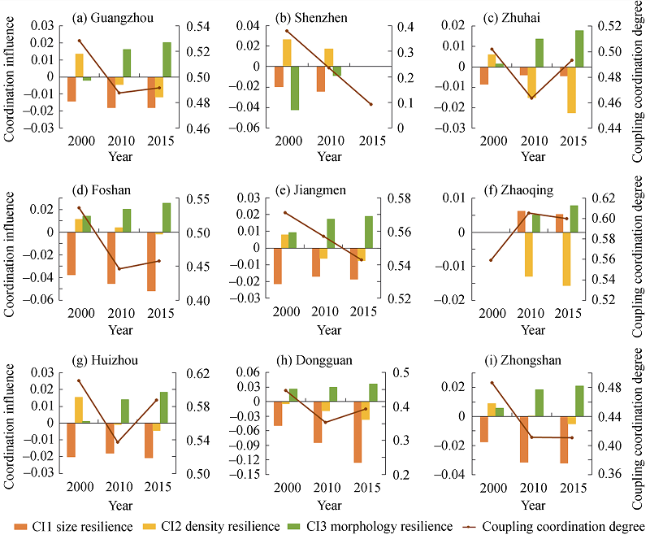
Urban resilience is an emerging research topic of urban studies, and its essence is described by the ability of cities to resist, recover, and adapt to uncertain disturbances. This paper constructs a “Size-Density-Morphology” urban ecological resilience evaluation system, uses a coupling coordination degree model to measure the degree of coupling coordination between urbanization and ecological resilience in the Pearl River Delta from 2000 to 2015, and conducts an in-depth discussion on its spatiotemporal characteristics. The results show the following. (1) From 2000 to 2015, the urbanization level of cities in the study area generally increased while the level of ecological resilience declined. The coupling coordination degree between the two systems decreased from basic coordination to basic imbalance. (2) In terms of spatial distribution, the coupling coordination degree between urbanization and ecological resilience of cities presented a circular pattern that centered on the cities at the estuary of the Pearl River and increased toward the periphery. (3) Ecological resilience sub-systems played variable roles in the coupling coordination between urbanization and ecological resilience. Specifically, size resilience mainly played a reverse blocking role; the influence of morphology resilience was generally positive and continued to increase over time; the effect of density resilience was positive and continued to decline and further became negative after falling below zero. The main pathways for achieving coordinated and sustainable development of future urbanization and ecological resilience in the Pearl River Delta include: leading the coordinated development of regions with new urbanization, improving ecological resilience by strictly observing the three areas and three lines, adapting to ecological carrying capacity, and rationally arranging urban green spaces.
WANG Shaojian , CUI Zitian , LIN Jingjie , XIE Jinyan , SU Kun . The coupling relationship between urbanization and ecological resilience in the Pearl River Delta[J]. Journal of Geographical Sciences, 2022 , 32(1) : 44 -64 . DOI: 10.1007/s11442-022-1935-3
Figure 1 The theoretical mechanism of a coupling relationship between urbanization and ecological resilience |
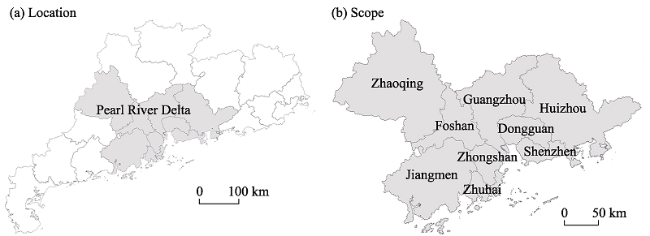
Figure 2 Location and scope of the Pearl River Delta |
Table 1 Balance factors and yield factors of the ecological footprint of the Pearl River Delta |
| Land type | Balance factor ri | Yield factor mj |
|---|---|---|
| Cultivated land | 2.8 | 2.88 |
| Grassland | 0.5 | 1.38 |
| Forest land | 1.1 | 0.88 |
| Fossil fuel land | 0.2 | 2.01 |
| Construction land | 1.1 | 0.00 |
| Water area | 2.8 | 2.88 |
Table 2 The comprehensive indicator system for urbanization |
| First-level indicator | Weight | Secondary indicators | Weight | Effect |
|---|---|---|---|---|
| Demographic urbanization | 0.3316 | Urbanization rate | 0.0548 | + |
| Urban population density | 0.1334 | + | ||
| Proportion of non-agricultural industry employees | 0.0317 | + | ||
| Urban permanent population | 0.1117 | + | ||
| Economic urbanization | 0.6684 | GDP per capita | 0.1311 | + |
| Proportion of secondary industry in GDP | 0.0412 | + | ||
| Proportion of tertiary industry in GDP | 0.0582 | + | ||
| Urban economic density | 0.1428 | + | ||
| Fixed asset investment | 0.2059 | + |
Table 3 The comprehensive indicator system for ecological resilience |
| Indicator | Weight | Effect |
|---|---|---|
| Size resilience | 0.4473 | + |
| Density resilience | 0.3331 | + |
| Morphology resilience | 0.2197 | + |
Table 4 Classification of coupling coordination degree for urbanization and ecological resilience |
| Type | Coupling coordination degree | Sub-type | |
|---|---|---|---|
| High coordination | 0.8<D≤1 | High coordination - urbanization lag | U2-U1>0.1 |
| High coordination - ecological resilience lag | U1-U2>0.1 | ||
| High coordination | $0 \le \left| {{U_1} - {U_2}} \right| \le 0.1$ | ||
| Basic coordination | 0.5<D≤0.8 | Basic coordination - urbanization lag | U2-U1>0.1 |
| Basic coordination - ecological resilience lag | U1-U2>0.1 | ||
| Basic coordination | $0 \le \left| {{U_1} - {U_2}} \right| \le 0.1$ | ||
| Basic imbalance | 0.3<D≤0.5 | Basic imbalance - urbanization blocked | U2-U1>0.1 |
| Basic imbalance - ecological resilience blocked | U1-U2>0.1 | ||
| Basic imbalance | $0 \le \left| {{U_1} - {U_2}} \right| \le 0.1$ | ||
| Severe imbalance | 0<D≤0.3 | Severe imbalance - urbanization blocked | U2-U1>0.1 |
| Severe imbalance - ecological resilience blocked | U1-U2>0.1 | ||
| Severe imbalance | $0 \le \left| {{U_1} - {U_2}} \right| \le 0.1$ |
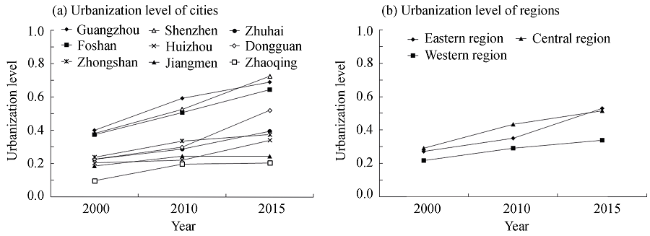
Figure 3 The evolution of urbanization level of cities and regions in the Pearl River Delta, 2000-2015 |
Table 5 Size resilience index of cities in the Pearl River Delta, 2000-2015 |
| City | Construction land area (km2) | Suitable construction land area (km2) | Size resilience | ||||
|---|---|---|---|---|---|---|---|
| 2000 | 2010 | 2015 | 2000 | 2010 | 2015 | ||
| Guangzhou | 708.054 | 1183.540 | 1257.113 | 4417.095 | 6.238 | 3.732 | 3.514 |
| Shenzhen | 493.923 | 746.907 | 772.350 | 1346.315 | 2.726 | 1.803 | 1.743 |
| Zhuhai | 127.323 | 183.679 | 193.981 | 1129.710 | 8.873 | 6.150 | 5.824 |
| Foshan | 491.504 | 967.901 | 1046.979 | 2483.358 | 5.053 | 2.566 | 2.372 |
| Jiangmen | 458.461 | 595.465 | 665.087 | 6248.908 | 13.630 | 10.494 | 9.396 |
| Zhaoqing | 249.645 | 331.106 | 358.134 | 7838.219 | 31.397 | 23.673 | 21.886 |
| Huizhou | 359.835 | 597.613 | 645.415 | 5928.079 | 16.474 | 9.920 | 9.185 |
| Dongguan | 553.752 | 1041.234 | 1079.704 | 1892.422 | 3.417 | 1.817 | 1.753 |
| Zhongshan | 185.572 | 423.043 | 445.965 | 1242.172 | 6.694 | 2.936 | 2.785 |
| Average | 3628.070 | 6070.488 | 6464.728 | 32526.277 | 8.965 | 5.358 | 5.031 |
Table 6 Density resilience index of cities in the Pearl River Delta, 2000-2015 |
| City | Ecological footprint (104 hm2) | Ecological carrying capacity (104 hm2) | Density resilience | ||||||
|---|---|---|---|---|---|---|---|---|---|
| 2000 | 2010 | 2015 | 2000 | 2010 | 2015 | 2000 | 2010 | 2015 | |
| Guangzhou | 828.335 | 1600.175 | 1830.351 | 187.383 | 204.888 | 211.433 | 0.226 | 0.128 | 0.116 |
| Shenzhen | 583.898 | 1305.864 | 1542.616 | 85.245 | 114.950 | 124.777 | 0.146 | 0.088 | 0.081 |
| Zhuhai | 102.959 | 196.610 | 221.536 | 26.824 | 27.562 | 28.101 | 0.261 | 0.140 | 0.127 |
| Foshan | 444.685 | 906.387 | 1007.370 | 105.719 | 117.128 | 117.789 | 0.238 | 0.129 | 0.117 |
| Jiangmen | 329.102 | 560.368 | 612.711 | 149.367 | 151.862 | 151.554 | 0.454 | 0.271 | 0.247 |
| Zhaoqing | 281.183 | 493.816 | 550.362 | 179.090 | 181.967 | 183.276 | 0.637 | 0.368 | 0.333 |
| Huizhou | 267.951 | 579.291 | 644.706 | 156.574 | 165.470 | 166.350 | 0.584 | 0.286 | 0.258 |
| Dongguan | 536.935 | 1035.526 | 1119.012 | 90.103 | 98.743 | 98.375 | 0.168 | 0.095 | 0.088 |
| Zhongshan | 196.900 | 393.157 | 435.127 | 47.506 | 50.535 | 50.971 | 0.241 | 0.129 | 0.117 |
| Average | 3571.948 | 7071.194 | 7963.791 | 1027.811 | 1113.105 | 1132.627 | 0.288 | 0.157 | 0.142 |
Table 7 Morphology resilience index of cities in the Pearl River Delta, 2000-2015 |
| City | Average distance between “source-sink” landscape | Morphology resilience | ||||
|---|---|---|---|---|---|---|
| 2000 | 2010 | 2015 | 2000 | 2010 | 2015 | |
| Guangzhou | 304.297 | 315.923 | 315.239 | 0.815 | 0.785 | 0.786 |
| Shenzhen | 560.833 | 562.260 | 569.518 | 0.442 | 0.441 | 0.435 |
| Zhuhai | 235.261 | 249.900 | 246.287 | 1.054 | 0.992 | 1.006 |
| Foshan | 212.443 | 316.319 | 314.872 | 1.167 | 0.784 | 0.787 |
| Jiangmen | 122.806 | 136.230 | 140.238 | 2.019 | 1.820 | 1.768 |
| Zhaoqing | 98.173 | 119.432 | 118.569 | 2.525 | 2.076 | 2.091 |
| Huizhou | 131.281 | 148.569 | 147.647 | 1.888 | 1.668 | 1.679 |
| Dongguan | 180.442 | 294.512 | 297.585 | 1.374 | 0.842 | 0.833 |
| Zhongshan | 239.535 | 307.397 | 310.544 | 1.035 | 0.806 | 0.798 |
| Average | 247.884 | 295.297 | 294.746 | 1.000 | 0.839 | 0.841 |
Table 8 Ecological resilience index of cities in the Pearl River Delta, 2000-2015 |
| City | Ecological resilience | ||
|---|---|---|---|
| 2000 | 2010 | 2015 | |
| Guangzhou | 0.195 | 0.095 | 0.084 |
| Shenzhen | 0.055 | 0.006 | 0.000 |
| Zhuhai | 0.280 | 0.161 | 0.149 |
| Foshan | 0.221 | 0.078 | 0.068 |
| Jiangmen | 0.569 | 0.391 | 0.355 |
| Zhaoqing | 1.000 | 0.675 | 0.629 |
| Huizhou | 0.676 | 0.376 | 0.349 |
| Dongguan | 0.176 | 0.053 | 0.046 |
| Zhongshan | 0.234 | 0.085 | 0.076 |
| Average | 0.378 | 0.213 | 0.195 |
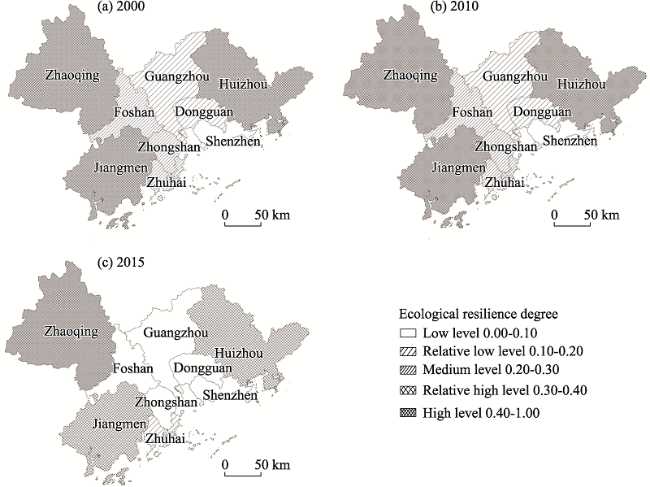
Figure 4 Spatial distribution of ecological resilience level of cities in the Pearl River Delta, 2000-2015 |
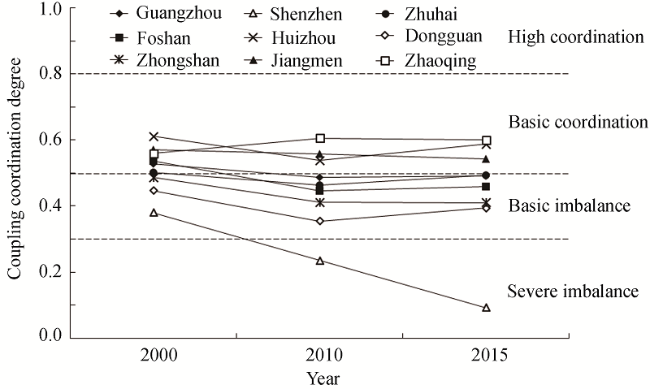
Figure 5 Temporal evolution of coupling coordination degree between urbanization and ecological resilience of cities in the Pearl River Delta, 2000-2015 |
Figure 6 Spatial distribution of coupling coordination degree between urbanization and ecological resilience of cities in the Pearl River Delta, 2000-2015 |
Figure 7 Classification of coupling coordination degree between urbanization and ecological resilience of cities in the Pearl River Delta, 2000-2015 |
Figure 8 Coordination influence of ecological resilience sub-system in the Pearl River Delta, 2000-2015 |
| [1] |
|
| [2] |
|
| [3] |
|
| [4] |
|
| [5] |
|
| [6] |
|
| [7] |
|
| [8] |
|
| [9] |
|
| [10] |
|
| [11] |
|
| [12] |
|
| [13] |
|
| [14] |
|
| [15] |
|
| [16] |
|
| [17] |
|
| [18] |
|
| [19] |
|
| [20] |
|
| [21] |
|
| [22] |
|
| [23] |
|
| [24] |
|
| [25] |
|
| [26] |
Shenzhen Academy of Social Sciences (SASS), 2015. Practice in empirical research of Shenzhen urbanization. in Chinese)
|
| [27] |
|
| [28] |
|
| [29] |
|
| [30] |
|
| [31] |
|
| [32] |
|
| [33] |
|
| [34] |
|
| [35] |
Xinhua News Agency (XNA), 2019. China’s urbanization rate has risen significantly over the past 70 years. 2019-08-15. (in Chinese)
|
| [36] |
|
| [37] |
|
| [38] |
|
| [39] |
|
| [40] |
|
| [41] |
|
| [42] |
|
| [43] |
|
| [44] |
|
| [45] |
|
| [46] |
|
/
| 〈 |
|
〉 |
