Exploring the historical evolution of tourism-environment interaction in protected area: A case study of Mt. Bogda

  • PAN Xumei , 1, 2 ,
  • YANG Zhaoping 1, 2 ,
  • HAN Fang , 1, 2
Expand
  • 1. State Key Laboratory of Desert and Oasis Ecology, Xinjiang Institute of Ecology and Geography, CAS, Urumqi 830011, China
  • 2. University of Chinese Academy of Sciences, Beijing 100049, China
*Han Fang (1982-), PhD and Professor, E-mail:

Pan Xumei (1991-), PhD, specialized in tourism geography, tourism development and protection. E-mail:

Received date: 2020-11-06

  Accepted date: 2021-08-10

  Online published: 2022-03-25

Supported by

National Natural Science Foundation of China(41971192)

Abstract

Protected areas have a double mandate of both “protection” and “use.” Nature- based tourism is considered an effective tool in terms of environmental conservation. Understanding the causes and consequences of a spatiotemporal succession of tourism construction is an important channel to explore the changes of tourism-environment interaction in the protected area. To analyze the spatio-temporal variations in tourism construction lands, we adopted Mt. Bogda as an example. We systematically quantified the interaction between these changes and environmental variables and explored the evolution process of tourism-environment interaction of the mountainous protected area in the northwest arid region. Our results revealed the following: (1) In the Bogda protected area, the proportion of tourism construction lands first appeared to be increasing, then decreasing dramatically, and finally growing slowly. The spatial expansion of tourism construction lands followed the “core-periphery” pattern, respectively showing shapely infilling, reasonable agglomeration, barycenter shift, and outlying growth from 1990 to 2018 as the stages of concentrating on the core. (2) The higher land-use intensity of tourism construction drove the changes of landscape fragmentation, diversity, stability, primitive, and nature degree in the protected area. The coupling coordination between tourism and the environment in the Bogda area decreased at first, and then slowly increased. Meanwhile, tourism did not cause irreversible damage to the natural environment, and the coupling coordination degree between tourism and the environment was still in the state of balanced development. It expressed the states of original balanced, development exceeds environment and barely balanced, and superiorly balanced. The historical evolution of tourism-environment interaction in Bogda reflects the pattern of periodic changes in China’s protected areas to a certain extent.

Cite this article

PAN Xumei , YANG Zhaoping , HAN Fang . Exploring the historical evolution of tourism-environment interaction in protected area: A case study of Mt. Bogda[J]. Journal of Geographical Sciences, 2022 , 32(1) : 177 -192 . DOI: 10.1007/s11442-022-1941-5

1 Introduction

Protected areas (PAs), as defined by the International Union for Conservation of Nature, have a double mandate of both “protection” and “use” (Dudley, 2008; Mayer et al., 2010). Using environmental resources as tourism attractions can bring entrance and lodging fees, which can contribute to local wildlife management capacity and habitat conservation (Wei et al., 2015). In practice, however, these win-win opportunities are not always possible (Defries and Asner, 2004; Li G D et al., 2020). Rapid development of the tourism industry has been found to cause environmental problems, such as increased noise, lower air quality, increased water pollution, and increased biodiversity loss in protected areas (Wang et al., 2014; Wang et al., 2019; Chen et al., 2020). Boori (2014) pointed out that due to an increased number of hikers, the forest area of the Himalayas has been reduced, and soil erosion and other problems have been caused. The same problem also occurred in the Wulingyuan Scenic Area, the Changbai Mountain Nature Reserve, and the Kanasi Nature Reserve (Zhong et al., 2011). Tourism development is largely dependent on a healthy natural environment (Butler, 2000; Giddy and Webb, 2016). Tourist activities and environmental conditions interact in such a way that the former can damage or promote the latter, while the latter can negatively affect the former, leading to a decline in tourist numbers (Zhong et al., 2011). Given that biodiversity and natural landscapes are main tourism attractions, there is an urgent need to develop tools to prevent the negative environmental impacts of tourism-related activities (Butler, 1980; Canteiro et al., 2018).
Policy supervisors and community residents in protected areas have gradually realized the impact of excessive tourism development and have begun to regulate policies to promote healthy and sustainable development. Changes in the tourism-environment relationship in protected areas are manifested in a series of policy adjustments for tourism land use, including spatial expansion and contraction. To facilitate these changes, a large number of studies have been conducted to evaluate the relationship between the environment supply and tourism demand, and clarify the causes and consequences of changing tourism and the environment. Existing studies have found that there are nonlinear relationships between ecological responses and protected land area (DeFries et al., 2007). For example, Gude (2007) found that the Greater Yellowstone Ecosystem adjusted land use patterns by planning an area outside the protected area to develop tourism. Thus, tourism income can be increased, and the integrity and diversity of the ecosystem in the protection area can be guaranteed.
The land-use perspective is an important channel to explore the social, economic, cultural, and ecological construction processes driven by tourism (Xi et al., 2014). In addition, studies have analyzed land-use patterns and ecosystem changes over a long period and proposed that through continuous adjustment of land policies and control of development scale, appropriate tourism development will have positive effects on the local ecological environment (Boori et al., 2014). In China, protected areas have undergone dramatic land-use changes due to tourism development. Liu (2018) found that the area of tourism lands on the Natural Heritage site Jiuzhaigou increased from 606,775 m2 to 806,050 m2 from 2005-2015. Moreover, the drastically expanded area of tourism lands in the Tianjin wetland nature reserve caused a reduction of the wetlands and ecosystem diversity from 1988 to 2008 (Xie et al., 2012). In the coastal areas of Hainan Island (southern China), Wang and Liu (2013) found that tourism development led to a rapid increase in the built-up area, which resulted in a decrease in agricultural land and coastal forests, causing landscape fragmentation and coastal erosion. In the Erhai Lake Basin, construction land increased significantly at the expense of farmland, grassland, and forests. This expansion of tourism lands has caused severe environmental problems (Li J et al., 2020). Changes in the LULC due to protection measures were the driving factors of the variation and the fragmentation in landscape patterns (Wang et al., 2019). Understanding the evolution of protected areas as tourism destinations and the causes and consequences of changing tourism lands is an essential step toward sustainably managing tourism in these critical ecosystems (Wei et al., 2015).
Among the many nature reserves in the arid region of the northwest, Mt. Bogda is particularly unique. It is a National Key Scenic Spot and a National 5A-Class Scenic and Natural Park, and since 1982 it has become one of the most attractive tourist destinations in China. It is also a Man and Biosphere Protected Area, a World Natural Heritage site, and a National Nature Reserve, so conservation policies, including strict policies limiting agricultural reclamation and controlling herders’ grazing behavior, have been implemented. Due to protection regulations, any construction or digging on the land has been forbidden, even if individuals have permission (Liu et al., 2017). It is a place where tourism plays a dominant role in the formation of policies regarding changes in land use, because land use and land cover changes directly impact biotic diversity and natural landscape (Castellani and Sala, 2010). Typical mountain recreation activities in Bogda include trekking, climbing expeditions, and bird gazing, which rely heavily on exceptional natural beauty and vertical mountain zones. Local policy makers should weigh tourism income against ecological outcomes in terms of ecosystem degradation to make good policy decisions (Liu et al., 2006). Due to its unique ecological and socioeconomic characteristics, Mt. Bogda has recently become a typical example of the tropical temperate mountain protected areas in the arid region of the northwest that are threatened by tourism development. To create sustainable development for Mt. Bogda and similar areas, it is necessary to study the tourism-environment interaction in this region specifically.
This study takes Mt. Bogda as a case study, with the aim of (1) identifying land-use transition stages in the tourism development context over the past 30 years; (2) analyzing the effects of land use and land cover changes on the natural landscape and ecosystem at different stages; and (3) discussing the changing process of tourism-environment interaction under the general environment of China’s man-land relationship change.

2 Materials and methods

2.1 Study area

Bogda protected area, a valuable component of the Xinjiang Tianshan World Natural Heritage Site (WNHS) and located 110 km east of Urumqi, has a long history of tourism development. As early as 1982, it was listed as one of the first National Key Scenic Spots, and in 2007, it was assessed as an AAAAA-level scenic spot. In 2018 alone, it attracted 2.7 million tourists and generated 340 million USD. However, the ecosystem of Bogda is extremely sensitive to tourism activities. The research area is shown in Figure 1.
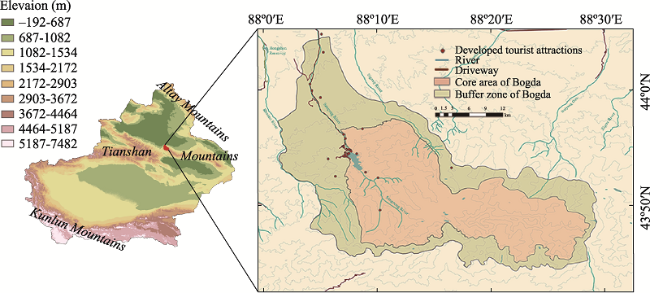
Figure 1 Location of Mt. Bogda on the northern slope of the Tianshan Mountains

2.2 Land use and land cover mapping

Remote sensing maps from 1990 to 2019 were pre-processed by conducting precise geometric registration, radiation calibration, atmospheric correction, multi-source remote image fusion with high accuracy, mosaicking, and cropping. Doing this was helpful in eliminating extraneous information, enhancing detectability, simplifying roll-in and roll-out of data, and ensuring the reliable detection of temporal changes in land cover (Bagan and Yamagata, 2012). ENVI 5.3 software was used for image pre-processing. All images were rejected using the UTM (WGS 1984) coordinate system.
Maps acquired in 1990, 2003, 2009, 2013, and 2018 were selected, and clearly show the evolution of the lands. The different resolution of maps, the small percentage of construction lands, and various tourism facilities make it difficult for traditional classifiers. Classification and regression trees based on multi-source data have advantages in classifying repeatedly with smaller training data and better accuracy (Colstoun et al., 2003; Tooke et al., 2009; Choubin et al., 2018). This is because it can input training data into increasingly homogeneous subsets and produce optimal categories, also called nodes, which maximize the information gained and minimize the error rates in the branches of the tree. During our pre-experiment, this method had a better accuracy and was therefore selected.
To accurately identify construction lands, forest lands, grasslands, glaciers, and bare lands, we chose DEM, NDVI, NOBI, MNDWI, and the results of support vector machines as our reference data. The spectral indicators of NDVI, NOBI, and MNDWI (calculated with the following equations) can strengthen the difference between architecture, water, forest, grassland, and other types of land, and improve the accuracy of classification results (Julien et al., 2006). Based on the reference data, the classification and regression tree models recursively partition the sample data to create a hierarchical binary tree and subdivide the prediction space into regions where the values of the response variable are similar (Choubin et al., 2018). The technical process mainly consists of remote sensing information extraction, sample training, decision tree establishment, and execution.
${\rm{NDVI = }}\frac{{{\rm{Nir}} - {\rm{Red}}}}{{{\rm{Nir}} + {\rm{Red}}}}$
${\rm{NDBI = }}\frac{{{\rm{Nir}} - {\rm{Mir}}}}{{{\rm{Nir}} + {\rm{Mir}}}}$
${\rm{MNDWI = }}\frac{{{\rm{Green}} - {\rm{Mir}}}}{{{\rm{Green}} + {\rm{Mir}}}}$
where Mir, Nir, and Green represent bands with different wavelengths. Based on field investigation, we delineated six classes (construction lands, water bodies, forests, grasslands, glaciers, and bare lands) for Mt. Bogda and used the current official land-use classification system (GB/T21010-2007) as a reference. Historic remote sensing maps of Google Maps were used to correct the classified land use and land cover images.

2.3 The coupling coordination model between tourism and the environment

The time series of remote sensing data of Mt. Bogda revealed that the construction land-use changes occurred in a rapid and abrupt manner. Such short-term changes have an important impact on ecosystem processes (Liu et al., 2016), and are followed by a quick recovery of ecosystems or a non-equilibrium trajectory (Eric and Helmut, 2006; Yang et al., 2019). A system is composed of a tourism subsystem, which can be defined as a coupling system, in which the coordination of the relationship is elementary to realize sustainable tourism development (Georges and Tanguay, 2010; Yi and Fang, 2014). According to the conceptual framework and implications of the coupling system, the degree between two subsystems can be measured using an aggregated index system (Zi, 2015).
Based on previous studies on coupling coordinated evaluation models between the environment and tourism on geoparks (Yi et al., 2014), tourism resources (Cheng et al., 2017), low-carbon city (Amelung et al., 2016; Cong et al., 2019; Wang et al., 2019; Geng et al., 2020; Lai et al., 2020), and ecotourism in nature reserves (Bennett and Mcginnis, 2008; Marcelo et al., 2018; Wang et al., 2020), a preliminary determination of the indexes of the tourism-environment system was made. Then, the critical indicators were further selected through correlation analysis and qualitative analysis, with the aim to gain an in-depth understanding of the coupling relationship between tourism and the environment and determine the interaction effects among these factors. Finally, an aggregated index system consisting of two hierarchies, five aspects, and 15 indicators was established (Table 1).
Table 1 Evaluation indicators system of coupling coordination between tourism and the environment
Subsystem First-class
index
Second-class index Weight Description
Tourism
T(x)
Tourism
scale
Number of maximum daily tourists (x1, +) 0.159 Reflecting the scale of tourism
Developed tourism attractions (x2, +) 0.164 Reflecting the intensity of tourists’ activities
Road density (x3, +) 0.103 Reflecting the activity area for tourists
Floor area ratio (x4, +) 0.127 Reflecting the scale of tourism facilities
Expansion intensity index (x5, +) 0.061 Reflecting the expansion intensity of tourism lands at different stages
Tourism
income
Tourism income from tickets (x6, +) 0.156 Reflecting the level of funds available for environmental protection in the protected area
Total tourism incomes except ticket (x7, +) 0.230 Reflecting the economic benefit of locals for tourism industry
Environment
E(y)
Pressure Air pollution index (y1, -) 0.054 Reflecting the pollution pressure from harmful gas emissions
Water pollution index (y2, -) 0.168 Reflecting the pollution pressure from water pollutants discharge
State Infrastructure fragmentation index (y3, -) 0.109 Reflecting the fragmented degree of ecosystem at a certain period of time
Shannon-Wiener index (y4, +) 0.110 Reflecting the landscape diversity degree of ecosystem at a certain period of time
Contagion (y5, +) 0.092 Reflecting the stability degree of ecosystem at a certain period of time
Aggregation index (y6, +) 0.148 Reflecting the primitive and nature degree of ecosystem at a certain period of time
Response Natural disasters (y7, -) 0.184 Reflecting the occurrence of debris flow, flood, collapse, and landslide disasters
Area of lake shrinkage (y8, -) 0.136 Reflecting the interference degree of the lakes
In the tourism subsystem, the dimension of the tourism scale represents the integral size of the tourism industry, including the indicators of the number of maximum daily tourists, road density, area of construction lands, and expansion intensity, all of which reflect the benefits and monetary status of the tourism industry, including the indicators of tourism income from tickets and total tourism income. The environmental subsystem, based on the pressure-state-response model, consists of three dimensions. The dimension of pressure reflects the pollution stress, including the indicators of the air pollution and water pollution indexes. The dimension of the state reflects the fragmentation, biological diversity, stability, and primitive nature of the ecosystem, including the indicators of the infrastructure fragmentation index, the Shannon-Wiener index, contagion, and the aggregation index. The dimension of the environmental response reflects the occurrence of debris flows, floods, collapses, and landslide disasters. The calculation formulas of the above indicators have been detailed in previous studies (Davide and Dorje, 2009; Xi et al., 2014; Yi et al., 2014; Yi and Fang, 2014; Alphan, 2017; Wang et al., 2019; Liu et al., 2020; Zhang and Li, 2020; Li et al., 2021).
The method of TOPSIS and information entropy is used to determine the index weights of the tourism and environmental subsystems of the Bogda area. Analyzing the correlation degree and information among indexes can, to a certain extent, avoid bias caused by subjective influence. The steps are 1) data normalization using the min-max normalization method, 2) calculating the proportion and information entry of indexes, and 3) calculating the weight of the indexes.
Suppose that xi (i=1, 2, 3……) represent the standardized indicators of the tourism subsystem and yj (i=1, 2, 3……) represent the indicators of the environmental subsystem. Thus,
$T{\rm{(}}x{\rm{) = }}\sum\nolimits_{i = 1}^N {{W_i}} \times {x_i}$
$E{\rm{(}}y{\rm{) = }}\sum\nolimits_{j = 1}^N {{W_j}} \times {y_j}$
where T(x) is the comprehensive development level value of the tourism industry, E(y) is the ecological environment, and Wi and Wj are the weights of xi and yj, respectively, calculated by the TOPSIS & Information Entropy weight.
Based on the coupling in physics and previous studies, the coupling coordination degree model is established, which can measure whether the internal systems of the system are in harmony with each other in the development process. It is calculated using the following formulas:
$D = \sqrt {C \times T}$
$C = {\left\{ {\frac{{T(x) \times E(y)}}{{{{\left( {\frac{{T(x) \times E(y)}}{2}} \right)}^2}}}} \right\}^{\frac{1}{2}}}$
$T = \alpha \times T(x){\rm{ + }}\beta \times E(y)$
where D represents the degree of coupling coordination interactions between tourism and the environment, $D \in [0,1]$; C is the degree of the comprehensive development; and T is the comprehensive evaluation index. According to previous studies about Heilongjiang province, the Yangtze River Economic Zone, and the city of Lijiang, the undetermined coefficients of tourism and environment are equal to α=β=0.5. The level of their coupling coordination degree is presented in Table 2 to show the coordinated development of tourism and the environment.
Table 2 The classification standard of coupling coordination types
Class Subclass Coupling coordination degree (D)
Balanced development Superiorly balanced development 0.8<D≤1
Favorably balanced development 0.6<D≤0.8
Transitional development Barely balanced development 0.5<D≤0.6
Slightly unbalanced development 0.4<D≤0.5
Unbalanced development Moderately unbalanced development 0.2<D≤0.4
Seriously unbalanced development 0<D≤0.2

Source: Zi Tang (2015).

2.4 Data processing and analysis

The data of land use and land cover maps require field survey data and remote sensing images. Two field surveys were completed in the study: the first took place from July 5 to July 13, 2018, and the second from July 10 to July 18, 2019. We consulted 15 residents and 3 administrators of the Tianchi Nature Reserve Management Committee to collect information on land use and the tourism industry from 1984 to 2018. Based on field research and Google Earth images, it was found that tourism construction land has undergone tremendous changes in 3003, 2009, and 2013. Therefore, remote sensing images of 1990, 2003, 2009, 2013 and 2018 were selected to map the land use pattern to show the evolution of the tourism land pattern from 1990 to 2018 (Table 3).
Table 3 Information about remote sensing images used in this study
Year Date Path/Row Sensor Cloud cover (%)
1990 - 45/40 Landsat Global Synthesis data -
2003 2003-08-10 142/29 Landsat 5 TM 0.01
2003-08-10 142/30 Landsat 5 TM 0.37
2009 2009-08-18 142/29 Landsat 7 ETN + SLC-off 8.44
2009-08-18 142/30 Landsat 7 ETN + SLC-off 13.57
2013 2013-07-04 142/29 Landsat 8 OLI/TIRS 1.07
2013-07-04 142/30 Landsat 8 OLI/TIRS 6.29
2018 2018-09-04 142/29 Landsat 8 OLI/TIRS 1.34
2018-09-04 142/30 Landsat 8 OLI/TIRS 3.51
The data of coupling coordination model required land use and land cover maps and socio-economic data are listed in Table 3. The land use and land cover maps provide data of landscape vulnerability, diversity, stability, primitive and nature degree, and interference degree, which are difficult to obtain in actual surveys. These data were calculated by the software of Fragstats and ArcGIS. The socio-economic data were used to evaluate the intensity of tourism industry. All the spatial data for coupling coordination model and other relevant data collected for this study are listed in Table 4.
Table 4 The list of data sources
Data Data sources
Xinjiang administrative map, Bogda boundary, traffic and river system vector data Xinjiang Uygur Autonomous Region Bureau of Surveying and Mapping of Geographic Information
Tourist data, tourism income, tourism attractions, added or demolished construction area of Tianchi Xinjiang Cultural Tourism Bureau
Air condition and water quality Changji Environmental Protection Department
Digital elevation data (DEM) Geospatial Data Cloud
China land use/land cover data Resource and Environment Data Cloud Platform
Historic remote sensing maps Google Earth
The methodology of this study is based on the evaluation of construction lands changes, LULC analysis and coupling coordination model between tourism and the environment of Mt. Bogda using remote-sensing data analysis, GIS, CART, TOPSIS and information entropy methods as shown in Figure 2, which will be discussed in detail in the following sections.
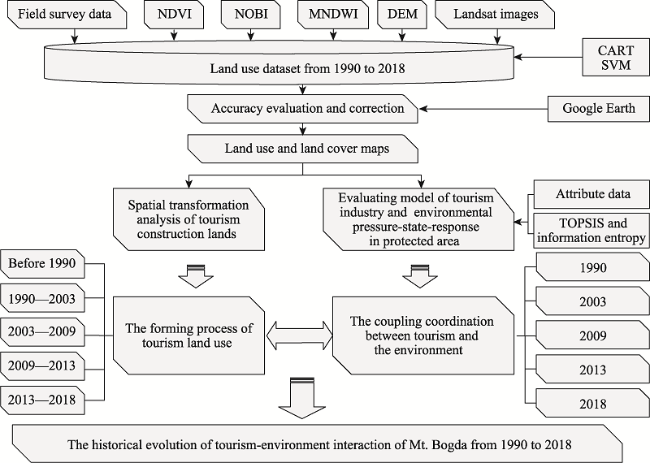
Figure 2 Overview of the methodology of the study

3 Results

3.1 The spatiotemporal succession of tourism lands

Through careful analysis of remote sensing maps of the Bogda area from 1990 to 2020, it was found that construction lands underwent significant changes in 2003, 2009, and 2013, and were stabilized in 2018. As shown in Table 5, the construction land area of Mt. Bogda increased by 409.39% (from 383,400 m2 to 1,953,000 m2) from 1990-2018. The largest expansion, approximately 540.61% or 2,072,700 m2, occurred during 1990-2003. In the core area of Bogda, the construction land area decreased from 289,888 m2 in 1990 to 61,876 m2 in 2018. And the ratio of tourism lands decreased from 75.61% to 3.17%. In the buffer zone, the construction land area increased from 93,512 m2 in 1990 to 1,891,124 m2 in 2018. The ratio of tourism lands increased from 24.39% to 96.83% (Table 5).
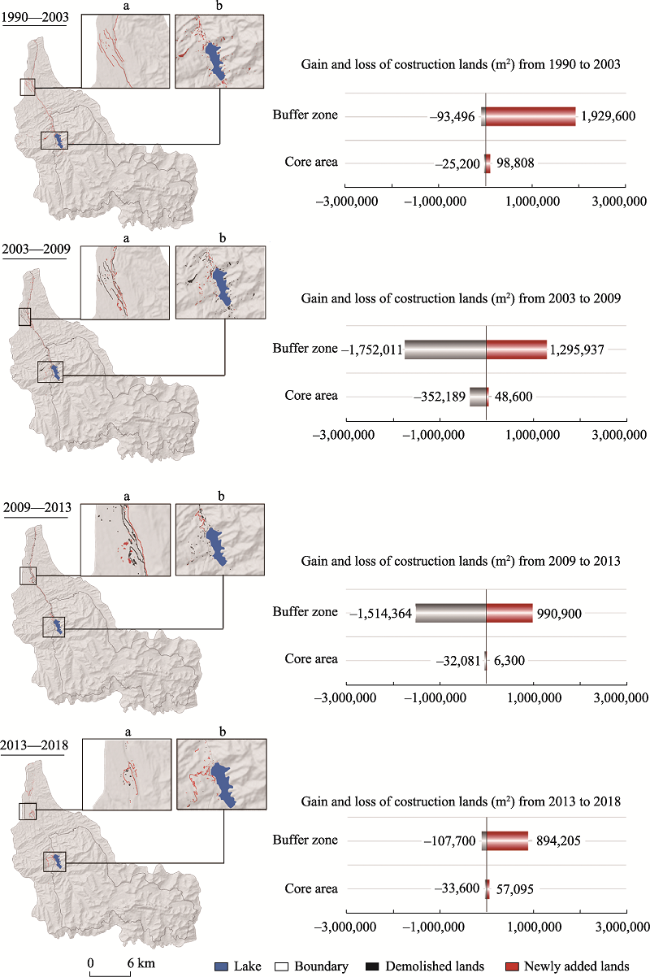
Table 5 The distribution of construction lands in the core area and the buffer zone of Bogda
Phases Area of tourism construction lands
Core area (m2) Ratio (%) Buffer zone (m2) Ratio (%)
1990 289,888 75.61 93,512 24.39
2003 363,496 14.80 2,092,631 85.20
2009 59,907 3.53 1,636,593 96.47
2013 38,381 3.36 1,104,619 96.64
2018 61,876 3.17 1,891,124 96.83
Table 6 The formation of construction lands from 1990 to 2018
Periods Core area (m2) Buffer zone (m2) Total expansion area (m2) Annual increasing rate (%)
P1 (1990-2003) 98,008 1,929,600 2,028,408 41.59
P2 (2003-2009) -303,589 -456,038 -759,600 -5.155
P3 (2009-2013) -21,526 -531,974 -553,500 -8.156
P4 (2013-2018) 23,495 786,505 810,000 14.17
Historical (1990-2018) -228,012 1,797,612 1,569,600 14.62
As seen in Figure 3, the horizontal transformation of Bogda from 1990-2018 followed the “core-periphery” pattern, in which once-concentrated tourism construction lands gradually moved out and formed a two-core tourism land spatial structure.
Figure 3 The spatial transformation of construction lands in the Bogda area from 1990-2018. The most obvious changes represent (a) Sangong River valley and (b) Tianchi Lake. The buffer zone and the core area of Bogda are shown in Figure 1.
Before 1990, tourism construction lands were distributed near Tianchi Lake, the core area of the Bogda-protected area. There were 289,888 m2 of nearby building facilities, accounting for 75.61% of the total area of the building facilities. From 1990-2003, a sharply increasing number of visitors and giant profits for developing tourism led to changes in the land use structure, and Tianchi Lake became the center of tourism related buildings. A sanatorium, resort hotels, and recreational facilities were densely gathered along Tianchi Lake. The newly increased construction land area was 73,581 m2. Meanwhile, additional construction lands were appearing in the Sangong valley, the buffer zone of the protected area. The newly increased construction land in the buffer zone was 1,999,119 m2.
From 2003-2009, the local government realized the urgency to protect the environment in Bogda and carried out three types of ecological protection projects: controlling live stock grazing scope, demolishing unreasonable facilities, and building ecological infrastructure for tourists. The tourism industry had caused massive demolition, leaving only the buildings in Haixi and Haibei, parts of Tianchi lakeside, accounting for about 303,562 m2 of land area. To balance between developing tourism and protecting the ecosystem, the local government attempted to build eco-tourism facilities in the Sangong valley. The scale of construction in the core area decreased. The ratios of the core area and buffer zone were 3.53% and 96.47%, respectively.
From 2009-2013, the local government initiated projects to reform tourism services around East Tianchi, West Tianchi, and Feilongjian. In addition, an increasing number of tourism facilities appeared in the Sangong valley. The tourism exploitation focus was transferred from the heritage site to the buffer zone, and the proportion of the construction lands in the core area continued to decline. The ratios of the core area and buffer zone were 3.36% and 96.64%, respectively. Tourism function spatial distribution tended to agglomerate in a primary center, the Tianchi Lake, and a secondary center, the Sangong valley.
From 2013-2018, the Bogda area became a World Nature Heritage Site, became the most popular tourist destination in China and attracted millions of tourists annually. The expected return for developing tourism substantially increased. Constraints from vulnerable ecosystems pushed local governments to upgrade tourism products and improve the efficiency of tourism land use. There were 630,000 m2 of newly added construction land during this time period, and the construction lands in the core area decreased. The ratios of the core area and buffer zone were 3.17% and 96.83%, respectively. Tourist function spatial distribution agglomerated in two primary centers, Tianchi Lake and the Sangong valley, and the expansion scale of Sangong valley was the larger of the two.

3.2 The coupling coordination between tourism and the environment

As shown in Figures 4 and 5, the coupling coordination between tourism and the environment in the Bogda area decreased at first, and then slowly increased. And the class of coupling coordination moved from balanced development to transitional development, then to balanced development (Table 7).
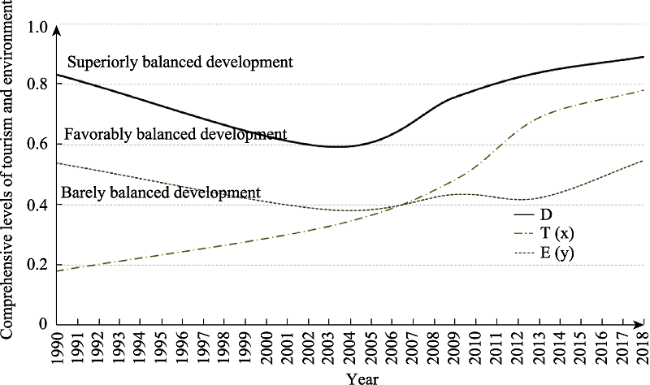
Figure 4 Comprehensive levels of tourism and environment in the Bogda area from 1990 to 2018
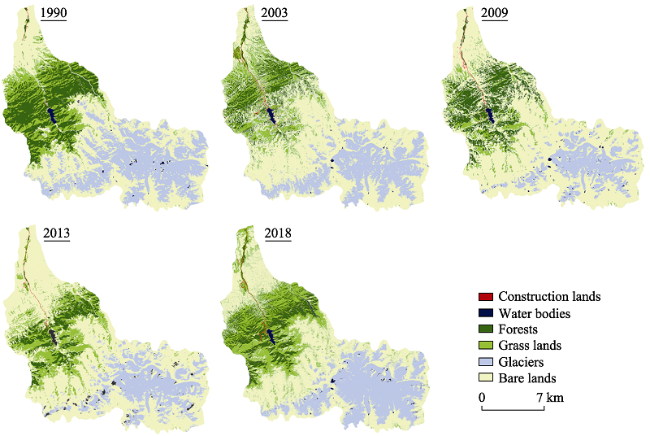
Figure 5 Changes in landscape patterns of the Bogda area from 1990 to 2018
Table 7 Tourism-environment interaction changes
Timeline Tourists’ activities Development
intensity
Cognition of land Coupling coordination
Before 1990 Agriculture, grazing, scientific investigation, adventure tourism Low Primitive adapters of land Original balanced
1990-2003 Agriculture, grazing, sightseeing, recreational, adventure tourism, and tourism catering High Actively transformer of land Development exceeds environment (barely
balanced)
2003-2013 Agriculture, grazing, sightseeing, recreational, adventure tourism, and tourism commerce Low Land was not a generous giver and gave ecological constraints. Exploring a balanced relationship
2013-2018 Agriculture, grazing, eco-tourism, wellness tourism, skiing tourism, and tourism commerce Middle Value the environmental carrying capacity Superiorly balanced
Before 1990, the number of tourists was small, and the intensity of tourism development and construction was low. Therefore, there was a balance between tourism and the natural environment, and tourism development did not cause great pressure on the environment. The degree of tourism development was 0.18, while that of the environment was 0.54. There was a more stable ecosystem before 1990 than in any later period, with a contagion of 61.56.
In the period of 1990-2003, the degree of coupling coordination between tourism and the environment decreased, from a favorably balanced to barely balanced. The degree of the environment decreased from 0.54 in 1990 to 0.38 in 2003. Unregulated overgrazed area and large-scale construction of tourism facilities disrupted the mountain ecosystem, as shown by the decline in stability and diversity. The contagion decreased from 61.56 to 55.44 and the Shannon-Wiener index decreased from 1.04 to 0.77.
From 2003-2018, the degree of coupling coordination between tourism and the environment increased slowly. From 2003-2009, the number of tourists grew, while the tourism lands shrunk. Meanwhile, the local government’s measures, such as the demolition of facilities and the implementation of ecological restoration projects, played a certain role in alleviating the conflict between tourism development and environmental protection. The degree of environment increased from 0.38 to 0.43. From 2009-2013, the local government restricted the scope of infrastructure land and shifted the constructing barycenter of tourism facilities. A decrease in patch density and an increase in the largest patch index indicated that fragmentation of the whole landscape was further reduced. The stability of the ecosystem was reinforced, with an increase in contagion, from 58.54 to 60.44. From 2013-2018, the coupling coordination degree between tourism and the environment in the Bogda area started entering the stage of superiorly balanced development. The fragmentation of the whole landscape was reduced, with a decrease in patch density and an increase in the mean patch size of landscape patches.

4 Discussion and conclusions

4.1 Discussion

Long-term monitoring of the spatial changes of construction lands in the Bogda area showed that tourism development influences the ecosystem and accelerates the evolution process of tourism-environment interaction. The higher land-use intensity of tourism construction influenced the landscape fragmentation, diversity, stability, primitive, and nature degree in protected areas, as suggested in previous research (Xie et al., 2012; Huong et al., 2014; Mao et al., 2014; Yuan and Fan, 2018; Li G D et al., 2020). However, tourism development might not have been the main driver of the degradation of the Bogda area ecosystem, as shown by the following two reasons. (1) From 1990-2018, the coupling coordination degree between tourism and the environment of Mt. Bogda was mainly in a balanced development state, and it was only in the transitional development state around 2003. (2) In 2003, locals heavily relied on animal husbandry to meet their domestic needs and increase their income. Grazing land accounted for 57% of the Bogda area. Overgrazing led to a reduction in pastoral area and the degradation of vegetation coverage (Shi and Wang, 2005; Shi et al., 2013; Niu et al., 2015). In addition, excessive deforestation during this period had a negative impact on the ecological environment (Chen et al., 2011). From 2005, the local government gradually implemented policies such as ecological migration, animal husbandry equal to the amount of grass, and grazing prohibition.
The relationship between tourism and the environment in the Bogda area reflected the pattern of periodic changes in all of China: almost unconscious, unity between humans and the environment, mutual matching of human and environment, superior human than environment, and coexisting harmoniously with humans and the environment (Li et al., 2018; Shi et al., 2019). The tourism policies of the Bogda area played an important role in reconciling the conflict between environmental protection and tourism development. The daily operation funds of the Bogda protected area are allocated by the Fukang City Finance, which supports the finding that financial support for protected areas from local governments is crucial (James et al., 2014). In addition to local governments’ support, a part of the ticket revenue is used for ecological protection in the reserve. Studies have found that scientific and reasonable land use policies help alleviate the contradictory relationship between the development and the protection of ecologically vulnerable areas (Li et al., 2008; Yi and Fang, 2014; Liu et al., 2015; Liu et al., 2018; Natalie et al., 2018). In Bogda, policies were made to reduce the construction scale of tourism facilities in the core area and increase the number of tourism facilities in the outer areas.
In addition to tourism policy, a series of ecological recovery projects have been implemented in an effort to improve ecosystem services. Long-term artificial afforestation effectively improved the vegetation coverage rate and reduced the impact of bare surfaces on the environment (He et al., 2010). New insights into both theoretical and practical actions indicate that forest and grassland restoration contributed to interactions between biodiversity and ecosystem services (Jasper et al., 2018). In addition, most of the locals relocated outside of the protected area due to the eco-migration project, which has reduced the need for and impacts of human activities on farming and grazing. Such ecological recovery has contributed to reducing the negative influence on the environment from tourism development and overgrazing, which could provide a reference for ecosystem management in ecologically vulnerable areas to reconcile land use conflicts (Zhang et al., 2020). However, residents who resettled from the core area of Bogda expressed negative feedback about their present living conditions, due to transformation in traditional lifestyle (Liu et al., 2017). This issue should be addressed in future studies.

4.2 Conclusions

PAs have a double mandate of both environmental protection and economic development. In practice, the rapid development of the tourism industry and large-scale land-use changes were found to cause increasing environmental problems, such as increasing noise, declining air quality, increasing water pollution, and increasing biodiversity loss in the protected area. Understanding the evolution of protected areas as tourism destinations and the causes and consequences of changing tourism is an essential step toward sustainably managing tourism in these critical ecosystems. In this paper, we took Mt. Bogda as an example to analyze the spatio-temporal variations in tourism lands and systematically quantify the interaction between these changes and environmental variables of mountainous protected areas in the northwest arid region. The main conclusions are as follows: (1) In the Bogda-protected area, the proportion of tourism lands first increased and decreased dramatically, and then slowly grew. From 1990-2018, the spatial expansion of tourism construction lands followed the “core-periphery” pattern, with a concentration in the core area, shapely infilling, reasonable agglomeration, a barycenter shift, and outlying growth. (2) The higher land-use intensity of tourism construction drove the changes in landscape fragmentation, diversity, stability, primitive and nature degree in protected areas. The coupling coordination between tourism and the environment in the Bogda area decreased at first, and then slowly increased. Meanwhile, tourism did not cause irreversible damage to the natural environment, and the degree of coupling coordination between the environment and tourism was still in a state of balanced development. It expresses the states of the original balanced, development exceeds the environment, and is barely balanced and superiorly balanced.
Tourism development and land-use changes are linked to multiple environmental variables. This study demonstrated the reasonable tourism development has a positive impact on the environment, by implementing policies such as the regularization of tourism land-use patterns, ecological migration, animal husbandry equal to the amount of grass, and grazing prohibition. But at the same time, the sustainable development of Mt. Bogda will continue to be threatened by many factors, such as negative feedback from local residents. Therefore, the factors behind land-use change should be considered as a priority in future land use management. Besides that, land-use change drivers can differ between cases, so the causal relationships between these drivers and land-use changes should also be further addressed.
[1]
Alphan H, 2017. Analysis of landscape changes as an indicator for environmental monitoring. Environmental Monitoring and Assessment, 189(1): 1-24.

DOI

[2]
Amelung B, Student J, Nicholls S et al., 2016. The value of agent-based modelling for assessing tourism-environment interactions in the Anthropocene. Current Opinion in Environmental Sustainability, 23(12): 46-53.

DOI

[3]
Bagan H, Yamagata Y, 2012. Landsat analysis of urban growth: How Tokyo became the world’s largest megacity during the last 40 years. Remote Sensing of Environment, 127(4): 210-222.

DOI

[4]
Bennett D, Mcginnis D, 2008. Coupled and complex: Human-environment interaction in the Greater Yellowstone Ecosystem, USA. Geoforum, 39(2): 833-845.

DOI

[5]
Boori M S, VoEnílek V, Chou D H K, 2014. Land use/cover disturbance due to tourism in Jeseníky Mountain, Czech Republic: A remote sensing and GIS based approach. Egyptian Journal of Remote Sensing and Space Science, 23(1): 17-26.

[6]
Butler R W, 1980. The concept of a tourism area cycle of evolution: Implications for management of resources. Canadian Geographer, 24: 5-12.

DOI

[7]
Butler R W, 2000. Tourism and the environment: A geographical perspective. Tourism Geographies, 2(3): 337-358.

DOI

[8]
Canteiro M, Cόrdova-Tapia F, Alejandro B, 2018. Tourism impact assessment: A tool to evaluate the environmental impacts of touristic activities in natural protected areas. Tourism Management Perspectives, 28: 220-227.

DOI

[9]
Castellani V, Sala S, 2010. Sustainable performance index for tourism policy development. Tourism Management, 31(6): 871-880.

DOI

[10]
Chen Q H, Chen H, Zhang J et al., 2020. Impacts of climate change and LULC change on runoff in the Jinsha River Basin. Journal of Geographical Sciences, 30(1): 85-102.

DOI

[11]
Chen S H, Su G L, Gao F, 2011. Trends and countermeasures of resource and environment change of Tianchi Lake in Xinjiang Tianshan Mountains. Forestry Construction, (3): 63-64. (in Chinese)

[12]
Cheng Y, Ren J L, Hou C G et al., 2017. Meaning of space balance and assessing the state of the coastal ecological regions: A case of the Yellow River Delta Efficient Ecological Economic Zone. Scientia Geographica Sinica, 37(1): 83-91. (in Chinese)

DOI

[13]
Choubin B, Darabi H, Rahmati O et al., 2018. River suspended sediment modelling using the CART model: A comparative study of machine learning techniques. Science of The Total Environment, 615: 272-281.

DOI

[14]
Colstoun E, Story M H, Thompson C et al., 2003. National park vegetation mapping using multi-temporal LANDSAT 7 data and a decision tree classifier. Remote Sensing of Environment, 85(3): 316-327.

DOI

[15]
Cong X, Huang Y, Liu J, 2019. Spatiotemporal evolution of coupling coordination degree between ecotourism and tourism environment in Jilin Province. Scientia Geographica Sinica, 39(3): 496-505. (in Chinese)

[16]
Davide G, Dorje D, 2009. Environmental impact assessment of mountain tourism in developing regions: A study in Ladakh, Indian Himalaya. Environmental Impact Assessment Review, 29(4): 229-242.

DOI

[17]
Defries R, Hansen A, Turner B L et al., 2007. Land use change around protected areas: Management to balance human needs and ecological function. Ecological Applications, 17(4): 1031-1038.

DOI

[18]
Defries R S, Asner F, 2004. Land‐use choices: Balancing human needs and ecosystem function. Frontiers in Ecology & the Environment, 2(5): 249-257.

[19]
Dudley N, 2008. Guidelines for Applying Protected Area Management Categories. IUCN, 3-4.

[20]
Eric F L, Helmut J G, 2006. Land-Use and Land-Cover Change:Local Processes and Global Impacts. Berlin Heidelberg New York, 105-112.

[21]
Geng Y Q, Wei Z J, Zhang H et al., 2020. Analysis and prediction of the coupling coordination relationship between tourism and air environment: Yangtze River Economic Zone in China as example. Discrete Dynamics in Nature and Society, 10: 1-15.

[22]
Georges A T, Juste R, Jean F L et al., 2010. Measuring the sustainability of cities: An analysis of the use of local indicators. Ecological Indicators: Integrating, Monitoring, Assessment and Management, 10(2): 407-418.

[23]
Giddy J K, Webb L N, 2016. The influence of the environment on adventure tourism: From motivations to experiences. Current Issue in Tourism, 21(12): 1-15.

[24]
Gude P H, Hansen A J, Jones D A, 2007. Biodiversity consequences of alternative future land use scenarios in Greater Yellowstone. Ecological Applications, 17(4): 1004-1018.

DOI

[25]
He J, Yang W, Yan L et al., 2010. Study on the ecological landscape restoration for the Tianchi Lake Nature Reserve in Xinjiang, China. Journal of Chengdu University of Technology (Science & Technology Edition), 37(2): 181-187. (in Chinese)

[26]
Huong T T H, Veerle V, Anton V R et al., 2014. Changing human-landscape interactions after development of tourism in the northern Vietnamese Highlands. Anthropocene, 8(3): 42-51.

[27]
James E M W, Nigel D, Daniel B S et al., 2014. The performance and potential of protected areas. Nature, 515(7525): 67-73.

DOI

[28]
Jasper H, Peter G, Frank V, 2018. Understanding the historical institutional context by using content analysis of local policy and planning documents: Assessing the interactions between tourism and landscape on the Island of Terschelling in the Wadden Sea Region. Tourism Management, 66(7): 180-190.

DOI

[29]
Julien Y, Sobrino J A, Verhoef W, 2006. Changes in land surface temperatures and NDVI values over Europe between 1982 and 1999. Remote Sensing of Environment, 103(1): 43-55.

DOI

[30]
Lai Z Z, Ge D M, Xia H B et al., 2020. Coupling coordination between environment, economy and tourism: A case study of China. PLOS ONE, 15(2): e0228426.

DOI

[31]
Li G D, Zhang J H, Mirzaei P A et al., 2020. Monitoring thermal field, humidity field and energy balance over heterogeneous surfaces in the typical valley-city. Journal of Geographical Sciences, 30(12): 2015-2032.

DOI

[32]
Li J, Bai Y, Alatalo J M, 2020. Impacts of rural tourism-driven land use change on ecosystems services provision in Erhai Lake Basin, China. Ecosystem Services, 42: 101081.

DOI

[33]
Li M M, Wu B H, Cai L P, 2008. Tourism development of world heritage sites in China: A geographic perspective. Tourism Management, 29(2): 308-319.

DOI

[34]
Li W L, Kuang W H, Lu J et al., 2021. Adaptive evolution mechanism of rural human-land system in farming-and-pastoral areas of northern China. Acta Geographica Sinica, 76(2): 487-502. (in Chinese)

[35]
Li X Y, Yang Y, Liu Y, 2018. The evolution process and its mechanism of man-land relationship in China. Geographical Research, 37(8): 1495-1514. (in Chinese)

[36]
Liu J, Wang J, Wang S et al., 2018. Analysis and simulation of the spatiotemporal evolution pattern of tourism lands at the Natural World Heritage Site Jiuzhaigou, China. Habitat International, 7(5): 74-88.

[37]
Liu J, Zou C, Gao J et al., 2015. Location determination of ecologically vulnerable regions in China. Biodiversity Science, 23(6): 725-732.

DOI

[38]
Liu J Y, Shao Q Q, Yan X D et al., 2016. The climatic impacts of land use and land cover change compared among countries. Journal of Geographical Sciences, 26(7): 889-903.

DOI

[39]
Liu Q, Yang Z P, Wang F, 2017. Conservation policy-community conflicts: A case study from Bogda Nature Reserve, China. Sustainability, 9(8): 1291-1306.

DOI

[40]
Liu X L, Yang Z P, Xie T, 2006. Development and conservation of glacier tourist resources: A case study of Bogda Glacier Park. Chinese Geographical Science, 16(4): 365-370.

DOI

[41]
Liu Y X, Fu B J, Wang S et al., 2020. Research progress of human-earth system dynamics based on spatial resilience theory. Acta Geographica Sinica, 75(5): 891-903. (in Chinese)

[42]
Mao X Y, Meng J J, Wang Q, 2014. Tourism and land transformation: A case study of the Li River Basin, Guilin, China. Journal of Mountain Science, 6: 1606-1619.

[43]
Mayer M, Muller M, Woltering M et al., 2010. The economic impact of tourism in six German national parks. Landscape and Urban Planning, 97(2): 73-82.

DOI

[44]
Natalie O, Esther D, Joseph O, 2018. Tourism in changing natural environments. Tourism Geographies, 20(2): 193-201.

DOI

[45]
Niu S M, Jin J F, Yin X J et al., 2015. Analysis of ecological environment change and driving factors in Tianchi Nature Reserve, Xinjiang. Science and Technology in West China, 14(5): 109-112. (in Chinese)

[46]
Shi H, Yang Z P, Han F et al., 2013. Spatial and temporal differentiation and driving mechanism of ecological security degree in Tianchi scenic spot of Xinjiang. Progress in Geography, 32(3): 475-485. (in Chinese)

[47]
Shi M, Wang T, 2005. An application of bio-economic household model to analysis on man-land relationship behavior in ecological fragile land of China. Acta Geographica Sinica, 60(1): 165-174. (in Chinese)

[48]
Shi P J, Song C Q, Cheng C X, 2019. Geographical synergetics: From understanding human-environment relationship to designing human-environment synergy. Acta Geographica Sinica, 74(1): 3-15. (in Chinese)

[49]
Tooke T R, Coops N C, Goodwin N R, 2009. Extracting urban vegetation characteristics using spectral mixture analysis and decision tree classifications. Remote Sensing of Environment, 113(2): 398-407.

DOI

[50]
Wang G L, Yang D G, Ye L et al., 2020. Spatial utilization coordination features and development potential on ecology-agriculture-urban space of key ecological function areas: A case study of Tacheng Basin, China. Polish Journal of Environmental Studies, 29(6).

[51]
Wang J Y, Liu Y S, 2013. Tourism-led land-use changes and their environmental effects in the southern coastal region of Hainan Island, China. Journal of Coastal Research, 29(5): 1118-1125.

[52]
Wang L T, Wang S X, Yi Z et al., 2019. Landscape pattern variation, protection measures, and land use/land cover changes in drinking water source protection areas: A case study in Danjiangkou Reservoir, China. Global Ecology and Conservation, 21: e00827.

DOI

[53]
Wang N, Xie J C, Han J C et al., 2014. A comprehensive framework onland-water resources development in Mu Us Sandy Land. Land Use Policy, 40: 69-73.

DOI

[54]
Wang Q, Yin M H, Yang X Z et al., 2019. Spatio-temporal evolution and impact mechanism of socio-ecological system vulnerability in poor mountainous tourist distinations: Taking Dabie Mountain Area as example. Acta Geographica Sinica, 74(8): 1663-1679. (in Chinese)

[55]
Wang Q R, Mao Z X, Xian L H et al., 2019. A study on the coupling coordination between tourism and the low-carbon city. Asia Pacific Journal of Tourism Research, 24(6): 550-562.

DOI

[56]
Wei L, Christine A V, Frank L et al., 2015. Evolution of tourism in a flagship protected area of China. Journal of Sustainable tourism, 24(1-3): 203-226.

DOI

[57]
Xi J C, Zhao M F, Ge Q S et al., 2014. Changes in land use of a village driven by over 25 years of tourism: The case of Gougezhuang village, China. Land Use Policy, 40: 119-130.

DOI

[58]
Xie Z L, Liu J Y, Ma Z W et al., 2012. Effect of surrounding land-use change on the wetland landscape pattern of a natural protected area in Tianjin, China. The International Journal of Sustainable Development and World Ecology, 19(1): 16-24.

DOI

[59]
Yi P, Fang S M, 2014. Study on the coupling coordination degree of social economy and ecological environment benefit of geopark: A case study of Songshan World Geopark. Resources Science, 36(1): 206-216. (in Chinese)

[60]
Yi Ping, Fang S M, Ma C Y, 2014. Evaluation on the decoupling of tourism economic growth and ecological environmental pressure of geopark: A case study of Songshan World Geopark. Journal of Natural Resources, 29(8): 1282-1296. (in Chinese)

[61]
Yang Y, Li X Y, Dong W et al., 2019. Comprehensive evaluation on China’s man-land relationship: Theoretical model and empirical study. Journal of Geographical Science, 29(8): 1261-1282.

DOI

[62]
Yuan J, Fan H, 2018. Land use/land cover change and its impacts on protected areas in Mengla County, Xishuangbanna, Southwest China. Environmental Monitoring and Assessment, 190(9): 1-16.

DOI

[63]
Zhang Q, Chen C, Wang J et al., 2020. The spatial granularity effect, changing landscape patterns, and suitable landscape metrics in the Three Gorges Reservoir Area, 1995-2015. Ecological Indicators, 114(12): 106259.

DOI

[64]
Zhang T, Li L, 2020. Research on temporal and spatial variations in the degree of coupling coordination of tourism-urbanization-ecological environment: A case study of Heilongjiang, China. Environment Development and Sustainability, 23(2): 1-18.

DOI

[65]
Zhong L S, Deng J Y, Song Z W et al., 2011. Research on environmental impacts of tourism in China: Progress and prospect. Journal of Environmental Management, 92(11): 2972-2983.

DOI

[66]
Zi T, 2015. An integrated approach to evaluating the coupling coordination between tourism and the environment. Tourism Management, 46(2): 11-19.

DOI

Outlines

/