
Journal of Geographical Sciences >
Spatiotemporal variation and hotspots of climate change in the Yangtze River Watershed during 1958-2017
|
Cheng Guowei, specialized in environment simulation and assessment. E-mail: chengguowei@mail.ynu.edu.cn |
Received date: 2020-12-04
Accepted date: 2021-08-12
Online published: 2022-03-25
Supported by
Program for Guangdong Introducing Innovative and Entrepreneurial Teams(2019ZT08L213)
National Natural Science Foundation of China(41701631)
Guangdong Provincial Key Laboratory Project(2019B121203011)
Introduced Talents Team of Southern Marine Science and Engineering Guangdong Laboratory (Guangzhou)(GML2019ZD0403)
The Yangtze River Watershed in China is a climate change hotspot featuring strong spatial and temporal variability; hence, it poses a certain threat to social development. Identifying the characteristics of and regions vulnerable to climate change is significantly important for formulating adaptive countermeasures. However, with regard to the Yangtze River Watershed, there is currently a lack of research on these aspects from the perspective of natural and anthropogenic factors. To address this issue, in this study, based on the temperature and precipitation records from 717 meteorological stations, the RClimDex and random forest models were used to assess the spatiotemporal characteristics of climate change and identify mainly the natural and anthropogenic factors influencing climate change hotspots in the Yangtze River Watershed for the period 1958-2017. The results indicated a significant increasing trend in temperature, a trend of wet and dry polarization in the annual precipitation, and that the number of temperature indices with significant variations was 2.8 times greater than that of precipitation indices. Significant differences were also noted in the responses of the climate change characteristics of the sub-basins to anthropogenic and natural factors; the delta plain of the Yangtze River estuary exhibited the most significant climate changes, where 88.89% of the extreme climate indices varied considerably. Furthermore, the characteristics that were similar among the identified hotpots, including human activities (higher Gross Domestic Product and construction land proportions) and natural factors (high altitudes and large proportions of grassland and water bodies), were positively correlated with the rapid climate warming.
CHENG Guowei , LIU Yong , CHEN Yan , GAO Wei . Spatiotemporal variation and hotspots of climate change in the Yangtze River Watershed during 1958-2017[J]. Journal of Geographical Sciences, 2022 , 32(1) : 141 -155 . DOI: 10.1007/s11442-022-1940-6
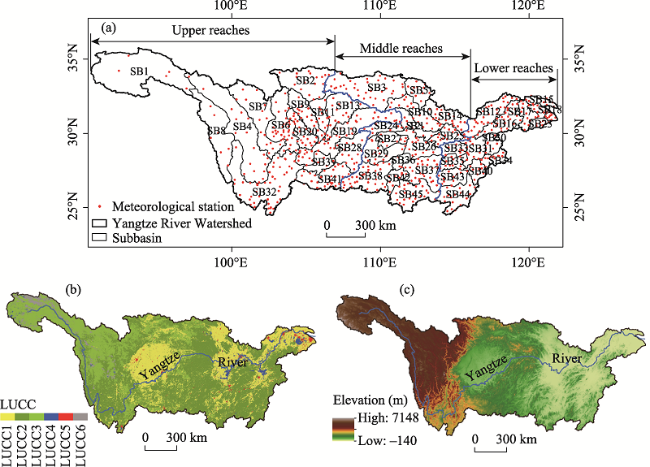
Figure 1 Location of meteorological stations and sub-basins (a); SB1-45 denote the sub-basins. Land use and land cover change (LUCC) in 2015 (b); LUCC1 is cultivated land, LUCC2 is forest land, LUCC3 is grassland, LUCC4 is water body, LUCC5 is construction land, and LUCC6 is unused land. Study area elevation (c) |
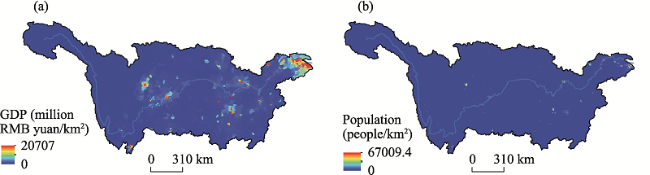
Figure S1 The GDP per unit area (a) and population density (b) of Yangtze River Watershed in 2015 |
Table S1 Definition of the extreme climate indices |
| Index | Indicator name | Definition | Unit | ||
|---|---|---|---|---|---|
| FD0 | Frost days | Annual count when TN (daily minimum)<0ºC | Days | ||
| SU25 | Summer days | Annual count when TX (daily maximum)>25ºC | Days | ||
| ID0 | Ice days | Annual count when TX (daily maximum)<0ºC | Days | ||
| TR20 | Tropical nights | Annual count when TN (daily minimum)>20ºC | Days | ||
| GSL | Growing season Length | Annual count between the first span of at least 6 days with daily mean temperature >5℃ after winter and the first span after summer of 6 days with a daily mean temperature <5℃ | Days | ||
| TXx | Max Tmax | Monthly maximum value of daily maximum temp | ºC | ||
| TNx | Max Tmin | Monthly maximum value of daily minimum temp | ºC | ||
| TXn | Min Tmax | Monthly minimum value of daily maximum temp | ºC | ||
| TNn | Min Tmin | Monthly minimum value of daily minimum temp | ºC | ||
| TN10p | Cool nights | Percentage of days when TN<10th percentile | Days | ||
| TX10p | Cool days | Percentage of days when TX<10th percentile | Days | ||
| TN90p | Warm nights | Percentage of days when TN>90th percentile | Days | ||
| TX90p | Warm days | Percentage of days when TX>90th percentile | Days | ||
| WSDI | Warm spell duration indicator | Annual count of days with at least 6 consecutive days when TX>90th percentile | Days | ||
| CSDI | Cold spell duration indicator | Annual count of days with at least 6 consecutive days when TN<10th percentile | Days | ||
| DTR | Diurnal temperature range | Monthly mean difference between TX and TN | ºC | ||
| RX1day | Max 1-day precipitation amount | Monthly maximum 1-day precipitation | Mm | ||
| RX5day | Max 5-day precipitation amount | Monthly maximum consecutive 5-day precipitation | Mm | ||
| SDII | Simple daily intensity index | Annual total precipitation divided by the number of wet days (defined as PRCP≥1.0mm) in the year | Mm/day | ||
| R10 | Number of heavy precipitation days | Annual count of days when PRCP≥10mm | Days | ||
| Index | Indicator name | Definition | Unit | ||
| R20 | Number of very heavy precipitation days | Annual count of days when PRCP≥20mm | Days | ||
| R25 | Heavy precipitation days | Annual count of days when PRCP≥25mm | Days | ||
| RR | Daily precipitation | A wet day is defined when RR ≥ 1 mm, and a dry day when RR < 1 mm | Days | ||
| CDD | Consecutive dry days | Maximum number of consecutive days with RR<1mm | Days | ||
| CWD | Consecutive wet days | Maximum number of consecutive days with RR≥1mm | Days | ||
| R95p | Very wet days | Annual total PRCP when RR>95th percentile | Mm | ||
| R99p | Extremely wet days | Annual total PRCP when RR>99th percentile | Mm | ||
| PRCPTOT | Annual total wet-day precipitation | Annual total PRCP in wet days (RR≥1mm) | Mm | ||
Table 1 Temporal changes in extreme climate indices in the Yangtze River Watershed from 1958-2017 |
| Temperature indices | Changing rate per decade | Precipitation indices | Changing rate per decade |
|---|---|---|---|
| TXx (℃) | 0.19 | RX1day (mm) | 0.36 |
| TXn (℃) | 0.28 | RX5day (mm) | 1.74 |
| TNx (℃) | 0.15 | SDII (mm/day) | 0.06 |
| TNn (℃) | 0.32 | R95p (mm) | 13.14 |
| DTR (℃) | -0.06 | R99p (mm) | 6.17 |
| SU25 (days) | 2.63 | PRCPTOT (mm) | 8.45 |
| ID0 (days) | -0.02 | R10 (days) | 1.04 |
| TR20 (days) | 2.57 | R20 (days) | 0.13 |
| FD0 (days) | -3.04 | R25 (days) | 0.02 |
| TX10p (days) | -1.5 | CDD (days) | -0.65 |
| TX90p (days) | 2.71 | CWD (days) | 0.87 |
| TN10p (days) | -3.65 | ||
| TN90p (day) | 4.29 | ||
| WSDI (days) | 1.77 | ||
| CSDI (days) | -1.56 | ||
| GSL (days) | 1.34 |
Notes: Trends marked in bold are statistically significant at the 0.05 level. |
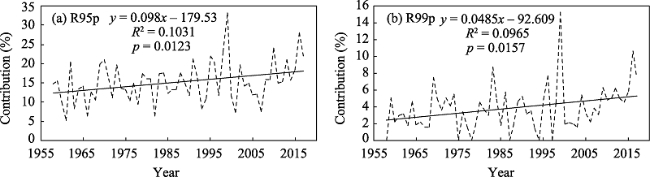
Figure 2 Contribution of (a) very wet days (R95p) and (b) extremely wet days (R99p) to annual total wet-day precipitation (PRCPTOT) in the Yangtze River Watershed; slope of the regression line represents the interannual variations in the contributions |
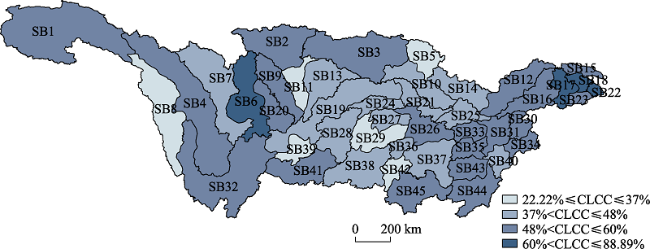
Figure 3 Degrees of responses of climate change to influencing factors in sub-basins |
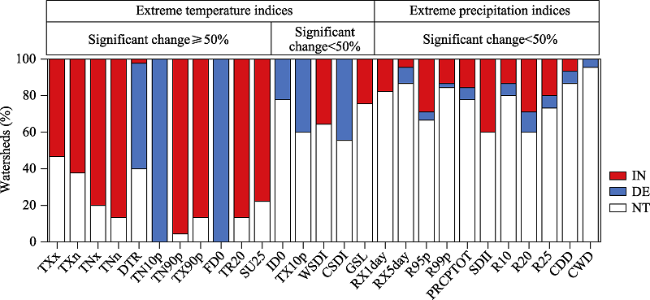
Figure 4 Percentage of watersheds for each extreme climate index that was identified as experiencing an increase (IN), a decrease (DE), and no trend (NT) |
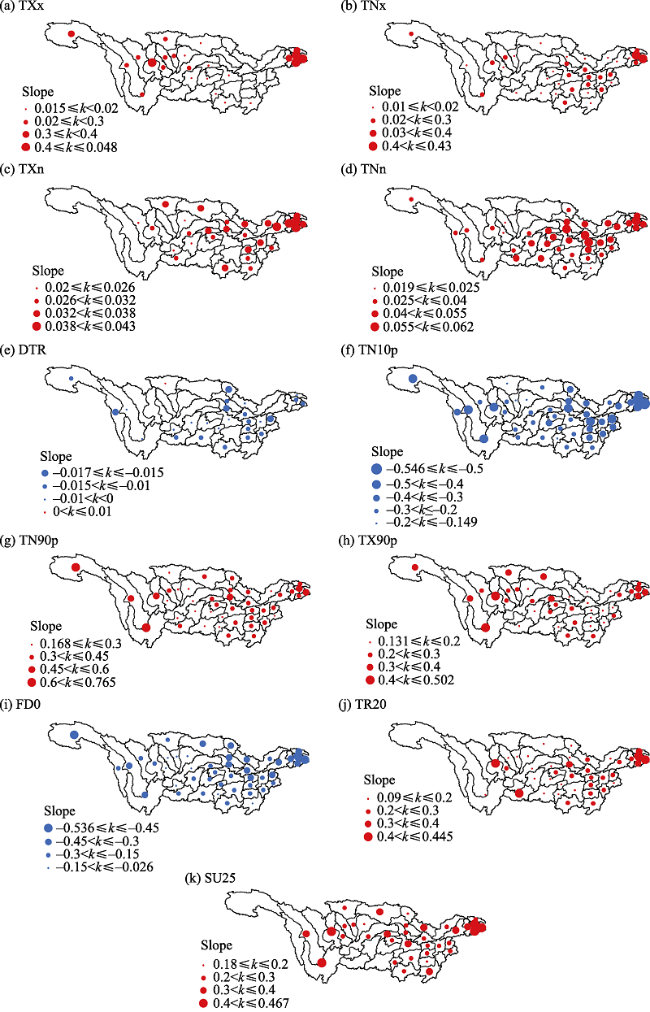
Figure 5 Rate of change in the main extreme climate indices for the Yangtze River sub-basins from 1958 to 2017; slope is represented by k |
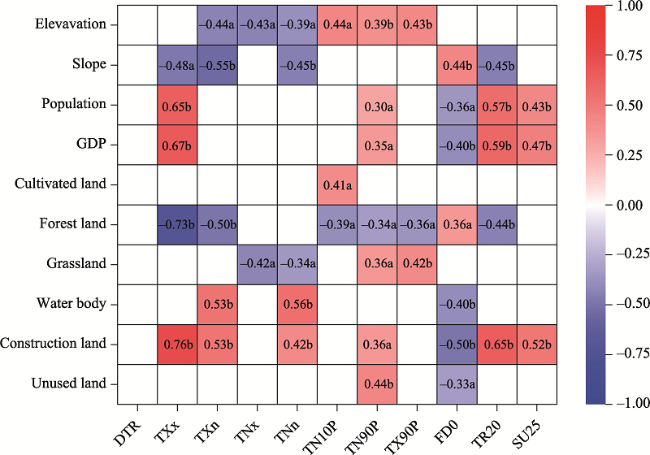
Figure 6 Analysis of the related factors of climate change in the Yangtze River Watershed from 1958-2017 (a denotes significance at the 0.05 level; b denotes significance at the 0.01 level; blank value means no significant correlation) |
Table 2 The importance of factors affecting climate change (after normalization) |
| DTR | TXx | TXn | TNx | TNn | TN10p | TN90p | TX90p | FD0 | TR20 | SU25 | |
|---|---|---|---|---|---|---|---|---|---|---|---|
| Elevation | 0.74 | 0.63 | 1 | 1 | 0.78 | 1 | 1 | 0.83 | 0.77 | 0.44 | 0.74 |
| Slope | 0.36 | 0.49 | 0.60 | 0.19 | 0.45 | 0.24 | 0.06 | 0.81 | 0.48 | 0.61 | 0.09 |
| Population | 0.03 | 0.53 | 0.50 | 0.38 | 0.04 | 0.43 | 0.56 | 0.58 | 0.54 | 0.82 | 0.41 |
| GDP | 0.73 | 1 | 0.67 | 0 | 0.06 | 0 | 0 | 0.61 | 0.20 | 0.96 | 1 |
| Cultivated land | 0.47 | 0.17 | 0.36 | 0.21 | 0 | 0.11 | 0.21 | 0.15 | 0.63 | 0.21 | 0.53 |
| Forest land | 0.35 | 0.75 | 0.19 | 0.30 | 0.09 | 0.31 | 0.52 | 0.14 | 0.37 | 0.48 | 0 |
| Grassland | 0.06 | 0.74 | 0.05 | 0.77 | 0.24 | 0.38 | 0.65 | 1 | 0.34 | 0.37 | 0.04 |
| Water body | 0.06 | 0 | 0.28 | 0.14 | 1 | 0.74 | 0.11 | 0 | 1 | 0 | 0.42 |
| Construction land | 1 | 0.84 | 0.80 | 0.19 | 0.52 | 0.18 | 0.22 | 0.61 | 0.75 | 1 | 0.25 |
| Unused land | 0 | 0.51 | 0 | 0.37 | 0.34 | 0.33 | 0.09 | 0.01 | 0 | 0.16 | 0.31 |
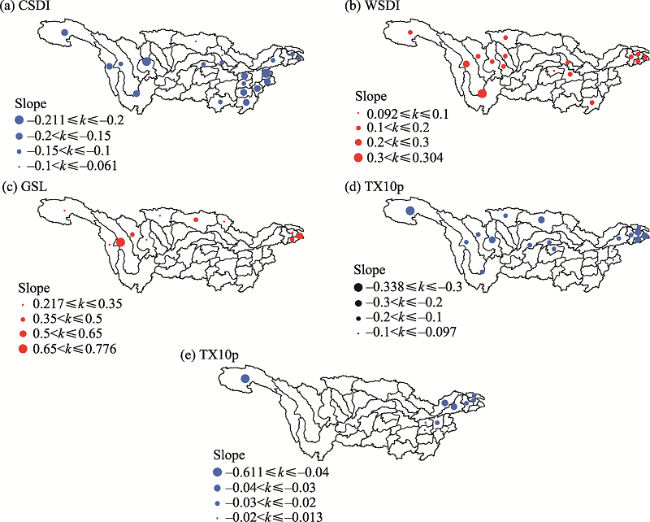
Figure S2 Changing rate of the rest extreme temperature indices in the Yangtze River sub-basins from 1958-2017 |
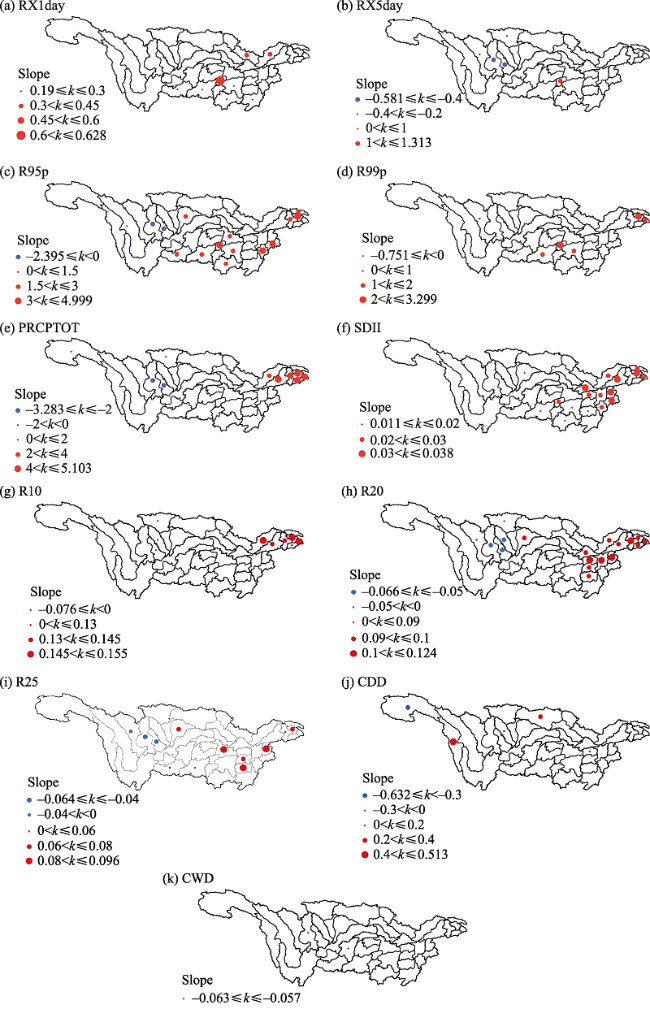
Figure S3 Changing rate of the extreme precipitation indices in the Yangtze River sub-basins from 1958-2017 |
| [1] |
| [2] |
|
| [3] |
|
| [4] |
|
| [5] |
|
| [6] |
|
| [7] |
|
| [8] |
|
| [9] |
|
| [10] |
|
| [11] |
|
| [12] |
|
| [13] |
|
| [14] |
|
| [15] |
|
| [16] |
|
| [17] |
|
| [18] |
|
| [19] |
|
| [20] |
|
| [21] |
|
| [22] |
|
| [23] |
|
| [24] |
|
| [25] |
|
| [26] |
|
| [27] |
|
| [28] |
|
| [29] |
|
| [30] |
|
| [31] |
|
| [32] |
|
| [33] |
|
| [34] |
|
| [35] |
|
| [36] |
|
| [37] |
|
| [38] |
|
| [39] |
|
| [40] |
|
| [41] |
|
| [42] |
|
| [43] |
|
| [44] |
|
| [45] |
|
| [46] |
|
| [47] |
|
| [48] |
|
| [49] |
|
| [50] |
|
| [51] |
|
/
| 〈 |
|
〉 |