Contributions of climate change to cereal yields in Tibet, 1993-2017

  • DING Rui , 1, 2 ,
  • SHI Wenjiao , 1, 2
Expand
  • 1. Key Laboratory of Land Surface Pattern and Simulation, Institute of Geographic Sciences and Natural Resources Research, CAS, Beijing 100101, China
  • 2. College of Resources and Environment, University of Chinese Academy of Sciences, Beijing 100049, China
*Shi Wenjiao (1982-), Professor, specialized in global change and regional agriculture. E-mail:

Ding Rui (1998-), Master Candidate, specialized in regional agriculture and geographic information analysis. E-mail:

Received date: 2021-09-26

  Accepted date: 2021-11-05

  Online published: 2022-03-25

Supported by

Strategic Priority Research Program of Chinese Academy of Sciences(XDA20040301)

Strategic Priority Research Program of Chinese Academy of Sciences(XDA20010202)

Strategic Priority Research Program of Chinese Academy of Sciences(XDA23100202)

National Natural Science Foundation of China(41771111)

Youth Innovation Promotion Association, Chinese Academy of Sciences(2018071)

Abstract

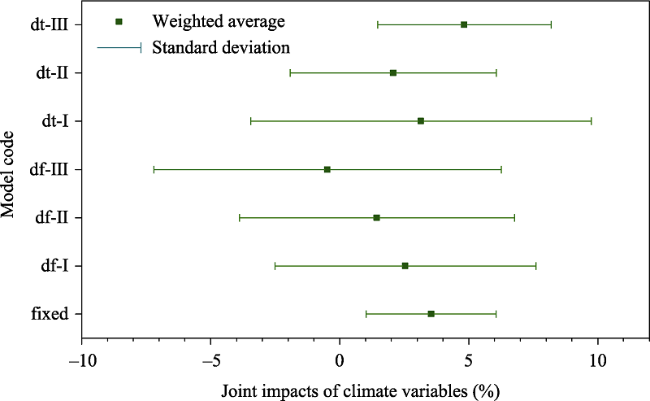
Climate change is a global environmental crisis, but there have been few studies of the effects of climate change on cereal yields on the Tibetan Plateau. We used data from meteorological stations and statistical yearbooks to assess the impacts of climate change on cereal yields in Tibet. Three types of statistical models were selected: fixed-effects model, first-difference models, and linear detrending models. We analyzed the impacts of climate change (including the minimum temperature, precipitation, growing degree days and solar radiation) on cereal yields in Tibet from 1993 to 2017 at the county, prefecture-level city, and autonomous region scales. The results showed that the sensitivity of cereal yields in Tibet to temperature (minimum temperature and growing degree days) was greater than their sensitivity to precipitation and solar radiation. The joint impacts of climate variables were positive, but the sensitivity and significance varied in different regions. The impacts of minimum temperature, precipitation, and solar radiation were positive in all cities, apart from the negative impacts of growing degree days on cereal yields in Lhasa. The impacts of climate trends on cereal yields in Tibet were positive and the results were in the range of 1.5%-4.8%. Among the three types of model, the fixed-effects model was the most robust and the linear detrending model performed better than the first-difference model. The robustness of the first-difference model decreased after adding the interaction terms between different climate variables. Our findings will help in implementing more spatially targeted agricultural adaptations to cope with the impacts of climate change on the agro-ecosystem of the Tibetan Plateau.

Cite this article

DING Rui , SHI Wenjiao . Contributions of climate change to cereal yields in Tibet, 1993-2017[J]. Journal of Geographical Sciences, 2022 , 32(1) : 101 -116 . DOI: 10.1007/s11442-022-1938-0

1 Introduction

Increasing human activity and changes in the natural environment are influencing the global climate. As reported by the IPPC, global climate change is a huge challenge in sustainable development (Matthes, 2008). Climate change is already having serious impacts worldwide on both the natural environment and human society. Agriculture is very sensitive to climate change (Motha et al., 2005, Salinger, 2005), with crop yields being the final manifestation of the response of crops to climate change (Guo, 2015). There is a large gap between the supply and demand of food on the Tibetan Plateau, a region of China with severe food shortages (Duan et al., 2019) and food supply has always been a major concern in the development of Tibet (Liu et al., 2004). The arable land required to meet the demands for grain in China has increased dramatically in recent decades (Zhao et al., 2015b) and it is therefore important to manage and regulate agricultural resources scientifically to ensure food security in this region.
The main methods for evaluating the impacts of climate change on crop yields can be divided into three categories: field experiment observational methods, crop models, and statistical models. Field experiment observational methods usually require a lot of human and material resources and time, which makes them unsuitable for long-term research into changes in crop yields. Crop statistical models are therefore more widely used. Although the principles of the two types of methods are not the same, they are all based on the relationship between past yields and climate change and explore the response of crops to management factors and climate variables (Shi et al., 2013). Crop models contain statistical laws and statistical models contain hypotheses about the processes and mechanisms of crop growth (Lobell et al., 2009). Statistical models have many advantages, such as stronger maneuverability, a longer research period, larger scales, and more information. Statistical models are effective in understanding changes in crop yields in different regions or as a whole and are suitable for research at large spatiotemporal scales (Zhao et al., 2019b).
Many studies using statistical models have identified the impacts of climate change on multiple crop yields in different regions worldwide, including in California (Lobell et al., 2007a), Mexico (Lobell et al., 2005), India (Zaveri et al., 2019), Africa (Lobell et al., 2010, Schlenker et al., 2010) and globally (Lobell et al., 2007b, Lobell et al., 2011). At the global scale, Lobell et al. (2011) showed that global corn and wheat production fell by 3.8% and 5.5%, respectively. Zaveri et al. (2019) used a fixed-effects model to explore the impacts of irrigation and climate change on wheat yields in India, showing that irrigation can offset some of the negative effects of climate change. In China, Tao et al. (2008, 2014, 2012) investigated the relationship between climate change and crop yields at the provincial scale. They showed that although the current climate warming trend has increased the production of rice and soybeans in northeast China, there has been a decrease in wheat yields in some provinces. Zhang et al. (2013, 2010) suggested that climate change has different effects on different regions and crops. Among the climate variables, solar radiation is positively correlated with rice yields and there are weak negative impacts of temperature on crop yields. Although many studies have evaluated the effects of climate change on crop yields at different scales, little research has been carried out using systematic studies of the contribution of climate change to cereal yields on the Tibetan Plateau, which is a sensitive area in terms of climate change. The conclusions drawn from a single model analysis may not be robust. Systematic comparative studies of multiple types of statistical models are rarely reported.
We used seven statistical models of three different types and four climate variables—the minimum temperature, precipitation, growing degree days (GDD), and solar radiation (SRD)—then quantitatively analyzed the impacts of climate change on cereal yields in Tibet. Formulating reasonable agricultural policies based on these results will help farmers to cope with changes in the ecological and agricultural systems on the Tibetan Plateau. We need to develop high-quality, efficient, and safe agricultural practices to reduce the negative impacts of climate change on the extreme climatic conditions and fragile ecology of Tibet. This study will help achieve a sustainable development strategy and ensure food and agricultural ecology security on the Tibetan Plateau.

2 Data and methods

2.1 Study area

The Tibet Autonomous Region has a total land area of about 1.2 million km2, including six prefecture-level cities and one prefecture district, eight municipal districts, and 66 counties. The climate is generally humid and warm in the southeast and dry and cold in the northwest. The terrain generally slopes from northwest to southeast. The landforms can be roughly divided into the plateau of northern Tibet, the alpine valley area of eastern Tibet, the high mountains of the Himalayas, and the river basins of southern Tibet. The southern Tibetan valleys are the main agricultural area. The agriculture of Tibet is known as river valley agriculture and the main crops are cereals, such as highland barley and wheat. The area of highland barley accounts for about 60% of all the grain crops in Tibet (Wan et al., 2018). Lhasa, Shannan and Xigaze are the most important river valley agricultural regions and commodity grain bases in Tibet.

2.2 Data

The land use and digital elevation model data were obtained from the Resource and Environment Science Data Center (RESDC) (www.resdc.cn) and the National Tibetan Plateau/Third Pole Environment Data Center (https://data.tpdc.ac.cn). We determined the area of cultivated land on the Tibetan Plateau based on the superposition of cultivated land in multiple periods.
The meteorological data were obtained from the observations of the National Meteorological Observatory compiled by the RESDC, including 318 stations on the Tibetan Plateau, for the period 1993-2017 (including 39 stations in the Tibet Autonomous Region). The meteorological data fields included the daily temperature (average temperature, maximum temperature, and minimum temperature), precipitation, and sunshine duration. The meteorological indicators used in this study were the values of climate variables during the cereal-growing season in Tibet. The time range of the cereal-growing season was based on records from the Lhasa Agricultural Meteorological Station of the China Meteorological Administration and other studies of the phenology of crops on the Tibetan Plateau (Wang et al., 2010, Yan et al., 2018, Zhao et al., 2019a).
Highland barley accounts for the largest area of planted crops in Tibet, so we used the growing season of highland barley that overlapped with the growing season of other crops to determine the cereal-growing season on the Tibetan Plateau as April-August. For the meteorological variables, we first calculated the monthly meteorological variables based on the daily values and then calculated the meteorological variables in the cereal-growing season (April-August). We then combined the meteorological variables at the station scale with elevation data and used ANUSPLIN meteorological interpolation software to obtain gridded data for the annual meteorological variables. We then used the land use data to extract the values from the cultivated land area and calculated the meteorological variables of the cereal-growing season within the cultivated land area of each county (district) (hereafter county for short) administrative unit in Tibet.
The statistical data were obtained from the Tibet Statistical Yearbooks. The cereal production data at the county scale has been available in these yearbooks since 1993 and we therefore compiled the yearbook data for a total of 25 years from 1993 to 2017. The data were extracted and sorted according to the statistical fields at the county scale and the outlier test was performed in python to eliminate abnormal values. For missing data, the mean value of the adjacent years was used for substitution processing. To ensure the analysis of the long-term series, the counties with few and discontinuous data were eliminated. A total of 63 counties with stable and continuous data in Tibet were therefore included in our analysis. We calculated the cereal yields from the ratio of cereal production and sown area at the county scale.

2.3 Methods

2.3.1 Calculations of GDD and SRD

We used daily temperature data to calculate the GDD during the growing season—that is, the cumulative effective accumulated temperature experienced by crops to complete a certain growth period. This is an indicator of the heat accumulated for plant growth (Shi et al., 2016). Although cereals include a variety of crops, the crops cultivated in Tibet are mainly highland barley and wheat and therefore the GDD mainly referred to the growth temperature of these two crops on the Tibetan Plateau. The lower base temperature and upper limit temperature were set to 0 and 25℃, respectively (Du et al., 2005, Zhao et al., 2013). The specific calculation equations are:
$GDD = \sum {{d_{gd}}}$
${d_{gd}} = \left\{ \begin{array}{l}0,{\rm{ }}{T_{day}} < {T_{base}}\\{T_{day}} - {T_{base}},{\rm{ }}{T_{base}} < {T_{day}} < {T_{up}}\\{T_{up}} - {T_{base}},{\rm{ }}{T_{day}} > {T_{up}}\end{array} \right.$
where GDD represents the GDD during the cereal-growing season, dgd is the general GDD per day in the growing season, Tday is the average daily temperature, Tbase is the base temperature (0℃) and Tup is the upper limit of the optimum temperature range (25℃).
The SRD was calculated according to the daily sunshine duration during the growing season using the Angstrom-Prescott equation (Hu et al., 2010):
$SRD = \left( {a + b\frac{n}{N}} \right){R_a}$
where SRD represents the solar radiation value per day (MJ m-2 day-1), a and b represent the coefficients of the Angstrom-Prescott equation, n is the actual sunshine duration (h), N is the theoretical sunshine duration (h), and Ra is the exoatmospheric radiation (MJ m-2 day-1).

2.3.2 Selection of climate variables and model construction

We used Pearson’s correlation coefficient (Pearson’s r) to describe the linear correlation between two variables to select the climate variables. The cereal yields were significantly correlated with the average temperature, minimum temperature, precipitation, GDD, and SRD at the 0.01 level. The average temperature had a strong correlation with the minimum temperature (Pearson’s r = 0.819) and there was a positive correlation between the average temperature and the GDD. Too many temperature variables will cause collinearity and mutual interference, so the average temperature was not included in the model parameters. There was no significant correlation between the diurnal temperature range and cereal yields, so this was not included in the model parameters. The four climate variables of minimum temperature, precipitation, GDD, and SRD were used as independent variables in the model and the cereal yields were used as the dependent variable for model input. The minimum temperature reflects the impacts of the temperature trend and low temperatures on cereal yields. The GDD reflects the impacts of changes in the accumulated temperature on cereal yields. The precipitation reflects the impacts of changes in precipitation on cereal yields. The SRD reflects the impacts of changes in sunshine radiation on cereal yields.
We used multi-linear regression models to quantitatively analyze the impacts of climate change on cereal yields in Tibet. To avoid the randomness of a single model, we used three types of statistical models: a fixed-effects model, first-difference models, and linear detrending models.
The fixed-effects model is a statistical model that uses panel data for analysis (Lee et al., 2010). The fixed-effects of the model were used to reflect the differences between different counties. All the counties in Tibet were classified according to their prefecture-level administrative units to accurately reflect the impacts of climate variables on cereal yields. The fixed-effects model (fixed) expression is:
$\log {Y_{it}} = {\alpha _i} + {\lambda _c}t + {\theta _1}{T_{\min }}_{it} + {\theta _2}{P_{it}} + {\theta _3}GD{D_{it}} + {\theta _4}SR{D_{it}} + {\varepsilon _{it}}$
where Yit represents the cereal yields of the ith county in year t. Using log Yit means that the meteorological variables affect the yields proportionally and the sample better satisfies a normal distribution (Gourdji et al., 2015). Tminit, Pit, GDDit, and SRDit represent the minimum temperature, precipitation, GDD, and SRD, respectively, in the growing season of the ith county in year t. αi is the fixed impact at the county scale and is used to distinguish the impacts of changes other than climate variables on yields (Zaveri et al., 2019). αi reflects the differences between regions without the meteorological variables. λc is the annual time trend at the prefecture-level city scale and is mainly used to reflect the impacts of technological and management progress (Lobell et al., 2011). The coefficients of θ1, θ2, θ3, and θ4 are used to measure the sensitivity of cereal yields to climate change. εit is an error term.
Both the series of first-difference model and the linear detrending model removed the effects of long-term changes from the climate variables and avoided the mixed effects of non-climate variables due to long-term changes (e.g., technological advances such as crop germplasm and management measures) (Lobell et al., 2007b, Nicholls, 1997, Tao et al., 2008). There are often non-linear effects of climate variables (X) on yields in addition to the linear impacts. We therefore introduced the square of the climate variables (X2) on the basis of the first-difference model and the linear detrending model. There are also correlations between different climate variables (e.g., the correlations between temperature and precipitation and between temperature and GDD). To reflect these effects, we added the mutual influence between climate variables, namely, that is, the interaction terms (Z). Both the first-difference model series and the linear detrending model series were used to construct three models: the original models (df-Ⅰ and dt-Ⅰ, equations 5 and 8); the models after adding the squared terms (df-Ⅱ and dt-Ⅱ, equations 6 and 9); and the models after adding the square terms and interaction terms (df-Ⅲ and dt-Ⅲ, equations 7 and 10).
The first-difference model used the first-difference time series of the yields (ΔY) and climate variables (ΔTmin, ΔPRE, ΔGDD, and ΔSRD, using the vector ΔX to represent these four climate variables). The equations for the first-difference model series are:
$\Delta {Y_{i,t}} = {\beta _0}_{i,t} + \sum {{\beta _j}\mathop {\Delta X}\nolimits_{i,t} } + {\varepsilon _{i,t}}$
$\Delta {Y_{i,t}} = {\beta _0}_{i,t} + \sum {{\beta _j}\mathop {\Delta X}\nolimits_{i,t} } + \sum {{\beta _k}} \mathop {\Delta X}\nolimits_{i,t}^2 + {\varepsilon _{i,t}}$
$\Delta {Y_{i,t}} = {\beta _0}_{i,t} + \sum {{\beta _j}\mathop {\Delta X}\nolimits_{i,t} } + \sum {{\beta _k}} \mathop {\Delta X}\nolimits_{i,t}^2 + \sum {{\beta _m}\Delta \mathop Z\nolimits_{i,t} } + {\varepsilon _{i,t}}$
where ΔYi,t represents the first-difference value of the cereal yields of the ith county in year t; ΔXi,t represents the vector composed of the first-difference values of the climate variables of the ith county in year t; ΔX2i,t represents the square of the climate variables of the ith county in year t, which is used to reflect the non-linear influence caused by climate variables exceeding a certain threshold (such as excessive rainfall); ΔZi,t represents the interaction between different climate variables of the ith county in year t, which is used to eliminate the influence between different climate variables. β0i,t is the intercept term, which represents the change caused by non-climate variables in each county; βj is the coefficient of the climate variables, indicating the influence of the climate variables on cereal yields; βk and βm are the coefficients of the square terms and the interaction terms, respectively. εi,t is the error term.
Similar to the first-difference series, the detrended time series of yields (dtY) and the climate variables (dtTmin, dtPRE, dtGDD, and dtSRD, using the vector dtX to represent these four climate variables) were used in the linear detrending model series. The equations are as follows:
$dt{Y_{i,t}} = {\beta _0}_{i,t} + \sum {{\beta _j}dt\mathop X\nolimits_{i,t} } + {\varepsilon _{i,t}}$
$dt{Y_{i,t}} = {\beta _0}_{i,t} + \sum {{\beta _j}dt\mathop X\nolimits_{i,t} } + \sum {{\beta _k}} dt\mathop X\nolimits_{i,t}^2 + {\varepsilon _{i,t}}$
$dt{Y_{i,t}} = {\beta _0}_{i,t} + \sum {{\beta _j}dt\mathop X\nolimits_{i,t} } + \sum {{\beta _k}dt} \mathop X\nolimits_{i,t}^2 + \sum {{\beta _m}dt\mathop Z\nolimits_{i,t} } + {\varepsilon _{i,t}}$
where dtYi,t represents the linear detrended value of the cereal yields of the ith county in year t; dtXi,t, dtX2i,t and dtZi,t represent the vector composed of the linear detrended value, the square terms, and the interaction terms, respectively, of the climate variables of the ith county in year t. β0i,t is the intercept term in the model; βj is the coefficient of the climate variables; βk and βm are the coefficients of the square terms and the interaction terms, respectively. εi,t is the error term.

2.3.3 Disentangling the impacts of climate change on cereal yields

To ensure statistical significance, we only included the climate variables that passed the significance test (p≤0.1) in the calculation. We therefore obtained the percentage impact of each climate variable on the cereal yields in different models. The joint impacts of climate change on cereal yields are the sum of the impacts of the four climate variables. We obtained the impacts of climate change on cereal yields at the prefecture-level city and autonomous region scale in Tibet weighted by the cultivated area of cereals in each county.
We constructed two scenarios (counterfactual scenario and factual scenario) in the fixed-effects model to measure the contribution of climate change to cereal yields. Under the counterfactual scenario, we kept the significant climate variables at the initial levels (averaged over 1993-1994) and the other climate variables were the actual values of the annual observations. Under the factual scenario, all the climate variables were the actual values of the annual observations. The annual impacts of the corresponding climate variables on cereal yields were the ratio of the two predicted yields under the two scenarios. To evaluate the changes at the end of the study period, we averaged the impacts in the last five years of the study period (2013-2017) to eliminate the fluctuations in particular years (Zaveri et al., 2019) and used this value as the percentage of climate change impacts on cereal yields.
In the first-difference and linear detrending model series, the data need to be processed by first-difference or linear detrending processing to eliminate long-term fluctuations and enhance stability. The ten-year climate tendency rates of the climate variables were calculated using the linear regression equation, which is expressed as follows:
$y = ax + b$
where y is each climate variable, x is the year, b is the intercept term, and 10a is the ten-year climate tendency rate.
The coefficient of each climate variable (βj in the model formula) is expressed as the sensitivity. To facilitate subsequent calculations, the sensitivity was divided by the mean cereal yields during the study period to calculate the unit sensitivity of each climate variable. We multiplied the unit sensitivity by the ten-year climate tendency rate in each county to estimate the impacts of different climate variables on cereal yields from 1993 to 2017 (as percentage changes of the actual mean yields).

3 Results

3.1 Descriptive analysis of cereal yields and climate variables

In terms of the cereal yields of different prefecture-level cities (Figure 1a), Lhasa and Shannan were the highest, followed by Xigaze, Nyingchi, and Qamdo, whereas Nagqu and Ngari were the lowest. The annual median and mean yields at the county scale in Tibet showed an upward trend and remained at 3-4 t ha-1 (Figure 1b). The yields varied greatly among different counties in Tibet. The counties with the lowest yields were <1 t ha-1 and the highest exceeded 10 t ha-1 in certain years.
Figure 1 (a) Cereal yields in different prefecture-level cities in Tibet from 1993 to 2017 and (b) cereal yields of county-level statistics in Tibet from 1993 to 2017
The order (from high to low) of the average temperature of the prefecture-level cities in Tibet was: Nyingchi > Ngari > Lhasa > Qamdo > Shannan > Xigaze > Nagqu (Figure 2). The minimum temperature showed a fluctuating upward trend (Figure 2a), with the highest minimum temperature in Nyingchi and the lowest in Nagqu. The range of fluctuation in other prefecture-level cities was relatively close and mainly in the range of 5-6℃. The precipitationfluctuated greatly from year to year (Figure 2b), with the highest in Nyingchi and the lowest in Ngari; the other cities mainly fluctuated in the range of 250-500 mm. The GDD also showed a fluctuating upward trend, but the trend was not obvious (Figure 2c). The GDD of each prefecture-level city was different, with the largest in Lhasa and Nyingchi. The SRD among the prefecture-level cities showed a downward trend (Figure 2d), with the highest in Ngari and the lowest in Nyingchi.
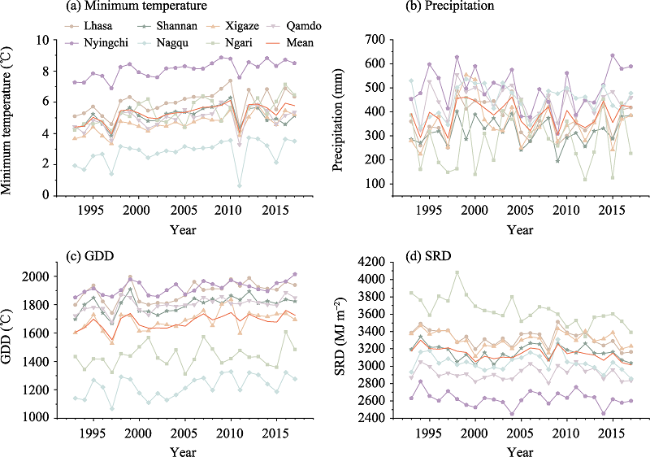
Figure 2 Annual changes of each climate variable in cropland areas of different prefecture-level cities in Tibet from 1993 to 2017
The patterns of the climate tendency rate from 1993 to 2017 showed that the minimum temperature of 62 counties increased during the cereal-growing season, except for Qonggyai county of Shannan city, which decreased slightly by -0.03℃ 10a-1. The warming trend of most counties was concentrated around 0.35-0.65℃ 10a-1 (Figure 3). Xigaze city, located in the Yarlung Zangbo River, Nyangqu River, and Lhasa River regions (the YNL River region), experienced the most obvious warming trend.
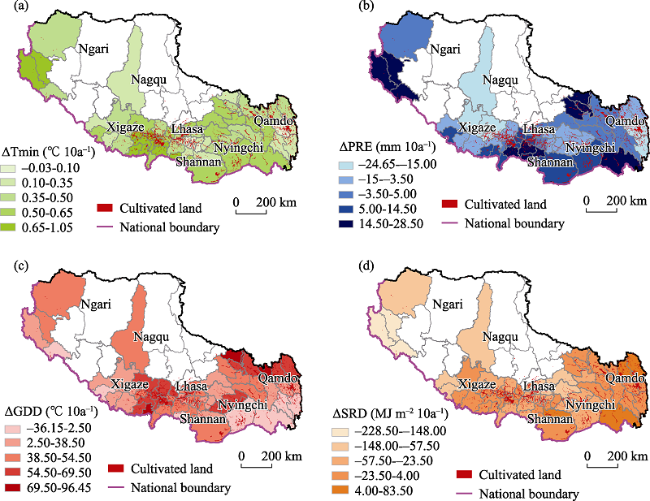
Figure 3 Distributions of climate trends from 1993 to 2017. (a) Minimum temperature; (b) precipitation; (c) GDD; and (d) SRD
Precipitation was different in different counties and prefecture-level cities. Nearly half of the counties showed a decreasing trend, whereas the others showed an increasing trend. The counties with large decreases in precipitation were mainly concentrated in Xigaze and Qamdo. Increasing precipitation was more obvious in counties on the border of the Tibetan Plateau. Among the counties, Kangmar, Nagarze, Zayu, and Lhozhag had the largest increase in precipitation, exceeding 20 mm 10a-1.
A total of 92% of the counties exhibited an increase in GDD trend, and 50% of the counties corresponded to the range of 28.16-60.00°C 10a-1. Most of the counties with obvious growth trends in GDD were in Xigaze city. A total of 89% of the counties showed a downward trend in SRD and only seven counties showed an upward trend. The three counties with the largest decrease in SRD were all located in Ngari. Among them, Burang county had the largest decrease of -228.18 MJ m-2 10a-1. The downward trend of SRD was higher in the west than in the east. The average value of the changes in SRD in all counties was -33.69 MJ m-2 10a-1.

3.2 Influence of different climate variables on cereal yields in Tibet

Climate change had mainly positive impacts on cereal yields in Tibet and the significance of each climate variable was different between regions (Figure 4). Cereal yields in Tibet were most sensitive to temperature-related climate variables. Cereal yields in three cities (Shannan, Lhasa, and Ngari) were significantly sensitive to the minimum temperature and cereal yields in four cities (Lhasa, Xigaze, Qamdo, and Nyingchi) were significantly sensitive to GDD, although the higher GDD in Lhasa had a negative impact (-8.3%). The impacts of current changes in precipitation and SRD on the cereal yields were positive in all prefecture-level cities. The effects of precipitation were significant in Lhasa and Nagqu, with impacts of 2.9% and 1.5%, respectively. The SRD had a significant effect in Shannan and Xigaze, with impacts of 4.3% and 2.5%, respectively. In comparison of different climate variables, the impacts of minimum temperature, precipitation, and GDD were all the greatest in Lhasa, whereas the impacts of SRD were the greatest in Shannan. In general, the impacts of different climate variables varied from region to region. The SRD was significant in fewer counties than the other climate variables. This is partly a result of Tibet’s high altitude and high solar radiation, which means that solar radiation is not the main limiting factor affecting grain production.
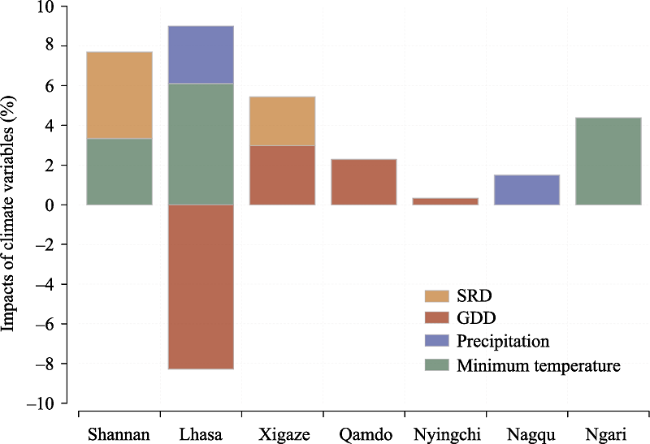
Figure 4 Contributions of different climate variables to cereal yields in different cities of Tibet from 1993 to 2017

3.3 Impacts of climate change on cereal yields in Tibet

3.3.1 Autonomous region scale

At the autonomous region scale, all the models except model df-Ⅲ (-0.5%) indicated that climate change had a positive impact on cereal yields during the study period (Figure 5). The percentage impact calculated by the fixed-effects model, df-I, df-II, dt-I, dt-II, and dt-III were 3.5%, 2.1%, 1.5%, 3.2%, 2.1%, and 4.8%, respectively. The average value of the seven models was 2.39%, so the impacts of climate change on cereal yields in Tibet were generally positive.
Figure 5 Impacts of climate change on cereal yields in Tibet based on different models

3.3.2 Prefecture-level city scale

Most of the models showed positive impacts at the city scale. The positive impacts were higher in Nyingchi, Nagqu, and Ngari (Figure 6), and all the seven models showed positive impacts in Nyingchi. However, Nyingchi, Nagqu, and Ngari were the three prefecture-level cities with the lowest sown area of cereals and the lowest cereal production, so their contribution to the overall production of cereals in Tibet was limited. The impacts in other cities were mainly positive, but Lhasa, Xigaze, and Qamdo showed negative effects in some models.
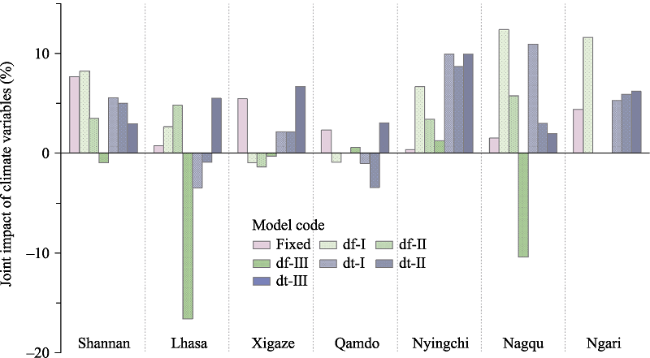
Figure 6 Joint impacts of all climate variables on cereal yields in different cities in Tibet using different models
In the fixed-effects model (fixed), the impacts of climate change were positive in all seven prefecture-level cities in Tibet and, from highest to lowest, were: 7.7% in Shannan, 5.4% in Xigaze, 4.4% in Ngari, 2.2% in Qamdo, 1.5% in Nagqu, and 0.7% in Lhasa. The impacts in Nagqu and Ngari were relatively high in models df-I and df-II, whereas Xigaze and Qamdo showed weak negative impacts (less than -1%). The impacts were negative in four cities in model df-Ⅲ with the interaction term of climate variables and these negative impacts were generally higher than in other models. Model df-Ⅲ gave inconsistent results for some cities compared with models dt-I and dt-II and regressed abnormally in some counties, affecting the final results. We speculate that model df-Ⅲ has too many regression terms after introducing the interaction terms of the climate variables, which leads to poor robustness. Although model df-Ⅲ was poor at small scales, it improved after aggregation to the autonomous region scale.
In the linear detrending model series, the results of models dt-I, dt-II, and dt-III indicated that climate change had greater positive impacts on cereal yields in Nyingchi and Ngari; the results of the three models were relatively consistent. Although their results were negative in some prefecture-level cities, the range was within 5%.
The joint impacts of climate change at the prefecture-level city scale were therefore generally positive, with Nyingchi, Nagqu, and Ngari increasing cereal yields more than other cities. In terms of model robustness, the fixed-effects model was the best and the linear detrending models were better than the first-difference models. After introducing the interaction terms, the robustness of the first-difference models (df-Ⅲ) was decreased.

3.3.3 County scale

At the autonomous region and prefecture-level city scales, we found that the fixed-effects model performed best, so we used this model to analyze the spatial pattern at the county scale (Figure 7). The impacts of climate change on cereal yields in Tibet were still mostly positive at the county scale, with the largest impacts in Lhozhag county (11.3%) and Yadong county (9.4%). The impacts of climate change were greater in the YNL River region (the parts of Shannan city and Xigaze city shown in Figure 7), including counties of Nedong, Chanang, Konggar, Sangri, Qonggyai, and Gyangze. The impacts of climate change were positive in all counties in Ngari, but there is less cultivated land here and the region is not suitable for agricultural development. The impacts of climate change were relatively small in Lhasa compared with Shannan and Xigaze, which are also important commodity grain bases.
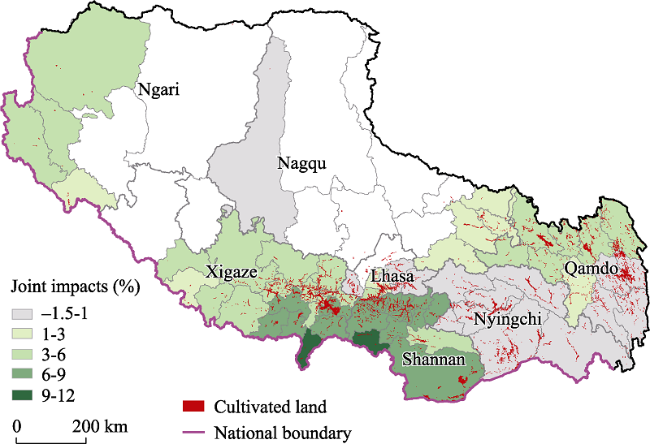
Figure 7 Distribution of the joint impacts of climate change on cereal yields in Tibet from 1993 to 2017 based on the fixed-effects model
From the perspective of topography, the impacts of climate change were lower in the counties at relatively low altitudes, with the range of impacts in Nyingchi and Qamdo being -1.5% from 1%. Although the climate change trends generally had positive impacts in most counties in Tibet, they had negative impacts in Maizhokunggar and Nyemo counties in Lhasa, Markam county in Qamdo, and Zayu and Medog counties in Nyingchi. Among these, the negative impacts in Zayu, Medog, and Nyemo counties were all <0.2%, which can almost be ignored. The impacts in Maizhokunggar and Markam were -1.5% and -1.2%, respectively. Not all counties in Tibet can get benefit from climate change and agricultural policies must therefore be formulated in the light of local conditions to adapt to climate change.

4 Discussion

These results show that the effects of climate change on cereal yields in Tibet were positive at the autonomous region scale from 1993 to 2017, which is consistent with the increase in crop production potential on the Tibetan Plateau (Gesangquzhen et al., 2015, Zhao et al., 2015a). The first-difference model with square and interaction terms was less robust but was improved after aggregation to a larger scale. This is consistent with the results of Lobell et al. (2010) in their verification of the accuracy of statistical models. Among different climate variables, cereal yields were more significantly affected by temperature-related variables than by precipitation and solar radiation. This is consistent with previous research on the response of the main sensitive areas of the Tibetan crops to climate change (Gao et al., 2019).
However, although the joint impacts of climate change on cereal yields in Tibet were positive, it is worth noting that the GDD had negative impacts in Lhasa. This may be due to the high accumulated temperature in Lhasa, which caused other negative effects, such as an increase in evapotranspiration, plant diseases, and insect pests, in addition to changes in the physiochemical properties of soils (Li et al., 2010; Piao et al., 2019). The temperature in Lhasa is relatively high for Tibet and the negative impacts exceed the positive impacts of the increase in temperature, resulting in negative impacts of the GDD in Lhasa. Similarly, in Nyingchi City, which has a higher GDD, only 0.3% of the gains were from the increase in the accumulated temperature, which was less than the gains in Xigaze (3.0%) and Qamdo (2.3%) with lower accumulated temperatures.
The natural conditions in Tibet are different from those in other cereal-growing areas, with a higher altitude, lower temperatures, and abundant solar radiation. Because cereal production in Tibet accounts for only a small proportion of the overall production in China, most previous studies have not considered this region. The impacts of climate change are not the same in different regions of China and previous studies have shown that there are large spatial differences. The changes in temperature, precipitation, and solar radiation from 1981 to 2009 have jointly increased the yields of wheat in northern China by 0.9%-12.9%, whereas the yields of wheat in southern China have decreased by 1.2%-10.2% (Tao et al., 2014). The trend of a warming climate has increased the yields of rice and soybeans in northeast China, but reduced the yields of corn in seven provinces (autonomous regions or municipalities) and the yields of wheat in three provinces (Tao et al., 2008).
It is generally believed that crop yields in mid- and high-latitude regions will benefit from the warming of the Earth’s climate (IPCC, 2007). Warming has caused changes in the type and distribution of crops suitable for planting. For example, the temperature in northeast China has increased significantly, which has expanded the area suitable for rice-growing (Wang et al., 2005). Our study has shown that the current changes in climate are beneficial to cereal yields in Tibet. The Tibetan Plateau has low temperatures throughout the year, similar to other high-latitude regions, such as northeast China. Increasing temperatures are conducive to the growth of crops. The conditions in areas that were previously unsuitable for crop growth have gradually improved. However, the ecological environment in Tibet is fragile and its ecological carrying capacity is limited. The impacts of climate change on the ecological environment must therefore be considered when expanding the planting area of cereal crops.
To avoid the randomness of single model analysis, we used a variety of statistical models to assess the impacts of climate change trends on cereal yields in Tibet. However, it was impossible to distinguish specific crop types from the available data. When selecting the growing season, we mainly referred to the growing season of highland barley, which accounts for a relatively high planting area. In future research, the type of crop and growth period could be subdivided and the impacts of climate change in different regions studied in more detail. Future studies could incorporate changes in crop breeds into the analysis to make the results more informative because crop breeds vary between regions (Lobell et al., 2010) and adapt differently to climate change. There are still some unresolved aspects of our research, including higher atmospheric CO2 concentrations affect crop fertilization and the impacts of specific natural disasters. In addition, due to the limitations of the statistical data, we only analyzed 25 years from 1993 to 2017. The study period could be expanded to include future years or use remote sensing to retrieve crop production statistics for earlier years, which would improve the accuracy of our results.

5 Conclusions

We systematically analyzed the impacts of minimum temperature, precipitation, GDD, and SRD on the cereal yields in Tibet from 1993 to 2017 using three types of statistical models: a fixed-effects model, a first-difference model series and a linear detrending model series. Our main conclusions are as follows.
(1) Crop yields in Tibet were more sensitive to temperature (minimum temperature and GDD) than precipitation and SRD. The sensitivities to various climate variables were different in different prefecture-level cities. The greatest impacts of minimum temperature, precipitation, and GDD were in Lhasa, whereas the greatest impacts of SRD were in Shannan. Crop yields in all the cities benefited from climate change at the prefecture-level city scale, but GDD had negative impacts in Lhasa. Among the different climate variables, the largest positive impacts on cereal yields in Tibet were caused by the increase in the minimum temperature.
(2) The impacts of climate change on cereal yields in Tibet were generally positive. The impacts were greater in Shannan and Xigaze in the YNL River region, with the impacts ranging from 6% to 12%. The impacts were relatively lower in Lhasa, Nyingchi, and Qamdo, ranging from -1.5% to 1%. In general, the benefits of climate change were not as high in the low-altitude areas as in the high-altitude areas.
(3) The average impact of climate change on cereal yields in the seven models was 2.39% in Tibet and the results were concentrated in the range of 1.5%-4.8%. In terms of model robustness, the fixed-effects model gave the best results and the linear detrending model series was better than the first-difference model series. In particular, the robustness of the first-difference model deteriorated after adding the interaction terms. Although its robustness was inferior at the county and prefecture-level city scale, it could be improved after aggregation to a larger scale.
[1]
Du J, Hu J, Sonam N, 2005. Climatic change of agriculture critical temperature over Tibetan Plateau from 1971 to 2000. Acta Geographica Sinica, 60(2): 289-298. (in Chinese)

[2]
Duan J, Xu Y, Sun X Y et al., 2019. Spatial patterns and their changes of grain production, grain consumption and grain security in the Tibetan Plateau. Journal of Natural Resources, 34(4): 673-688. (in Chinese)

DOI

[3]
Gao J J, Du J, Liu Z Y et al., 2019. Study on response of sensitive area of main crops to climate change in Tibet area. Journal of Ecology and Rural Environment, 35(11): 1484-1489. (in Chinese)

[4]
Gesangquzhen , Pubuciren J, Hu X Y 2015. Effect of climate change on yield potential of crops in Tibet. Agricultural Research in the Arid Areas, 33(2): 266-271. (in Chinese)

[5]
Gourdji S, Laderach P, Valle A M et al., 2015. Historical climate trends, deforestation, and maize and bean yields in Nicaragua. Agricultural and Forest Meteorology, 200: 270-281.

DOI

[6]
Guo J P, 2015. Advances in impacts of climate change on agricultural production in China. Journal of Applied Meteorological Science, 26(1): 1-11. (in Chinese)

[7]
Hu Q F, Yang D W, Wang Y T et al., 2010. Effects of Angstrom coefficients on ET0 estimation and the applicability of FAO recommended coefficient values in China. Advances in Water Science, 21(5): 644-652. (in Chinese)

[8]
IPCC,2007. Climate change 2007. Contribution of Working Group I to the Fourth Assessment Report of the Intergovernmental Panel on Climate Change. Cambridge: Cambridge University Press.

[9]
Lee L F, Yu J, 2010. Estimation of spatial autoregressive panel data models with fixed effects. Journal of Econometrics, 154(2): 165-185.

DOI

[10]
Li Y J, Wang C Y, Zhao B et al., 2010. Effects of climate change on agricultural meteorological disaster and crop insects diseases. Transactions of the Chinese Society of Agricultural Engineering, 26(S1): 263-271. (in Chinese)

[11]
Liu J, Li X M, Zhong X H, 2004. Consumption structure of food and the countermeasure of grain in Tibet. Journal of Mountain Research, 22(3): 286-291. (in Chinese)

[12]
Lobell D B, Burke M B, 2009. Climate change and food security: Adapting agriculture to a warmer world. Springer Science & Business Media.

[13]
Lobell D B, Burke M B, 2010. On the use of statistical models to predict crop yield responses to climate change. Agricultural and Forest Meteorology, 150(11): 1443-1452.

DOI

[14]
Lobell D B, Cahill K N, Field C B, 2007a. Historical effects of temperature and precipitation on California crop yields. Climatic Change, 81(2): 187-203.

DOI

[15]
Lobell D B, Field C B, 2007b. Global scale climate-crop yield relationships and the impacts of recent warming. Environmental Research Letters, 2(1): 014002.

DOI

[16]
Lobell D B, Ortiz-Monasterio J I, Asner G P et al., 2005. Analysis of wheat yield and climatic trends in Mexico. Field Crops Research, 94(2/3): 250-256.

DOI

[17]
Lobell D B, Schlenker W, Costa-Roberts J, 2011. Climate trends and global crop production since 1980. Science, 333(6042): 616-620.

DOI PMID

[18]
Matthes F C, 2008. Climate change 2007. The physical science basis, impacts, adaptation and vulnerability mitigation of climate change. Internationale Politik, 63(4): 130-132.

[19]
Motha R P, Baier W, 2005. Impacts of present and future climate change and climate variability on agriculture in the temperate regions: North America. Climatic Change, 70(1/2): 137-164.

DOI

[20]
Nicholls N, 1997. Increased Australian wheat yield due to recent climate trends. Nature, 387(6632): 484-485.

DOI

[21]
Piao S L, Zhang X Z, Wang T et al., 2019. Responses and feedback of the Tibetan Plateau’s alpine ecosystem to climate change. Chinese Science Bulletin, 64(27): 2842-2855. (in Chinese)

[22]
Salinger M, 2005. Climate variability and change: Past, present and future: An overview. Climatic Change, 70(1/2): 9-29.

DOI

[23]
Schlenker W, Lobell D B, 2010. Robust negative impacts of climate change on African agriculture. Environmental Research Letters, 5(1): 014010.

DOI

[24]
Shi W, Tao F, Zhang Z, 2013. A review on statistical models for identifying climate contributions to crop yields. Journal of Geographical Sciences, 23(3): 567-576.

DOI

[25]
Shi X L, Shi W J, 2016. Impacts of extreme high temperature on winter wheat yield in the Huang-Huai-Hai Plain. Journal of Ecology and Rural Environment, 32(2): 259-269. (in Chinese)

[26]
Tao F, Yokozawa M, Liu J et al., 2008. Climate-crop yield relationships at provincial scales in China and the impacts of recent climate trends. Climate Research, 38(1): 83-94.

DOI

[27]
Tao F, Zhang Z, Xiao D et al., 2014. Responses of wheat growth and yield to climate change in different climate zones of China, 1981-2009. Agricultural and Forest Meteorology, 189-190: 91-104.

DOI

[28]
Tao F, Zhang Z, Zhang S et al., 2012. Response of crop yields to climate trends since 1980 in China. Climate Research, 54(3): 233-247.

DOI

[29]
Wan Y F, Li Y E, Gao Q Z et al., 2018. Climate change trend and its impact on yield of highland barley in Tibet, China. Journal of Agricultural Resources and Environment, 35(4): 374-380. (in Chinese)

[30]
Wang L, Li F X, Xu W X et al., 2010. Impact of climatic change on growth of wheat in the irrigation district of Qaidam Oasis. Chinese Journal of Agrometeorology, 31(S1): 81-83, 89. (in Chinese)

[31]
Wang Y, Fang X Q, Xu T et al., 2005. Impact of climate warming and adaptation activities of rice plantation in Northeast China. Resources Science, 27(1): 121-127. (in Chinese)

[32]
Yan Y C, Zhao Q N, Wang Z et al., 2018. Analysis of highland barley phenophase change trend and the driving factors in Menyuan County, Qinghai Province during 1980-2015. Acta Ecologica Sinica, 38(4): 1264-1271. (in Chinese)

[33]
Zaveri E, Lobell D B, 2019. The role of irrigation in changing wheat yields and heat sensitivity in India. Nature Communications, 10(1): 1-7.

DOI

[34]
Zhang T Y, Huang Y, 2013. Estimating the impacts of warming trends on wheat and maize in China from 1980 to 2008 based on county level data. International Journal of Climatology, 33(3): 699-708.

DOI

[35]
Zhang T Y, Zhu J A, Wassmann R, 2010. Responses of rice yields to recent climate change in China: An empirical assessment based on long-term observations at different spatial scales (1981-2005). Agricultural and Forest Meteorology, 150(7/8): 1128-1137.

DOI

[36]
Zhao X Y, Wang W J, Wan W Y et al., 2015a. Impact of climate change on potential productivity and phenological phase of forage in the Qinghai-Tibet Plateau in the past 50 years. Chinese Journal of Eco-Agriculture, 23(10): 1329-1338. (in Chinese)

[37]
Zhao Y, Wang L F, Yang Q S, 2013. Effects of temperature and variety on germination and seedling growth of naked barley. Seed, 32(11): 34-37, 41. (in Chinese)

[38]
Zhao Y X, Xiao D P, Bai H Z et al., 2019a. Research progress on the response and adaptation of crop phenology to climate change in China. Progress in Geography, 38(2): 224-235. (in Chinese)

[39]
Zhao Y X, Xiao D P, Tang J S et al., 2019b. Effects of climate change on the yield of major grain crops and its adaptation measures in China. Research of Soil and Water Conservation, 26(6): 317-326. (in Chinese)

[40]
Zhao Y Y, Wang J, Zhang L et al., 2015b. Analysis of arable land requirement for protecting the self-supply of grains under new food security policy. Journal of Arid Land Resources and Environment, 29(8): 1-6. (in Chinese)

Outlines

/