An optimized baseflow separation method for assessment of seasonal and spatial variability of baseflow and the driving factors

  • SUN Jiaqi , 1, 2 ,
  • WANG Xiaojun 2, 3 ,
  • Shamsuddin SHAHID 4 ,
  • LI Hongyan 5, 6
Expand
  • 1. College of Hydrology and Water Resources, Hohai University, Nanjing 210098, China
  • 2. State Key Laboratory of Hydrology-Water Resources and Hydraulic Engineering, Nanjing Hydraulic Research Institute, Nanjing 210029, China
  • 3. Research Center for Climate Change, Ministry of Water Resources, Nanjing 210029, China
  • 4. School of Civil Engineering, Faculty of Engineering, Universiti Teknologi Malaysia (UTM), Johor Bahru 81310, Malaysia
  • 5. College of New Energy and Environment, Jilin University, Changchun 130021, China
  • 6. Key Laboratory of Groundwater Resources and Environment, Ministry of Education, Jilin University, Changchun 130021, China

Sun Jiaqi (1992‒), PhD, specialized in hydrology and water resources. E-mail:

Received date: 2020-08-19

  Accepted date: 2021-03-09

  Online published: 2022-02-25

Supported by

National Key R&D Program of China(2017YFC0403506)

Young Top-Notch Talent Support Program of National High-level Talents Special Support Plan and Strategic Consulting Projects of Chinese Academy of Engineering(2016-ZD-08-05-02)

Copyright

Copyright reserved © 2021. Office of Journal of Geographical Sciences All articles published represent the opinions of the authors, and do not reflect the official policy of the Chinese Medical Association or the Editorial Board, unless this is clearly specified.

Abstract

Baseflow is an important component of river or streamflow. It plays a vital role in water utilization and management. An improved Eckhardt recursive digital filter (IERDF) is proposed in this study. The key filter parameter and maximum baseflow index (BFImax) were estimated using the minimum smoothing method to improve baseflow estimation accuracy. The generally considered BFImax of 0.80, 0.50 and 0.25 according to the drainage basin’s predominant geological characteristics often leads to significant errors in the regions that have complex subsurface and hydrologic conditions. The IERDF improved baseflow estimation accuracy by avoiding arbitrary parameter values. The proposed method was applied for baseflow separation in the upstream of Yitong River, a tributary of the Second Songhua River, and its performance was evaluated by comparing the results obtained using isotope-tracer data. The performance of IERDF was also compared with nine baseflow separation techniques belonging to filter, BFI and HYSEP methods. The IERDF was also applied for baseflow separation and calculation of rainfall infiltration recharge coefficient at different locations along the Second Songhua River’s mainstream for the period 2000-2016. The results showed that the minimum smoothing method significantly improved BFImax estimation accuracy. The baseflow process line obtained using IEDRF method was consistent with that obtained using isotope 18O. The IERDF estimated baseflow also showed stability and reliability when applied in the mainstream of the Second Songhua River. The BFI alone in the river showed an increase from the upstream to the downstream. The proportion of baseflow to total flow showed a decrease with time. The intra-annual variability of BFI was different at different locations of the river due to varying climatic conditions and subsurface characteristics. The highest BFI was observed at the middle reaches of the river in summer due to a water surplus from power generation. The research provided valuable information on baseflow characteristics and runoff mode determination, which can be used for water resources assessment and optimization of economic activity distribution in the region.

Cite this article

SUN Jiaqi , WANG Xiaojun , Shamsuddin SHAHID , LI Hongyan . An optimized baseflow separation method for assessment of seasonal and spatial variability of baseflow and the driving factors[J]. Journal of Geographical Sciences, 2021 , 31(12) : 1873 -1894 . DOI: 10.1007/s11442-021-1927-8

1 Introduction

The river flow consists of two major components, direct flow of rainwater through the land surface and indirect flow through the subsurface (Zhang, 2019; Hu, 2019; Stewart, 2015). The subsurface flow, also known as baseflow, is vital for runoff forecasting, water resources evaluation, and water resources management (Rumsey, 2015). Precipitation is the source of baseflow, but it is also affected by many other factors, including soil properties, underlying geological structure and impermeable layer, and groundwater abstraction. The precipitation goes through a series of complex hydrologic processes, including infiltration through the land surface, percolation to either above or below an impermeable layer and movement through a three-dimensional subsurface structure to finally discharge as baseflow (Price, 2011).
Estimating baseflow is essential for evaluating groundwater’s annual contribution to rivers and assessing regional water resources availability (Watson, 2019). It is also necessary for the estimation of ecological water demand of river basin. Therefore, baseflow separation is an important part of water resources management, water conservancy construction, flood control and drought resistance and water pollution risk assessment (Chen, 2006).
A large number of methods have been proposed for the separation of baseflow from river flow. Isotope-tracer technique based on mass conservation is the most reliable method of baseflow estimation. It uses only the experimental data for baseflow estimation, and thus, free of subjectivity. However, it is a highly laborious and expensive method and difficult to apply to the longer hydrological record. Several automated methods have been proposed to overcome the isotope-tracer method’s difficulties (Koskelo et al., 2012; Klaus et al., 2013). Among them, the graphical method (Xie, 2020) and the analytical method (Zhang, 2013) are the most classical and widely used approaches. The graphical method’s major disadvantage is the subjectivity, where operators must be familiar with the river basin’s hydrologic features for accurate baseflow estimation. The analytical method’s major drawback is its dependency on multiple parameters, which is always prone to considerable error (Furey, 2001). In this regard, several signal analysis approaches have been proposed and successfully employed for baseflow separation. The signal analysis methods are broadly classified as filters and recursive digital filters (RDF). The river flow data is considered a digital signal, and it is analyzed using sophisticated digital signal processing algorithms in RDF. This often provides the RDF methods with an edge over the analytical filtering methods. A large number of digital filters have been used for the development of RDF. The Eckhardt recursive digital filter (ERDF) is one of the most efficient methods that uses only two parameters for baseflow separation: recession constant and maximum value of baseflow index (BFImax) or the ratio of baseflow to total streamflow.
Many studies have been conducted using ERDF for baseflow separation. Dong et al.(2012) used ERDF and the minimum smoothing method for separation of baseflow in the Shulehe River Basin of Qilian Mountain and compared their performance by analyzing baseflow changes and related factors. They reported the reliability of ERDF in baseflow separation. Li (2013) used ERDF for baseflow separation in Nenjiang River Basin and showed better performance of ERDF with suitable filter parameters. Gao (2018) adopted ERDF to divide the baseflow at three locations of the Meijiang River Basin of Guangdong province and analyzed its spatial distribution characteristics. They reported the uncertainty of filter parameters on output accuracy. Ahiablame et al. (2013) applied ERDF to predict BFI in a catchment in Indiana, the United States of America (USA) and showed its accuracy in BFI estimation. The studies also revealed that ERDF can solve the redundancy and inefficiency of manual separation of baseflow and provide good accuracy in baseflow estimation. Therefore, ERDF has been most widely used for baseflow separation (Liu, 2017).
A major drawback of ERDF is that it always considers a rapid change in river flow as surface runoff. However, different activities like extensive extraction of water can also cause such changes. Therefore, several attempts have been made to improve the performance of ERDF. For example, precipitation was incorporated in river flow analysis using ERDF for better estimation of baseflow. Wittenberg (1999) proposed a nonlinear storage process to segment the underground runoff to better represent baseflow. However, the major challenge in reliable separation of baseflow using ERDF is determining an appropriate value of BFImax. Eckhardt et al. (2005) provided the empirical values of BFImax, based on the results obtained at 65 basins in the USA. These empirical values of BFImax have been widely used for baseflow separation in different regions of the globe. However, the estimated BFImax values in USA condition are not reliable for accurate baseflow estimation in all regions. It is required to determine BFImax based on local hydrogeological conditions. According to subsurface and hydrologic conditions of the river basin, simply setting BFImax value as 0.80, 0.50 or 0.25 inevitably leads to significant errors. Estimation of BFImax is a critical step for the application of Eckhardt method. Researchers used different methods to estimate BFImax values according to the actual setup of the research area. Zhang (2017) showed that it is imperative to obtain appropriate parameters when applying the digital filtering method to baseflow separation. He used the UKIH methods to estimate (BFImax). The results showed that the UKIH estimated maximum baseflow index can avoid empirical judgements of BFImax, and can probably reduce error in baseflow estimates. Collischonn (2013) proposed a method to estimate BFImax using a backwards filtering operation. In cases where different aquifers exist within the same drainage basin, the BFImax parameter obtained by applying the backwards running filter can generate intermediate values in the range from 0.25 to 0.80. By visually comparing baseflow hydrographs obtained using pre-defined BFImax values (0.80, 0.50 and 0.25) with BFImax values obtained using the backwards filtering operation, the latter seems to be better.
For the critical parameter of ERDF, BFImax is routinely estimated by a priori defined values according to the drainage basin’s predominant geological characteristics. However, for regions with complex subsurface and hydrologic conditions, the simple selection of 0.80, 0.50 and 0.25 is often inconsistent with the river basin’s actual situation, which inevitably leads to significant errors. Therefore, the BFImax was modified in this study to improve the capability of ERDF in baseflow separation (Shao, 2020). The Improved ERDF (IERDF) was estimated using a minimum smoothing method. The performance of the improved method was evaluated by comparing its results with that obtained using isotope hydrochemical method. The performance of IERDF was also compared with nine baseflow separation methods belonging to three categories. The improved ERDF (IERDF) method was applied in baseflow separation in the Second Songhua River Basin to analyze the Second Songhua River’s baseflow characteristics from upstream to downstream. Finally, the recharge coefficient of regional rainfall infiltration was calculated based on the segmented baseflow. It is expected that the findings of the study would provide important information for the characterization of Second Songhua River flow, the determination of the mode of runoff formation, redistribution of water resources, and optimization of the spatial distribution of economic activity in the basin.

2 Overview of the study area

The Second Songhua River, originating from the Tianchi Lake of the Changbai Mountains, is 958 km long. It has a drainage area of approximately 78,180 km2, lying between 41°44'N-45°24'N and 124°36'E-128°50'E. The Second Songhua River Basin accounts for 14.33% of the total drainage area of the Songhua River. The basin’s elevation is low in the northwest and high in the southeast (Figure 1). Therefore, the river flows from the southeast to the northwest. The Changbai mountainous area is the source region of the river. Its transitional section from the hills to the Songnen Plain extends from Fengman Hydropower Station to the Mushi River’s middle reaches. The elevation of both sides of the hills is 300-500 m. The width of the river valley is 500 m on average, and the ratio is 0.14%-0.45%. Branches and shoals appear in the river from time to time. The vast stretches of the river valleys are extensively used for agricultural activities (Wang, 2018).
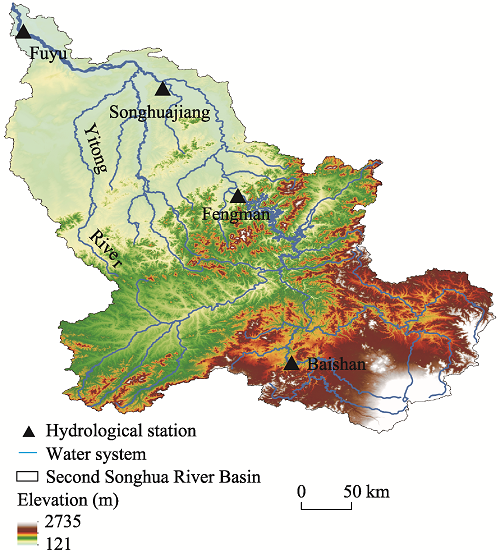
Figure 1 The location of the Second Songhua River Basin. The river system and the location of rainfall and river flow observation stations are also given.
The basin has a continental monsoon climate, consisting of four seasons. The temperature in the basin gradually decreases from northwest to southeast, with an annual mean temperature of 2.9-4.2ºC. Several water conservancy projects were built on the mainstream and tributaries of the Second Songhua River. Among which the Baishan and Fengman hydropower stations play a significant role in regulating runoffs. The basin area controlled by Fengman Reservoir is 42,500 km2, accounting for ~55% of the Second Songhua River Basin. The Baishan Hydropower Station, located at Huadian city, is about 200 km away from the Fengman Hydropower Station. It has a controlled basin area of 19,000 km2, accounting for 44.7% of the total basin area above the Fengman Station.
The Yitong River is a secondary tributary of the Second Songhua River (Figure 1). The Yitong River Basin’s terrain is relatively flat, with a mild slope declining from the southeast to the northwest. The southeast of the basin is a gentle hill with an elevation between 300 and 400 m. The hills are distributed in strips between the mountains and the plain. The valley plain with an elevation below 200 m is distributed on both sides of the Yitong River and its tributaries. The Yitong River Basin is located at the eastern margin of the mid-latitude Eurasian continent and belongs to the north temperate continental monsoon climate zone. The annual mean precipitation, temperature, evaporation, sunshine duration and wind speed are 591.5 mm, 5.29ºC, 1655.9 mm, 2633.2 h, and 4.06 m/s, respectively.

3 Research methods and data sources

3.1 Research methods

3.1.1 Improved Eckhardt recursive digital filtering method (IERDF)
ERDF method was proposed by Eckhardt (2008). A recursive digital filter can be presented as follows (Novita, 2016):
${{q}_{t}}=\frac{1-BF{{I}_{\text{max}}}*\alpha *{{q}_{t-1}}+\left( 1-\alpha \right)*BF{{I}_{\text{max}}}*{{Q}_{t}}}{1-\alpha *BF{{I}_{\text{max}}}}$
where a is the filter parameter; BFImax is the maximum runoff index or the ration of subsurface flow to river runoff, and q is base flow (m³/s). According to subsurface and hydrologic conditions of the river basin, the value of BFImax is generally considered between 0.25 and 0.80 (Kissel, 2020).
In this study, a minimum smoothing method was used to segment the river runoff, and then the subsurface runoff index, BFI, was calculated for each hydrological year. Finally, the largest BFI was considered as BFImax (Figure 2). Details are presented in the following subsections.
Figure 2 The specific description of an improved Eckhardt recursive digital filter
3.1.2 Baseflow index (BFI) method
The British Hydrological Institute (Wels, 1991) proposed the smoothing minimum method for baseflow separation. The method’s basic principle is to divide N days into 365/N fractions and determine each period’s minimum flow value. If the product of the minimum flow rate value and the inflexion point test factor in a certain period is less than the minimum flow rate value in the adjacent left and right periods, then the inflexion point is confirmed (Figure 3). The process is repeated to identify all the inflexion points meeting the daily flow rate sequence conditions. The baseflow process line is obtained by connecting all the inflexion line, and the area under the process line is considered the baseflow volume (Liu, 2019). The BFI method can be broadly classified into two, BFI (F) and BFI (K). The test factors, F and K of the inflexion point, generally take the empirical value of 0.9 and 0.97915, respectively. The N value determination is the key in the runoff separation using the smoothing minimum method. Usually, a trial-and-error method is used for this purpose.
Figure 3 The procedure used for the estimation of baseflow volume process line
3.1.3 Hydrograph Separation (HYSEP) method
The HYSEP method, proposed by Petty (1979), is later simplified and refined by the US Geological Survey as HYSEP (Fixed), HYSEP (Slide), and HYSEP (Localmin). The empirical formula generally used to calculate the duration of direct runoff,
$N={{\left( 2.59A \right)}^{0.2}}$
where A is the river basin area (km2), and N is the duration (days) of direct runoff. The time interval is usually 3 to 11 days. An odd number closest to 2N is chosen as the time interval for baseflow calculation.
3.1.4 Lyne-Hollick filter method (F1)
The Lyne-Hollick filter method, proposed by Lyne (1979), was improved by Nathan and McMahon in 1990. The Lyne-Hollick filter can be presented as:
${{R}_{t}}={{f}_{1}}*{{R}_{t-1}}+\left( 1+{{f}_{1}} \right)*{{f}_{2}}*\left[ {{Q}_{t}}-{{Q}_{t-1}} \right]$
${{q}_{t}}={{Q}_{t}}-{{R}_{t}}$
where f1 and f2 are filter parameters (usually considered 0.5), Q is river runoff (m³/s), R is direct runoff (m³/s); q represents baseflow (m³/s), and t is time.
3.1.5 Chapman digital filtering method (F2)
The Chapman digital filtering method, proposed by Chapman (1991), can be presented as:
${{R}_{t}}=\frac{3*{{f}_{1}}-1}{3-{{f}_{1}}}*{{R}_{t-1}}+\frac{2}{3-{{f}_{1}}}*\left[ {{Q}_{t}}-{{Q}_{t-1}} \right]$
${{q}_{t}}={{Q}_{t}}-{{R}_{t}}$
3.1.6 Chapman-Maxwell filtering method (F3)
The Chapman-Maxwell filtering method (Chapman, 1996) is presented in Equation (7):
${{q}_{t}}=\frac{{{f}_{1}}}{2-{{f}_{1}}}*{{q}_{t-1}}+\frac{1-{{f}_{1}}}{2-{{f}_{1}}}*{{Q}_{t}}$
3.1.7 Boughton-Chapman filtering method (F4)
The Boughton-Chapman filtering method (Chapman, 1999) is presented in Equation (8):
${{q}_{t}}=\frac{{{f}_{1}}}{1+{{f}_{2}}}*{{q}_{t-1}}+\frac{{{f}_{2}}}{1+{{f}_{2}}}*{{Q}_{t}}$

3.2 Research data

The data used in this study include: (1) the daily runoff data in the upstream of the Second Songhua River tributary and the Yitong River during June-September 2016; (2) the monitoring data of hydrogen and oxygen-18 (18O) of precipitation and river and groundwater for the period June-September 2016; (3) the measured daily runoff data at Fuyu, Songhua, Fengman hydrological stations and Baishan hydrometric station of the Second Songhua River mainstream for the period 2000-2016; and (4) annual precipitation data for the period 2000-2009.

4 Contents

4.1 Parameter determination

According to Eckhardt, a suitable value of BFImax is different for different hydrogeologic conditions, such as (1) BFImax = 0.80 for the area that belongs to perennial river and dominated by porous aquifer, (2) BFImax = 0.50 for the area surrounding by seasonal rivers and dominated by porous aquifer, (3) BFImax = 0.25 for the area belongs to a seasonal river but dominated by a semi-porous aquifer. The value of a has little influence on baseflow separation. It is usually considered between 0.95 and 0.98. However, a significant error in baseflow may happen when only BFImax values of 0.80, 0.50, and 0.25 are used. Therefore, the minimum smoothing method was used in this study to estimate BFImax.
Determination of appropriate value for N is the key for separation of baseflow using minimum smoothing method. A trial-and-error method was used for this purpose. The accuracy of the method is confirmed by evaluating the N value based on the daily runoff data during the flood season (June-September) in the Yitong River and calculating the BFI (f = 0.9) for N values of 1 to 10. Obtained results are presented in Figure 4.
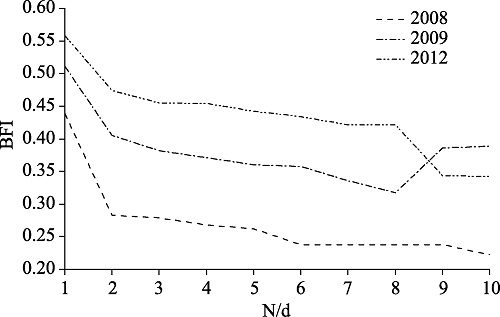
Figure 4 Relationship between the number of days and baseflow index
The results revealed that BFI gradually decreases and tends to be flat with an increase of N (Figure 4). At the desired value of N, a sharp decrease of BFI occurs. The proportion of direct runoff in the segmented subsurface runoff decreases to zero. The part that is subdivided into a direct runoff but originally belongs to subsurface runoff becomes negligible. Figure 4 shows that when N≥2, the BFI tends to be flat and therefore, the baseflow separation was performed for a period of 2d.
When N = 2, the baseflow calculated for the Yitong River Basin (Table 1) was more reasonable. The BFI in 2015 was the largest, hence, resulting in BFImax = 0.76. This value of BFImax was used in ERDF equation for the improvement of its performance.
Table 1 Baseflow index estimated for different years in the Yitong River Basin
Years BFI Years BFI
2003 0.15 2010 0.09
2004 0.32 2011 0.72
2005 0.21 2012 0.47
2006 0.07 2013 0.22
2007 0.19 2014 0.61
2008 0.28 2015 0.76
2009 0.41 2016 0.31
Isotope is a reliable flow separation method with a clear physical basis. Therefore, it is considered as the most precise method of baseflow separation. The performance of IERDF method in baseflow separation was evaluated using the isotope hydration method. The hydrogen and oxygen isotopes of precipitation, river water and groundwater during the monitoring period were collected, and the baseflow was calculated using the principle of conservation of isotope and mass conservation. At the same time, the minimum smoothing method was used to determine the value of N and BFImax. The IERDF for N = 1 (BFImax = 0.86), N = 2 (BFImax = 0.76) and N = 3 (BFImax = 0.72) were compared with isotope 18O runoff separation results, as shown in Figure 5. The figure shows that baseflow separated by IERDF with N = 2 matches well with that obtained using isotope18O. The results indicated that the N value selected using the trial-and-error method was reasonable.
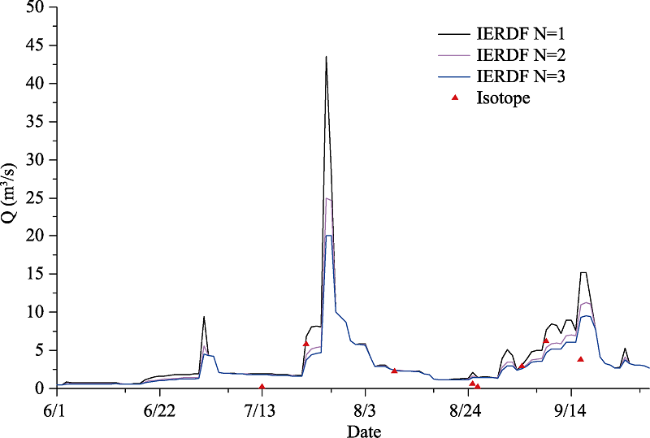
Figure 5 Comparison of separation results using improved Eckhardt recursive digital filter for different N values and isotope 18O

4.2 The applicability of different baseflow separation methods

Baseflow at the Yitong River Basin’s upper reaches was separated for the period 2003-2016 using different methods and the BFI for each year and each method was calculated. The results obtained using different methods were compared to determine the stability and reliability of the methods. Table 2 presents the annual BFI statistics estimated using various methods, including mean, extremum ratio, variance, and coefficient of variation (CV).
Table 2 Statistics of baseflow index estimated using different methods
Year HYSEP
(Fixed)
HYSEP
(Slide)
HYSEP
(Local min)
BFI (F) BFI (K) F1 F2 F3 F4 IERDF
2003 0.13 0.13 0.15 0.15 0.15 0.24 0.21 0.22 0.33 0.26
2004 0.28 0.28 0.29 0.32 0.32 0.39 0.33 0.34 0.49 0.41
2005 0.20 0.17 0.10 0.21 0.22 0.32 0.30 0.31 0.44 0.35
2006 0.01 0.01 0.10 0.07 0.07 0.20 0.18 0.20 0.32 0.23
2007 0.15 0.15 0.14 0.19 0.19 0.30 0.27 0.28 0.41 0.32
2008 0.27 0.26 0.29 0.28 0.30 0.38 0.34 0.36 0.48 0.40
2009 0.39 0.37 0.36 0.41 0.41 0.45 0.37 0.40 0.51 0.45
2010 0.07 0.08 0.07 0.09 0.09 0.21 0.19 0.21 0.33 0.23
2011 0.61 0.62 0.73 0.72 0.73 0.69 0.48 0.57 0.69 0.67
2012 0.48 0.46 0.45 0.47 0.55 0.57 0.46 0.47 0.62 0.57
2013 0.17 0.18 0.17 0.22 0.22 0.32 0.27 0.29 0.45 0.35
2014 0.55 0.54 0.56 0.61 0.61 0.64 0.46 0.50 0.66 0.61
2015 0.67 0.67 0.60 0.76 0.77 0.66 0.44 0.48 0.68 0.62
2016 0.24 0.23 0.20 0.31 0.31 0.34 0.29 0.31 0.43 0.36
Average 0.30 0.30 0.30 0.34 0.35 0.41 0.33 0.35 0.49 0.42
Maximum 0.67 0.67 0.73 0.76 0.77 0.69 0.48 0.57 0.69 0.67
Minimum 0.01 0.01 0.07 0.07 0.07 0.20 0.18 0.20 0.32 0.23
Extremum 67 67 10.28 11.08 11.32 3.45 2.67 2.85 2.16 2.96
Variance 0.04 0.04 0.04 0.05 0.05 0.03 0.01 0.01 0.02 0.02
CV 0.69 0.70 0.70 0.65 0.65 0.41 0.31 0.33 0.26 0.35
The result of various separation methods showed considerable inconsistency. The base flow separation index extremum ratio, variance and CV for five digital filtering methods were smaller than that obtained using YSEP and BFI. This indicates a lower degree of dispersion in the results of digital filtering methods, while BFI (F) and BFI (K) showed the most significant deviation. Therefore, the baseflow segmented by digital filters is more stable. Besides, the baseflow process line showed that the separation process of BFI and HYSEP did not show a decrease of baseflow in the flood season (July to September) (Figures 6 and 7). This also indicated higher reliability of baseflow separation by digital filters. Figure 8 shows that the baseflow peak value obtained using digital filters lags behind the river runoff’s peak value, and the baseflow volume does not exceed the river runoff volume. Moreover, the subsurface runoff fluctuates slowly in the wet season, and the subsurface runoff process line in the dry season is consistent with that of the river runoff.
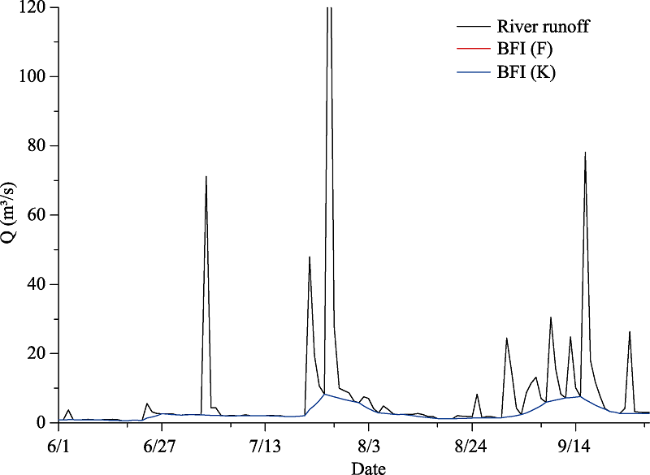
Figure 6 The baseflow calculated using BFI methods in the upper reaches of Yitong River Basin in flood season (July-September) of 2016
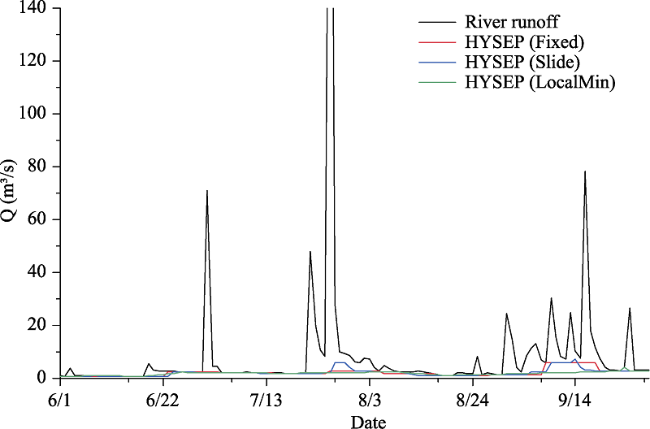
Figure 7 The baseflow calculated using HYSEP methods in the upper reaches of Yitong River Basin in flood season (July-September) of 2016
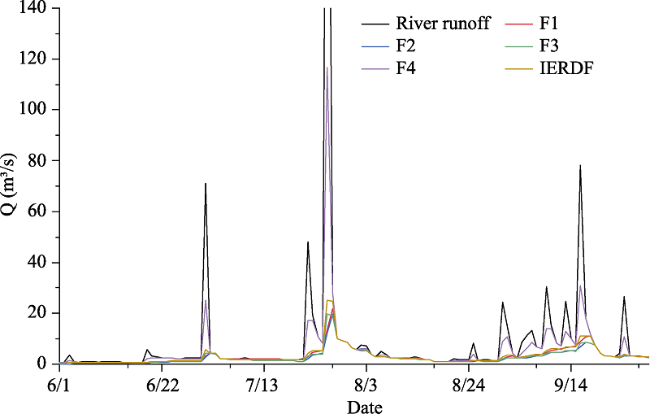
Figure 8 The baseflow calculated using digital filtering methods in the upper reaches of Yitong River Basin in flood season (July-September) of 2016
Comparison of performance of digital filters showed the largest fluctuation in baseflow for F4 while the baseflow segmented by F1, F2, and F3 were found to overlap each other. The baseflow segmented by IERDF was found to fluctuate between F4 and F1-F3 (Figure 8). The stability and adaptability of baseflow separation method were explored from the interannual and annual changes. The results obtained in this study revealed good stability and reliability in baseflow separation in Yitong River Basin by IERDF method.

4.3 Analysis of the baseflow characteristics of Second Songhua River

The IERDF was also used to analyze runoff at four hydrologic stations at the Second Songhua River mainstream from upstream to downstream for 2000-2016 (a=0.98). The results are shown in Tables 3-6. The results revealed that the multi-year average BFI index was 0.54 at Baishan station in the upstream, 0.40 at Fengzhuang in between the upper and middle stream, 0.81 at Songhuajiang in the middle stream, and 0.83 at Fuyu station in the downstream. The BFI values above Fuman station were found lower than that obtained at stations in the middle and lower reaches (Songhuajiang and Fuyu) because of the basin’s elevation, which decreases from the southeast to the northwest, with Changbai Mountains and Songliao Plain in the east and west, respectively. High rainfall in Baishan Mountain forms high surface runoff. The baseflow in Fengman and Baishan Mountainous areas are also affected by power generation and water discharge from respective power plants. Besides, Fengman is a major agricultural production area where water-intensive crops such as corn and rice are cultivated, and flooded irrigation is practised in the transition area between hills and Songnen Plain. Because of frequent groundwater exploitation and water reclamation activities, the multi-year BFI in the downstream Fengman station was lower than that in the high terrain of the Baishan area.
Table 3 Annual runoff separation results at Baishan station
Year River runoff (m3/s) Direct runoff (m3/s) Underground runoff (m3/s) BFI
2000 212.12 87.05 125.08 0.59
2001 221.24 85.70 135.54 0.61
2002 147.64 63.20 84.44 0.57
2003 142.57 59.84 82.73 0.58
2004 202.75 86.72 116.03 0.57
2005 296.11 137.73 158.38 0.53
2006 156.60 73.85 82.75 0.53
2007 190.82 101.37 89.45 0.47
2008 140.72 75.43 65.29 0.46
2009 155.20 79.26 75.94 0.49
2010 373.55 174.17 199.38 0.53
2011 177.43 84.45 92.98 0.52
2012 228.51 108.85 119.66 0.52
2013 358.62 172.61 186.01 0.52
2014 160.14 81.48 78.66 0.49
2015 147.36 61.89 85.47 0.58
2016 262.21 111.76 150.45 0.57
Table 4 Annual runoff separation results at Fengman station
Year River runoff (m3/s) Direct runoff (m3/s) Underground runoff (m3/s) BFI
2000 284.55 172.28 112.27 0.39
2001 398.51 208.49 190.02 0.48
2002 245.58 136.75 108.83 0.44
2003 213.15 118.43 94.72 0.44
2004 343.99 210.92 133.08 0.39
2005 549.18 349.21 199.98 0.36
2006 274.16 176.16 98.00 0.36
2007 281.44 168.43 113.01 0.40
2008 254.71 151.23 103.48 0.41
2009 265.89 154.38 111.51 0.42
2010 766.54 447.31 319.23 0.42
2011 301.06 185.50 115.56 0.38
2012 363.10 194.37 168.73 0.46
2013 738.79 450.25 288.54 0.39
2014 275.52 200.50 75.02 0.27
2015 243.12 134.52 108.60 0.45
2016 409.15 249.05 160.10 0.39
Table 5 Annual runoff separation results at Songhuajiang station
Year River runoff (m3/s) Direct runoff (m3/s) Underground runoff (m3/s) BFI
2000 357.85 64.27 293.58 0.82
2001 388.99 69.45 319.54 0.82
2002 332.28 53.96 278.32 0.84
2003 241.76 41.97 199.79 0.83
2004 373.34 64.65 308.69 0.83
2005 641.87 124.66 517.21 0.81
2006 419.45 78.95 340.50 0.81
2007 343.32 68.38 274.94 0.80
2008 329.22 64.11 265.11 0.81
2009 338.13 61.01 277.12 0.82
2010 745.48 142.37 603.11 0.81
2011 478.52 86.57 391.95 0.82
2012 325.96 65.96 260.00 0.80
2013 885.01 166.49 718.52 0.81
2014 441.38 89.71 351.67 0.80
2015 217.09 38.60 178.49 0.82
2016 542.17 111.12 431.05 0.80
Table 6 Annual runoff separation results at Fuyu station
Year River runoff (m3/s) Direct runoff (m3/s) Underground runoff (m3/s) BFI
2000 289.64 45.40 244.23 0.84
2001 359.52 57.27 302.25 0.84
2002 355.19 52.25 302.94 0.85
2003 258.60 39.81 218.79 0.85
2004 369.24 55.71 313.53 0.85
2005 674.09 113.41 560.68 0.83
2006 455.33 74.04 381.29 0.84
2007 362.28 60.68 301.60 0.83
2008 398.15 71.29 326.86 0.82
2009 379.31 59.86 319.45 0.84
2010 890.99 147.28 743.71 0.83
2011 489.15 83.64 405.51 0.83
2012 316.98 63.14 253.85 0.80
2013 950.16 170.08 780.08 0.82
2014 456.20 97.57 358.63 0.79
2015 200.56 40.73 159.83 0.80
2016 541.10 101.06 440.04 0.81
The baseflow process line at Baishan, Fengman, Songhuajiang and Fuyu stations for 2014-2016 is shown in Figure 9. A rational analysis was conducted for the separation of baseflow at the locations. The flow line should meet several conditions: peak value of baseflow lags peak value of river runoff, the baseflow amount cannot exceed the river runoff amount, baseflow fluctuation during the wet season is less, and the pattern of baseflow and river runoff should be the same. Figure 9 reveals that the baseflow estimated using IERDF was consistent with the above-mentioned conditions and could be considered acceptable.
Figure 9 Baseflow process line at (a) Baishan; (b) Fengman; (c) Songhuajiang; (d) Fuyu along the Second Songhua River mainstream
The inter-annual changes of BFI estimated using IERDF method at the main hydrologic stations of the Second Songhua River mainstream are shown in Figure 10. The results showed a downward trend in BFI since 2000, indicating that the proportion of baseflow to the total runoff in the basin was declining with time. The extremum maximum was the highest at Fengman (1.75), followed by Baishan (1.32), Fuyu (1.08), and Songhuajiang (1.05) stations. The construction of water conservancy projects above Fengman has changed the area’s underlying surface condition and affected the water balance in the basin, thus changing the travel time of baseflow. The results indicated that the construction of water conservancy projects in the basin caused a certain degree of impact on river flow attenuation.
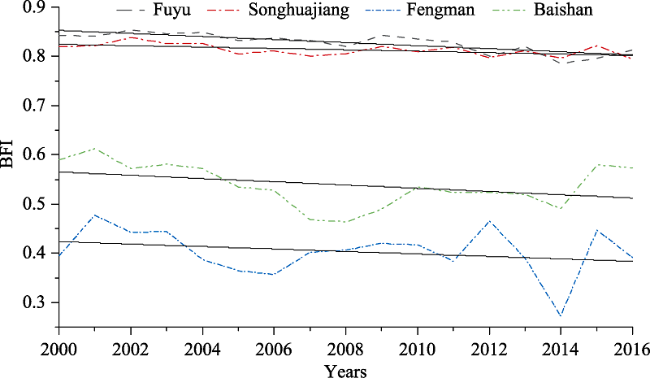
Figure 10 Inter-annual variations in the baseflow index at different locations along the Second Songhua River mainstream
Precipitation is the main factor affecting the baseflow. The increase in precipitation increases baseflow and BFI to a certain extent. Global warming leads to more snowmelt and soil degradation, which indirectly influences the baseflow. The Second Songhua River mainstream is recharged by snowmelting water and precipitation. The BFI also varies from upstream to downstream along the mainstream because of different climatic conditions and surface hydrological characteristics in different locations. Winter (November to March) temperatures and precipitations at Fuyu and Songhuajiang are lower than that at Fengman (Figures 11 and 12). The water supply of rivers during summer mainly depends on the release of groundwater stored in soil and the near-surface. Temperature increases with spring arrival (March to May) when glacial snow begins to melt, infiltrates and recharges groundwater, eventually discharging as baseflow. Spring ploughing in northeastern China occurs typically at the end of April or the beginning of May. The BFI decreased to a minimum at the end of June and early July due to increased groundwater exploitation for irrigation, water diversion and the consequent decrease in river runoff. Temperature and precipitation are high in summer and fall (July to November) when river flow reached its peak due to precipitation and snow-melting.
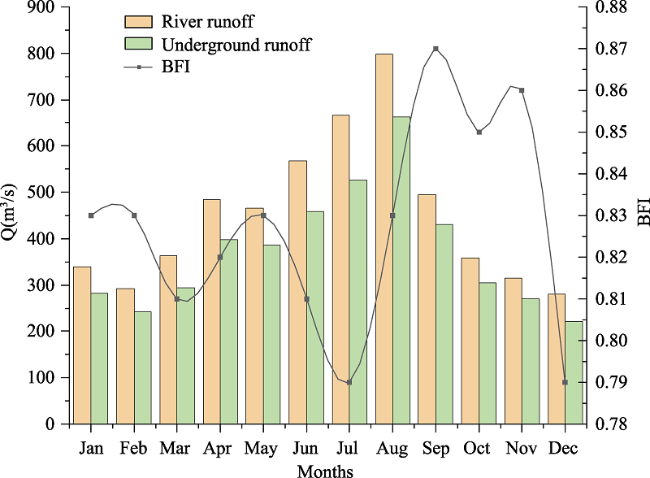
Figure 11 Intra-annual variation of baseflow and BFI calculated using improved Eckhardt recursive digital filtering method at Fuyu station
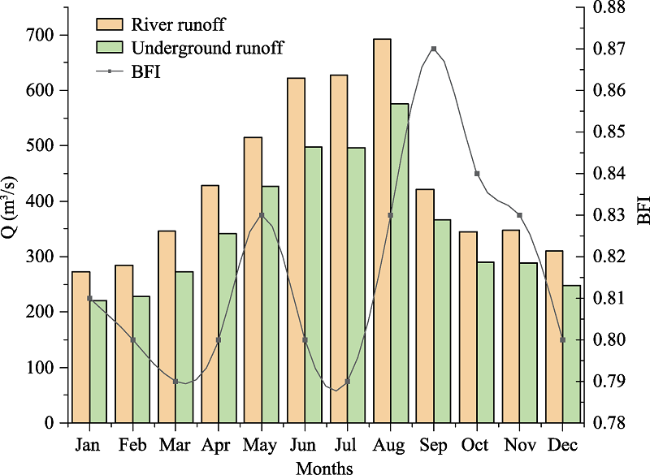
Figure 12 Intra-annual variation of baseflow and BFI calculated using improved Eckhardt recursive digital filtering method at Songhuajiang station
A large number of reservoirs exists in the areas above Fengman. The construction of these water conservancy projects has changed the underlying water circulation status in the basin. It also changed the baseflow pattern in Songhua River’s downstream area (Figures 13 and 14). Winter (November to March) river flow mainly depends on groundwater release, and therefore, baseflow is most closely related to the monthly runoff. A substantial increase of BFI occurs in spring (March to May) due to the rise of temperature, which causes an increase in water supply from snowmelt. The BFI in this season is also influenced by power generation at Fengman and Baishan power plants and spring plough release. The BFI decreases when the reservoir is discharged in summer and fall (June to November). The BFI reaches a maximum in late August and early September due to higher temperature, increased precipitation and summer power generation.
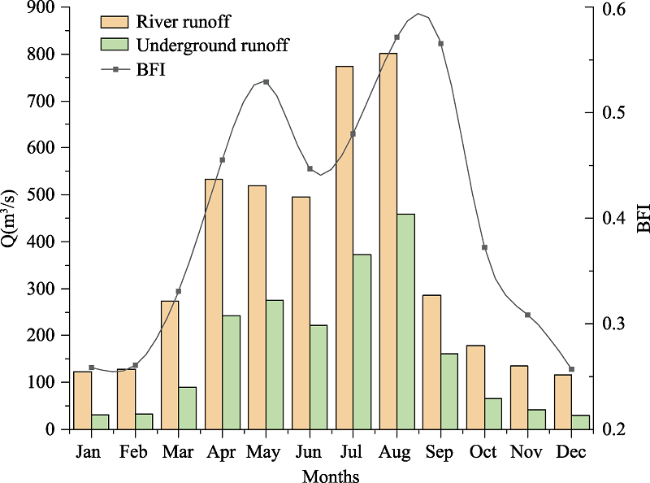
Figure 13 Intra-annual variation of baseflow and BFI calculated using improved Eckhardt recursive digital filtering method at Fengman station
Figure 14 Intra-annual variation of baseflow and BFI calculated using improved Eckhardt recursive digital filtering method at Baishan station

4.4 Regional rainfall infiltration supply coefficient calculation

A portion of infiltrated rainfall reaches the saturated zone and recharges groundwater, which eventually discharges to the river as baseflow. The Second Songhua River Basin belongs to the all-drainage basin. The multi-year average value indicates that the whole drainage basin’s baseflow is equivalent to groundwater recharge. Therefore, the rainfall infiltration supply coefficient can be calculated based on multi-year baseflow (Gao, 2015).
The Fuyu and Songhuajiang Hydrological Stations, and Fengman and Baishan Dams, respectively were used as the water catchments to define their corresponding sub-basins. The average precipitation at those meteorological stations was considered as their respective sub-basin precipitation. Baseflow at Fuyu, Songhuajiang, Fengman and Baishan was calculated by multiplying the annual mean precipitation in m³/s by the water catchment area (71,783 km2 for Fuyu, 51,500 km2 for Songhuajiang, 42,500 km2 for Fengman, and 19,000 km2 for Baishan). The obtained results for the period 2000-2009 are given in Tables 7-10.
Table 7 Rainfall infiltration supply coefficient during 2000-2009 at Baishan station
Year Average rainfall Amount (mm) Baseflow amount
(mm)
Precipitation infiltration supply
coefficient
2000 838 208.17 0.25
2001 717 224.96 0.31
2002 714.1 140.15 0.20
2003 605.3 137.31 0.23
2004 777.1 193.12 0.25
2005 866.4 262.87 0.30
2006 676.8 137.35 0.20
2007 759 148.48 0.20
2008 628.2 108.66 0.17
2009 717.9 126.05 0.18
2000-2009 729.98 168.71 0.23
Table 8 Rainfall infiltration supply coefficient during 2000-2009 at Fengman station
Year Average rainfall Amount (mm) Baseflow amount
(mm)
Precipitation infiltration supply
coefficient
2000 650.00 83.54 0.13
2001 646.00 141.00 0.22
2002 640.00 80.75 0.13
2003 696.00 70.29 0.10
2004 712.00 99.02 0.14
2005 873.00 148.39 0.17
2006 671.06 72.72 0.11
2007 705.13 83.86 0.12
2008 662.00 76.99 0.12
2009 624.10 82.74 0.13
2000-2009 687.93 93.93 0.14
Table 9 Rainfall infiltration supply coefficient during 2000-2009 at Songhuajiang station
Year Average rainfall
Amount (mm)
Baseflow amount
(mm)
Precipitation infiltration
supply coefficient
2000 326.1 180.27 0.55
2001 309.4 196.21 0.63
2002 722.9 170.89 0.24
2003 605.9 122.68 0.20
2004 427.7 189.54 0.44
2005 591.3 317.58 0.54
2006 477 209.08 0.44
2007 319.5 168.82 0.53
2008 516.3 162.78 0.32
2009 423.1 170.16 0.40
2000-2009 471.92 188.80 0.43
Table 10 Rainfall infiltration supply coefficient during 2000-2009 at Fuyu station
Year Average rainfall
amount (mm)
Base low amount
(mm)
Precipitation infiltration
supply coefficient
2000 363.2 107.59 0.30
2001 272.9 132.79 0.49
2002 531.2 133.09 0.25
2003 437.3 96.12 0.22
2004 296 138.12 0.47
2005 498 246.32 0.49
2006 338.4 167.51 0.50
2007 273.6 132.50 0.48
2008 621.8 143.99 0.23
2009 394.2 140.34 0.36
2000-2009 402.66 143.84 0.38
Multi-year rainfall infiltration supply coefficients (2000-2009) at Baishan and Fengman were in the range of 0.10-0.31 with averages of 0.14 and 0.23, respectively. The rainfall infiltration supply coefficients at Fuyu and Songhuajiang, located below Fengman, were in the range of 0.20-0.63 with an average of 0.38 and 0.43, respectively. The rainfall infiltration values in the middle and upper reaches of the basin were greater than that in the middle and lower reaches. In this study, the separation of baseflow and the estimation of rainfall were done for their respective sub-basins. Therefore, the obtained results can be considered accurate.

5 Conclusions and discussion

The baseflow characteristics of the Second Songhua River mainstream were estimated by using IERDF. The following conclusions can be made from the results presented above:
(1) ERDF method proposed by Eckhardt simply set BFImax as 0.80, 0.50 and 0.25 according to subsurface and hydrologic conditions of the river basin. However, these values are always not appropriate for reliable separation of baseflow, leading to a significant error. In the IERDF method, the BFImax was estimated using the minimum smoothing method to improve the Eckhardt recursive digital filter’s performance in baseflow separation. This can help avoid using arbitrary values for BFImax based on local condition, which is often difficult to determine. The baseflow separated by IERDF with N=2 (BFImax=0.76) matched well with that obtained using isotope 18O. Considering BFImax as 0.50 in the ERDF method (seasonal river and pore aquifer dominance), the Second Songhua River Basin’s flows showed lower than the actual flow. Therefore, the IERDF method compared to ERDF method is more accurate. It can also reasonably calculate the process of baseflow in the Second Songhua River Basin.
(2) Comparison of performance of different baseflow separation methods revealed significant differences in results. The interannual and intra-annual variabilities of BFI estimated by different methods were compared to assess their stability and adaptability. The IERDF method showed better stability, reliability and applicability in baseflow separation compared to other methods.
(3) The BFI of the Second Songhua River mainstream showed an increasing trend from the upstream to the downstream. The effects of human activities (agricultural activities, groundwater exploitation and water withdrawal by the riverside) were noticed in the baseflow at Fengman, located between the middle and upper reaches. The multi-year BFI at Fengman, located at the lower reaches of Baishan Mountain, found lower than the baseflow at Baishan, located at a higher elevation. The BFI of the Second Songhua River showed a downward trend since 2000, indicating that the proportion of baseflow to the total runoff in the basin was decreasing over time.
(4) The Second Songhua River showed different intra-annual BFI from upstream to downstream due to different climatic conditions and subsurface characteristics. Winter flow at Fuyu and Songhua is mainly due to the release of groundwater stored in the aquifer during summer. In spring, glacial snowmelt recharges groundwater and thus, the BFI increases. At the end of April or early May, the river’s baseflow reduces due to increased groundwater exploitation and water diversion for irrigation. Hence the BFI value drops to the lowest in late June and early July. The baseflow reaches its peak in summer and autumn (July to November) due to an increase in precipitation. The highest BFI peaks were observed at Fengman and Baishan in summer due to a water surplus from power generation and spring release in May.
(5) The rainfall supply infiltration coefficient of different sub-basins revealed that the rainfall infiltration rate in the middle and upper reaches of the basin was higher than that in the middle and lower reaches.
The baseflow separation is always a major challenge in hydrology and eco-hydrology. In recent years, many studies have been conducted to improve the accuracy of baseflow separation methods. The present study revealed that the results obtained by different separation methods are not the same. Since baseflow separation involves multi-disciplinary sciences such as climate, physical geography and hydrogeology, a generally accepted reasonable separation method have not been found yet. The accurate estimation of baseflow is more challenging due to the lack of experimental data. Therefore, obtaining significant research progress in baseflow separation is more difficult compared to other analytical challenges in hydrology and water resources. A variety of baseflow separation methods, widely recognized globally, are employed in this study to estimate baseflow. All of them showed error to a certain extent in the estimation of baseflow. Due to baseflow’s definition and generation process, it is impossible to measure the baseflow accurately in a large basin using experimental means. It is also not possible to thoroughly verify the results obtained using the separation methods. The estimated values should only be as close as possible to the actual baseflow.
Further research is needed to better understand the baseflow process to device a more scientific and accurate separation method. As a future study, the parameters (a and BFImax) can be considered simultaneously in the two well parameterized digital filters to minimize the baseflow prediction’s uncertainty. The influence of the dam reservoir on baseflow is not fully considered in this study. Further study is needed to eliminate the influence of the dam reservoir on baseflow.
[1]
Ahiablame L, Chaubey I, Engel B et al., 2013. Estimation of annual baseflow at ungauged sites in Indiana USA. Journal of Hydrology, 476: 13-27.

DOI

[2]
Chapman T G, 1991. Comment on “Evaluation of automated techniques for base flow and recession analyses” by R J Nathan and T A McMahon. Water Resources Research, 27(7): 1783-1784.

DOI

[3]
Chapman T, 1999. A comparison of algorithms for stream flow recession and baseflow separation. Hydrological Processes, 13(5): 701-714.

[4]
Chapman T G, Maxwell I A, 1996. Baseflow separation-comparison of numerical methods with tracer experiments. National Conference Publication--Institute of Engineers Australia NCP. Institute of Engineers, Australia, 2: 539-546.

[5]
Chen L Q, Liu C M, Li F D, 2006. Reviews on base flow researches. Progress in Geography, 25(1): 1-15. (in Chinese)

[6]
Collischonn W, Fan F M, 2013. Defining parameters for Eckhardt’s digital baseflow filter. Hydrological Processes, 27(18): 2614-2622.

DOI

[7]
Dong W W, Ding Y J, Wei X, 2014. Variation of the base flow and its causes in the upper reaches of the Shule River in the Qilian mountains. Journal of Glaciology and Geocryology, 36(3): 661-669. (in Chinese)

[8]
Eckhardt K, 2005. How to construct recursive digital filters for baseflow separation. Hydrological Processes: An International Journal, 19(2): 507-515.

[9]
Eckhardt K, 2008. A comparison of baseflow indices, which were calculated with seven different baseflow separation methods. Journal of Hydrology, 352(1/2): 168-173.

[10]
Furey P R, Gupta V K, 2001. A physically based filter for separating base flow from streamflow time series. Water Resources Research, 37(11): 2709-2722.

DOI

[11]
Gao D D, Wu Y, Chen M et al., 2015. Baseflow separation and rainfall infiltration caculation of small watershed in Gongga mountain forest system. Resources and Environment in the Yangtze Basin, 24(6): 949-955. (in Chinese)

[12]
Gao L, 2018. Digital filter method with parameter uncertainty in the baseflow separation of Meijiang basin. Guangdong Water Resources and Hydropower, (7): 8-12. (in Chinese)

[13]
Hu G, Li X, 2019. Subsurface Flow. In: Li X, Vereecken H (eds). Observation and Measurement of Ecohydrological Processes. Ecohydrology, Vol 2. Berlin and Heidelberg: Springer.

[14]
Kissel M, Schmalz B, 2020. Comparison of baseflow separation methods in the German low mountain range. Water, 12(6): 1740.

[15]
Klaus J, McDonnell J J, 2013. Hydrograph separation using stable isotopes: Review and evaluation. Journal of Hydrology, 505: 47-64.

DOI

[16]
Koskelo A I, Fisher T R, Utz R M et al., 2012. A new precipitation-based method of baseflow separation and event identification for small watersheds (< 50 km2). Journal of Hydrology, 450: 267-278.

[17]
Li H Y, Zhang L, Zheng L Q et al., 2013. Application of recursive digital filtering method in groundwater flow separation in Nenjiang River Basin. Journal of Beijing Normal University (Natural Science), 49(6): 631-635. (in Chinese)

[18]
Liu X Y, Xie F F, 2017. Spatial-temporal differentiation of base flow in Nujiang River Basin based on digital filtering method. Water Resources Protection, 33(1): 18-23. (in Chinese)

[19]
Liu Z, Liu S, Ye J et al., 2019. Application of a digital filter method to separate baseflow in the small watershed of Pengchongjian in southern China. Forests, 10(12): 1065.

DOI

[20]
Lyne V, Hollick M, 1979. Stochastic time-variable rainfall-runoff modeling. Institute of Engineers Australia National Conference. Barton, Australia: Institute of Engineers Australia, 79(10): 89-93.

[21]
Novita E, Wahyuningsih S, 2016. Preliminary study on baseflow separation at watersheds in East Java regions. Agriculture and Agricultural Science Procedia, 9: 538-550.

DOI

[22]
Pettyjohn W A, Henning R, 1979. Preliminary estimate of groundwater recharge rates, related streamflow and water quality in Ohio. Ohio State University Water Resources Center Project Completion Report, 552.

[23]
Price K, 2011. Effects of watershed topography, soils, land use, and climate on baseflow hydrology in humid regions: A review. Progress in Physical Geography, 35(4): 465-492.

[24]
Rumsey C A, Miller M P, Susong D D et al., 2015. Regional scale estimates of baseflow and factors influencing baseflow in the Upper Colorado River Basin. Journal of Hydrology: Regional Studies, 4: 91-107.

DOI

[25]
Shao G, Zhang D, Guan Y et al., 2020. Application of different separation methods to investigate the baseflow characteristics of a semi-arid sandy area, northwestern China. Water, 12(2): 434.

DOI

[26]
Stewart M K, 2015. Promising new baseflow separation and recession analysis methods applied to streamflow at Glendhu Catchment, New Zealand. Hydrology and Earth System Sciences, 19(6): 2587-2603.

DOI

[27]
Wang M, Lei X, Liao W et al., 2018. Analysis of changes in flood regime using a distributed hydrological model: A case study in the Second Songhua River Basin, China. International Journal of Water Resources Development, 34(3): 386-404.

DOI

[28]
Watson A, Miller J, Fink M et al., 2019. Distributive rainfall-runoff modelling to understand runoff-to-baseflow proportioning and its impact on the determination of reserve requirements of the Verlorenvlei estuarine lake, West Coast, South Africa. Hydrology and Earth System Sciences, 23(6): 2679-2697.

DOI

[29]
Wels C, Cornett R J, Lazerte B D, 1991. Hydrograph separation: A comparison of geochemical and isotopic tracers. Journal of Hydrology, 122(1-4): 253-274.

DOI

[30]
Wittenberg H, 1999. Baseflow recession and recharge as nonlinear storage processes. Hydrological Processes, 13(5): 715-726.

DOI

[31]
Xie J, Liu X, Wang K et al., 2020. Evaluation of typical methods for baseflow separation in the contiguous United States. Journal of Hydrology, 583: 124628.

[32]
Zhang J, Song J, Cheng L et al., 2019. Baseflow estimation for catchments in the Loess Plateau, China. Journal of Environmental Management, 233: 264-270.

[33]
Zhang J, Zhang Y, Song J et al., 2017. Evaluating relative merits of four baseflow separation methods in Eastern Australia. Journal of Hydrology, 549: 252-263.

[34]
Zhang R, Li Q, Chow T L et al., 2013. Baseflow separation in a small watershed in New Brunswick, Canada, using a recursive digital filter calibrated with the conductivity mass balance method. Hydrological Processes, 27(18): 2659-2665.

DOI

Outlines

/