Quantitative measurement of the effects of administrative division adjustments on regional development

  • WANG Kaiyong , 1 ,
  • FENG Rundong , 1, 2, *
Expand
  • 1. Institute of Geographic Sciences and Natural Resources Research, Key Laboratory of Regional Sustainable Development Modeling, CAS, Beijing 100101, China
  • 2. College of Resources and Environment, University of Chinese Academy of Sciences, Beijing 100049, China
* Feng Rundong (1995-), PhD Candidate, specialized in urban geography and administrative division. E-mail:

Wang Kaiyong (1980-), PhD and Professor, specialized in urban geography and administrative division. E-mail:

Received date: 2021-02-28

  Accepted date: 2021-09-10

  Online published: 2022-02-25

Supported by

National Natural Science Foundation of China(41871151)

Copyright

Copyright reserved © 2021. Office of Journal of Geographical Sciences All articles published represent the opinions of the authors, and do not reflect the official policy of the Chinese Medical Association or the Editorial Board, unless this is clearly specified.

Abstract

Administrative divisions are the important foundation of national governance and social development, and the adjustment of administrative divisions is a critical way to promote regional coordinated development. Under the background of globalization and regionalization, timely adjustment of administrative divisions is a major step to reconstruct the regional development pattern. In the perspective of regional coordinated development, this paper constructs an Administrative Rank Potential Energy (ARPE) model to explore the mechanisms of administrative division adjustment (ADA) under coordinated regional development based on the theory of regional interaction, spatial field energy model and power exponential function. The results show that: (1) The development potential and influence of an administrative region are closely related to the administrative jurisdiction, administrative resources, and the potential of regional coordinated development. (2) The growth rate of ARPE in the study area from 2010 to 2015 was 20.7% compared to the period 2005 to 2010, and the potential for coordinated development increased to 3.05% from 0.21% before the “cancelling” the prefecture-level city of Chaohu. (3) The measurement results of the usefulness of ADA can not only distinguish the complex impacts brought about by social development, but also accord with real social and economic development conditions. The ARPE focuses on the both regional integrated development and individual development, thereby serving as a reference for explaining and evaluating adjustments to administrative divisions at the macro- and micro-scales.

Cite this article

WANG Kaiyong , FENG Rundong . Quantitative measurement of the effects of administrative division adjustments on regional development[J]. Journal of Geographical Sciences, 2021 , 31(12) : 1775 -1790 . DOI: 10.1007/s11442-021-1922-0

1 Introduction

Administrative divisions are spatial divisions and allocations of land, politics and administrative power implemented by the State according to political structure and administrative management requirements. They are also an effective means and important system for a country to carry out political construction, hierarchical management and resource allocations (CEC, 2009; Wang et al., 2018). As an important part of a country’s superstructure, administrative divisions are the foundation of a powerful country and have a bearing on major strategic issues and core capabilities in the country’s political, economic and social development (Gu et al., 2015). In the context of globalization, there is increasingly fierce competition between countries and regions. China, however, is still in the process of rapid urbanization, and its “administrative-region economy” model, characterized by division into administrative regions, with unsuitable administrative divisions in some regions, has seriously hindered the coordinated and healthy development of some regions and weakened the potential for a rational division of labor and mutual benefits among regions as well as the ability to face the challenges posed by global economic forces together (Liu, 1996). China’s Central Economic Work Conference in 2018 pointed out the need to promote coordinated regional development and pointed to administrative divisions as a “resource” (Wang et al., 2018). Accurately determining and measuring the resource effect of administrative division adjustment (ADA) is of great significance for promoting the optimal allocation and reorganization or integration of regional resource elements, overcoming structural and institutional conflicts between administrative divisions and social development (Shang et al., 2015), overcoming administrative division barriers, and promoting regional integrated development (Wang et al., 2010).
ADA is an important tool for changing the pattern of regional development, and it can have a profound impact on the economic and social development of a region. In addition, ADA also can change the potential of the administrative region involved (Chen et al., 2018; Wang et al., 2018). This study holds that changes in potential as a result of such ADA affect the vitality and competitiveness of a regional economy. In complex interactive and inseparable natural social systems, administrative regions have an important impact on regional development via changes in administrative rank, regional relationships, and jurisdictions. This provides a new perspective for studying the regional spatial effects of ADA.
There is a distinct lack of studies on the regional effects of ADA at home and abroad, but there are abundant highly relevant studies. Because urbanization began earlier in Western countries, there has been more theoretical and practical research on administrative divisions, but it mostly focuses on urban spatial planning and governance in the fields of political geography, regional politics and human geography (Brenner N, 1999), as well as on management models and systems of metropolitan areas (Borja et al., 2000; Feiock, 2008; Lambregts et al., 2008; Kwok et al., 2010). Such studies primarily use administrative division methods to closely integrate regional development with spatial planning and management system reform, which is comprehensive and practical. Domestic research has focused on the impact of ADA on the regional coordinated development and the spatial structure of urban agglomerations at the theoretical level (Chen et al., 2005; Zhang et al., 2009; Xu et al., 2011; Li et al., 2012). Research methods mainly include qualitative methods such as rescaling theory (Zhang et al., 2016), re-domaining theory (Luo et al., 2010), and the experiential summary method (Fan et al., 2011; Ye et al., 2018), as well as quantitative methods such as the field energy model (Zhao et al., 2016), urban power circle (Fan et al., 2009), and multiple perspective evaluation (Yang et al., 2013). Research mainly covers the Yangtze River Delta (Zhang et al., 2009; Luo et al., 2010; Xu et al., 2011), Pearl River Delta (Xie et al., 2007; Zhang et al., 2016; Ye et al., 2018), and other developed regions.
In summary, the regional effects of ADA have become a hot topic of current research. Existing research results tend to focus on the macro level and China’s developed eastern regions, with relatively few studies conducted on central and western regions. In addition, studies mostly focus on the effects and mechanisms of ADA, with a lack of quantitative research on the spatialization of administrative divisions. Based on regional interaction theory, the spatial field energy model and power and exponential functions, this study proposes an impact index framework and Administrative Rank Potential Energy (ARPE) model to explore the functional mechanisms of ADA under coordinated regional development. The division and reorganization of Chaohu prefecture-level city is used as an example of optimization of ADA, and it serves as a reference for explaining and evaluating the regional effects of ADA.

2 Theoretical framework and model explaining the effect of ADA on regional coordinated development

2.1 Analysis of the effect of ADA on regional coordinated development and governance in China

The ADA has many impacts on regional development, mainly reflected in the following aspects: first of all, the main role of administrative divisions was to create a hierarchy of divisional administrative management, which can optimize regional urban systems and improve urban layout for a long time. With the continuous advancement of industrialization and urbanization, the role of administrative divisions in the urban setup is increasingly obvious. The establishment of prefecture-level cities, county-level cities and even organizational towns has played a direct role in optimizing the regional urban system. Secondly, ADA can promote urban integration and reorganization to optimize spatial structures. Administrative divisions determine the size of administrative units, as well as how those units are split or merged. Thirdly, ADA can enhance spatial governance capabilities and efficiency. Administrative divisions have a bearing on a country’s long-term stability and social stability. Establishing cities or administrative regions in border areas not only demonstrates the scope of state sovereignty but also enhances spatial control and orderly development of a region. Fourthly, ADA can accelerate regional development and adjusting spatial development. The levels of administrative divisions can affect regional development decision-making and priorities, as well as the ability of different administrative regions to obtain, and coordinate the allocation of various resources. For example, municipalities directly under the central government in China are more important to the country’s social and economic development, so they can gain more national resources. As a result, setting up municipalities in some regions has helped accelerate the development of those regions. Chongqing is a good example of this (Wang et al., 2020). Fifthly, ADA can promote thriving and balanced regional development. Administrative divisions can utilize the regulatory role of regional development levers, accelerate the development of backward regions, and promote coordinated and balanced regional development. Sixthly, ADA can strengthen the regional division of labor and regional spatial integration. Due to the existence of the “administrative region economy” phenomenon, duplicate projects and fierce competition between administrative regions are widespread, and changes in administrative jurisdiction directly impact regional competition and division of labor. In summary, administrative divisions can promote the optimization and reorganization of regional spaces through mergers and divisions of municipal districts, the establishment of counties and cities, and changes of jurisdictional affiliation, so as to continuously improve a spatial governance system.

2.2 Theoretical framework

As economic globalization and regional integration deepen and the “New Urbanization” plan advances in China, coordinating regional development has become a critical part of modernization. It is also an inevitable requirement for building a moderately prosperous society in all respects, realizing modernization and making China a comfortable place to live (Sun, 2006; Fan et al., 2018). As a core system and means of national management, administrative divisions are the cornerstone of coordinated regional development. Therefore, combining the two for research is an adaptation to the trend of the times and based on China’s national conditions.
The competitiveness and development potential of an administrative region are closely related to its administrative jurisdiction (including the scope of jurisdiction and economic development strength), administrative resources (administrative rank, finances, policies, etc.) and regional coordinated development potential (market unification, institutional compatibility, etc.). ADA (such as abolishing counties and cities) can directly change the administrative jurisdiction capabilities and administrative resources of a region, thereby increasing its development momentum. Regions with enormous development potential rely on their superior natural conditions, location and market advantages to quickly become growth poles of regional development, which in turn promotes ADA. Therefore, this paper proposes a theoretical framework for studying interactions between ADA and regional development (Figure 1).
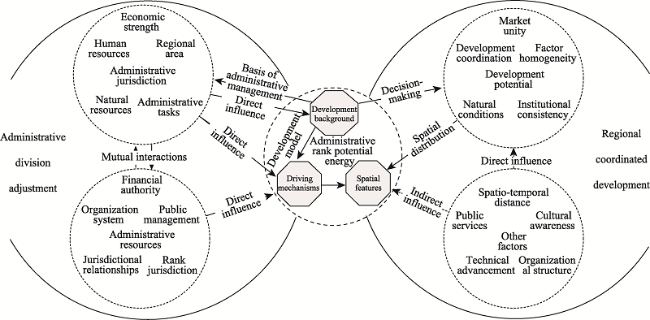
Figure 1 Interpretative framework of the effects of administrative division adjustment on regional development
From the perspective of coordinated regional development, the regional effect of ADA is a process of regional interactions and mutual influence. The regional development changes caused by ADA generally include the following three dimensions.
The first dimension is administrative jurisdiction capacity. This is naturally affected by an administrative region’s natural resources, human resources, economic strength, area of jurisdiction and administrative tasks, which express “horizontal comparison” potential between administrative regions. The natural resources, human resources and land area (especially the area of construction land) under the jurisdiction of a political area determine its overall development and resource allocation capabilities. Economic strength and administrative management capabilities are fundamental guarantees for developing trade and investment and the construction of regions.
The second dimension is the ability to control administrative resources. This is affected by a region’s administrative rank, organizational system, jurisdiction, fiscal authority and public administration, which express the “vertical comparison” potential of that administrative region with other administrative regions in the provincial or national administrative region system. Administrative rank, jurisdiction and fiscal authority are direct manifestations of the administrative, management and fiscal powers of a region, and form the core of its development strength. The organizational system and public management capabilities of a region assure its ability to conduct administrative management and reforms.
The third dimension is the potential for regional coordinated development. This is mainly affected by factors such as market unity, factor homogeneity, development coordination, institutional consistency, natural conditions, national and regional policies and location conditions, which express the potential for interactions between that administrative region and other administrative regions. In the course of regional coordinated and integrated development, regional market unity, factor homogeneity, development coordination and institutional consistency determine the breadth and depth of regional coordinated development. Natural conditions (such as slope) and location conditions are decisive factors in natural endowments, transportation capacity and degree of convenience for external connections of administrative regions. Factors such as national and regional policies and technological progress also directly affect the development potential of administrative regions.

2.3 Model explaining the regional coordinated development potential coefficient and Administrative Rank Potential Energy

Whether the regional coordination potential coefficient is high or low depends on the value of the factors that affect the coordinated development of the region (i.e., potential factors) and the degree of spatial autocorrelation and spatial aggregation. Prior knowledge tells us that a region’s development basically conforms to the sigmoid curve and that coordinated development between regions also “fluctuates forward” under mutual influence and mutual adaptation. As a result, logistic equation analysis indicates that as the value of a region’s potential factor increases it tends to rise sharply at first (rapid development period) and then rise slowly (internal adjustment period). When the spatial autocorrelation of a potential factor is not significant (random distribution), its impact on the coordinated development of the region is basically zero (Df =1). When the spatial autocorrelation of a potential factor is significant, in terms of the positive factor, the higher the spatial aggregation, the greater the impact on the coordinated development of the region (Df≠1), as shown in Figure 2.
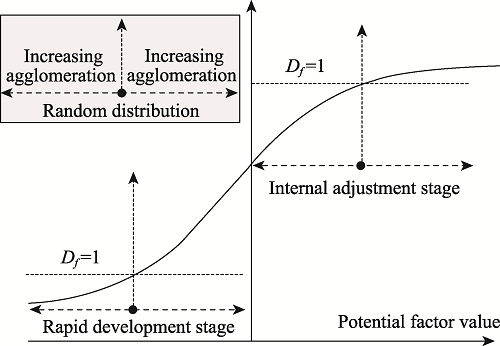
Figure 2 Conceptual diagram of the potential coefficient of regional coordination
As China’s economic and social development is still in the stage of rapid development, this article proposes a calculation method for the regional coordination potential coefficient in the “rapid development period”. In terms of the positive factor, the more concentrated the distribution, the greater the potential for coordinated development and “scale effects”, so its influence on the coordinated development of the region is greater than that of the equivalent factor in a sparsely distributed area; while negative factors have a higher potential for coordinated development in a sparsely distributed area than in a concentrated area, and they can exert a “shared responsibility effect”, whereby the negative effect they bring is “spread out” and shared by all individuals in sparsely distributed areas. The resulting distribution status is shown in Figure 3.
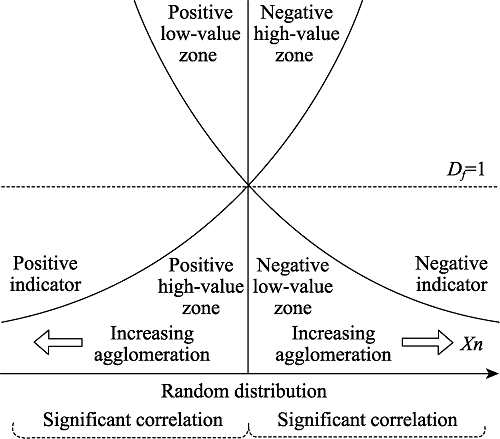
Figure 3 Conceptual diagram of the potential coefficient of regional coordination in the rapid development stage
Based on the spatial autocorrelation and Power Law model, the equation is as follows:
$D_{f}=\sum_{n=1}^{N} \beta_{n} X_{n}^{z(n)} \quad z(n)=\frac{G_{n}(d)-E(d)}{\sqrt{\operatorname{Var}\left(G_{n}\right)}}$
where Xn indicates the value of the potential factor in the region after standardization at the specified interval (here, the positive factor value range is set as (1,2], and the negative factor value range as (0, 1]). βn is the weight of Xn. z(n) is a standardized spatial autocorrelation statistical value of Xn. Its significance level can be determined using a P value test. The degree of aggregation of spatial autocorrelation can be expressed by indicators such as local G statistics. E(d) represents the expectation of Gn(d). Var(Gn) is the variance of Gn(d).
The larger the Df is, the greater the potential for coordinated regional development. When it is greater than 1, it will promote the coordinated development of the region; when it is less than 1, it will inhibit the coordinated development of the region; when it is 1, it has no effect on the coordinated development of the region. The regional coordination potential coefficient focuses on individual development as well as the relationship between the individual and surrounding groups, and it can take into account cooperativity between the individual and the region.
Thus, in the perspective of regional coordinated development, this paper constructs ARPE model based on the theory of regional interaction (Guan et al., 2012) and spatial field energy model (Han et al., 2007), the equation is as follows:
$A R P E=D_{f} \cdot \sum_{k=1}^{R} \lambda_{k} \frac{Z_{k}}{\left(D_{i j}^{k}\right)^{a}}=\sum_{n=1}^{N} \beta_{n} X_{n}^{z(n)} \cdot \sum_{k=1}^{R} \lambda_{k} \frac{Z_{k}}{\left(D_{i j}^{k}\right)^{a}}$
where Zk is the combination of the horizontal and vertical potential of the central district k, which can be calculated using the nodule index; Dijk is the distance between the central district k and the peripheral points, which can be expressed as the cost of regional time accessibility; Df is the coefficient of regional coordination potential; a is the friction coefficient of distance cost, which is usually taken as 1 (Wang et al., 2011); λk is the weight of the central district k on the spatial points, and R is the number of districts.

3 Empirical analysis of the regional effects of administrative division adjustment

3.1 Data sources and processing

3.1.1 Study area
As China’s economy developed rapidly after the implementation of reform and opening-up policy in 1978, Anhui Province, which is located in China’s central region, continued to lag behind coastal areas in terms of the speed and quality of its economic development. As a key region in the central China’s growth strategy, the development of the Wanjiang River Urban Belt had a direct bearing on the radial transfer of industries from developed coastal areas to central and western regions as well as on the level of coordinated development between the eastern, central and western regions.
The relationship between the hinterland central city of Hefei and port city of Wuhu, which are the core of the Wanjiang River Urban Belt, gradually weakened. Because Hefei, as the provincial capital of Anhui, was unable to drive the regional economic development of Anhui, several cities including Wuhu and Chaohu made joining the Yangtze River Delta economic zone the focus of their economic development strategies, which led to competitive and independent development between the two core cities of Hefei and Wuhu. In 2011, the State Council approved the “cancellation” of Chaohu Prefecture-level City in Anhui Province and the establishment of County-level Chaohu City under the jurisdiction of Hefei City. Lujiang County, which was originally under the jurisdiction of Chaohu, was transferred to the jurisdiction of Hefei City; Wuwei County and Shenxiang Town in Hexian County were transferred to the jurisdiction of Wuhu City; and Hanshan County and Hexian County (excluding Shenxiang Town) were transferred to the jurisdiction of Ma’anshan City. After the ADA, the two cities of Hefei and Wuhu were geographically adjacent (Figure 4), giving them more direct economic and geographical connections. This paper uses the Hefei-Wuhu region as an example to measure and analyze the effect of the ADA on regional coordinated development.
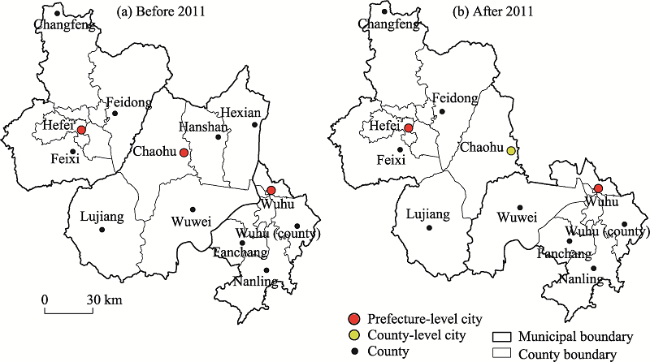
Figure 4 The spatial structures of Hefei and Wuhu before and after administrative division adjustment
3.1.2 Constructing and applying an index system
Based on the theoretical framework of the interaction between ADA and regional coordinated development proposed above, combined with the availability of data, this article selects 15 indicators in the three areas of administrative jurisdiction capacity, administrative resources (Wang et al., 2018) and regional coordinated development potential (Guan et al., 2012) to perform quantitative measurements. The indicator data is calculated for municipal district or county units, though some individual indicators are for whole cities (Table 1). Standardization of deviations is performed for administrative jurisdiction and administrative resource indicators, and standardization of maximum values is performed for factors of regional coordinated development potential. In addition, in order to eliminate the influence of population size and economic scale of districts, some socio-economic indicators in this study use per capita data multiplied by the reduction factor [1-(GDPi/GDPN)] (GDPi is the GDP of district or county i, and GDPN is the total GDP of all counties and districts in the research area) for deflation (Gong et al., 2010). The equation for calculating the industrial structure similarity coefficient is as follows (Liu, 2013):
$S_{i j}=\frac{\sum_{k=1}^{n} x_{i k} x_{j k}}{\sqrt{\sum_{k=1}^{n} x_{i k}^{2} \sum_{k=1}^{n} x_{j k}^{2}}} $
where Sij is the industrial structure similarity coefficient of the regions i and j. xik and xjk are the proportions of total industry in each district and region, respectively. The value of Sij changes between 0 and 1. The larger the value, the greater the degree of convergence of the industrial structure in the district; the lower the value, the lower the degree of convergence.
Table 1 The index system and its application for the effects of administrative division adjustment
Target layer Level-one indicator Level-two indicator Data treatment Indicator type
Comprehensive strength of administrative region Jurisdiction
(horizontal management capacity)
Population Permanent population density Positive
Economic strength Per capita GDP Positive
*Per capita fixed-asset investment ×[1-(GDPi/GDPN)] Positive
Land allocation
capacity
Per capita urban construction land area ×[1-(GDPi/GDPN)] Positive
Administrative resources
(vertical management authority)
Fiscal decentralization Per capita fiscal revenue ×[1-(GDPi/GDPN)] Positive
Per capita fiscal expenditure×[1-(GDPi/GDPN)] Positive
Public
management
Public management and social organization personnel×[1-(GDPi/GDPN)] Positive
Coordinated development potential Potential factor
(regional integration capacity)
Market unity *Foreign direct investment ×[1-(GDPi/GDPN)] Positive
Difference between average worker salary of a county and the median
×[1-(GDPi/GDPN)]
Negative
Factor
homogeneity
Fiscal revenue/GDP×[1-(GDPi/GDPN)] Positive
Per capita disposable income ×[1-(GDPi/GDPN)] Positive
Development synergy Industrial structure similarity coefficient calculated according to proportions of primary, secondary and tertiary industries Negative
GDP growth rate of each district Positive
Natural
conditions
Slope calculated using digital elevation Negative
Net primary productivity Positive
Accessibility Time cost Cost distance Shortest time cost distance Negative

Note: * indicates that there is a lack of statistical data at the municipal district level for that indicator, so city-wide data was used instead

3.1.3 Data sources
Given that 2011 was the demarcation point of a significant ADA in the Hefei-Wuhu region, in order to avoid possible influences of the ADA on statistical data and to ensure the reliability and availability of data, this study uses the years 2005, 2010 and 2015 as the time nodes for research. In addition, to ensure the comparability of data in previous and subsequent periods, the scope of the study in the three periods is based on the 2015 administrative divisions, so Hanshan County and Hexian County (except for Shenxiang Town) are not included. Based on the theoretical framework of the impact index, the data in this study mainly includes two parts.
The first is spatial data, which includes 1:4 million Chinese administrative division data provided by the National Basic Geographic Information Center of China; 1 km resolution digital elevation model data for China and land use remote sensing monitoring data provided by the Resource and Environment Science and Data Center of the Chinese Academy of Sciences; 1 km resolution net primary productivity data for China provided by the Geographical Information Monitoring Cloud Platform; and land transportation data from the 2006 Transport Atlas of the People’s Republic of China published by Planet Press, the China 1:4 million Highway Transport Edition published by the Ministry of Transport in 2009 and the China Transportation Atlas published by China Map Publishing House in 2016. All spatial data is resampled to 500m resolution using ArcGIS. The second is attribute data, which mainly consists of socio-economic data for corresponding years, largely from China’s economic and social development statistical database and statistical yearbooks.

3.2 Quantitatively measuring and analyzing the effects of ADA in the Hefei-Wuhu region

3.2.1 Measuring regional accessibility
Current regional accessibility measurement methods include the shortest path algorithm based on vector data and the cost-weighted distance algorithm based on raster data (Jiang et al., 2010; Yu et al., 2014). To consider the impact of regional natural conditions on transport, this study uses a cost-weighted distance algorithm based on raster data. The calculation steps were as follows: Firstly, a 500 m × 500 m grid was generated from vectorized road data using ArcGIS. Then, the Technical Standards for Highway Engineering of the People’s Republic of China (JTG B01-2003/JTG B01-2014) was used to determine the average speeds of various modes of transport in different years. In 2005, general railways, expressways, national roads, provincial roads and ordinary roads had average speeds of 90 km/h, 120 km/h, 80 km/h, 60 km/h and 40 km/h, respectively. Their corresponding average speeds in 2010 were 100 km/h, 120 km/h, 80 km/h, 60 km/h and 40 km/h, respectively, and the average speed of travelling by high-speed railway was determined to be 250 km/h. In 2015, the average speeds were 160 km/h, 120 km/h, 80 km/h, 60 km/h, and 40 km/h, respectively, and 300 km/h for high-speed rail. In addition, based on slope data generated by terrain data in the digital elevation model, road speed on land with a slope greater than 25° was set as 1 km/h, and slopes less than 25° were set as 5 km/h, and the speed over water bodies was set as 1 km/h. This study then calculated the time cost of reaching any point in a total of 17 administrative regions within the study area (Figure 5).
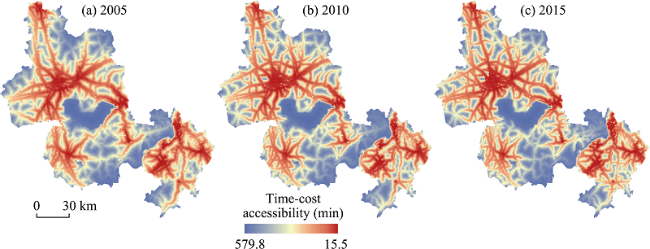
Figure 5 Accessibility of the Hefei-Wuhu region
During the period 2005-2015, the Hefei-Wuhu region’s accessibility increased significantly, and the average time cost from any grid to the nearest administrative region was rapidly reduced from 213 minutes in 2005 to 162 minutes in 2010, and to 142 minutes in 2015, reducing travel time by 51 minutes and 20 minutes, respectively. The areas with the most obvious changes between 2005 and 2010 were those at the intersection of Changfeng County and Feidong County in Hefei City and the eastern parts of Chaohu City, especially the area under the jurisdiction of Hefei City. With the construction of high-speed railways, the accessibility of Hefei and Wuhu city centers also significantly improved.
3.2.2 Measuring the promotional capacity of the administrative region
Based on the index system constructed above, the promotional capacity of a central administrative region is a direct expression of the comprehensive strength of that administrative region. As such, seven indicators (X1-X7) of horizontal management ability and vertical management authority (Table 1) are used to calculate a nodule index to measure the promotional capacity of the administrative region. Taking into account the high correlation between indicators as well as the difficulty of determining the weight of each indicator, the principal component analysis technique is used to calculate the nodule index (Guan et al., 2018). Firstly, the sample data passed the KMO test and the Bartlett sphere test, indicating that it is suitable for principal component analysis. Secondly, three main factors are chosen based on each having characteristic values greater than 1 and cumulative contribution rates greater than 85%. Finally, varimax rotation is used to obtain the load matrix of the principal components of each variable. The nodule index can then be calculated using the following equation:
$Z_{k}=\sum_{i=1}^{3}\left[A_{i} \cdot \sum_{j=1}^{7} C_{i j} \cdot X_{k j}^{*}\right]$
where Zk is the nodule index of the administrative region; Ai is the contribution rate of the first principal component; Cij is the load of the first principle component of the first variable; and Xkj* is the normalized value of the original data.
The Hefei and Wuhu dual-core areas have significant differences in their promotional capacities (Table 2). Between 2005 and 2015, the nodule index of Hefei was higher than that of Wuhu, but the gap between the two cities constantly decreased. After the “cancellation” of Chaohu in 2011, Hefei and Wuhu developed more rapidly than in the period 2005-2010. In particular, the growth rate of Wuhu City reached 138.1%, significantly higher than the regional average growth rate of 82.6%, indicating that the adjustment to Chaohu City had a significant stimulatory effect on the coordinated development and promotional capacity of the dual-core areas of Hefei and Wuhu.
Table 2 Nodule indexes of the Hefei-Wuhu region
Hefei Wuhu Chaohu Hefei-Wuhu region
Highest Lowest Average Growth rate (%) Highest Lowest Average Growth rate (%) Overall Growth rate (%) Average Growth rate (%)
2005 1.23 0.02 4.73 - 0.86 0.01 2.74 - 1.17 - 8.64 -
2010 1.59 0.55 7.94 67.9 1.28 0.31 5.27 92.3 1.41 20.5 14.62 69.2
2015 4.3 0.76 14.14 78.1 3.28 0.55 12.55 138.1 0.76 -46.1 26.69 82.6
3.2.3 Measuring the regional coordination potential coefficient
This study uses eight indicators (X8-X15) from the potential factors (regional impact indicators) in Table 1, and calculates the regional coordination potential coefficient according to equation (1) and uses local G statistics to characterize the relevance and aggregation of potential factors. The equation is as follows:
$G(d)=\frac{\sum \sum w_{i j}(d) x_{i} x_{j}}{\sum \sum x_{i} x_{j}}$
where wij(d) is the binary space system space weight defined according to the distance rule, with the distance threshold set to 1 km. As it is a standardized statistic of the spatial autocorrelation of the potential factors, the P value test of the standardized value is used to determine its significance level. The higher (or lower) the score, the greater the degree of aggregation of the factors. If it is close to zero, it means that there is no obvious spatial aggregation. In order to facilitate the calculation and make data comparable, the positive factor value range specified above is (1, 2] and the negative factor value range is (0, 1], given here as: (1) when P≥ 0.1 (confidence degree<90%); (2) when P<0.1 (confidence degree≥ 90%), the workable value range is [-1, 1].
After calculating the potential factors, the principal component analysis method is used to measure the weight of each variable (Han et al., 2012), and the average weight coefficients of X8-X15 are calculated to be 0.16, 0.14, 0.12, 0.16, 0.09, 0.14, 0.13, 0.06, respectively. An overlap calculation obtains the overall coordinated development potential coefficient for the Hefei-Wuhu region in 2005, 2010 and 2015 (Figure 6).
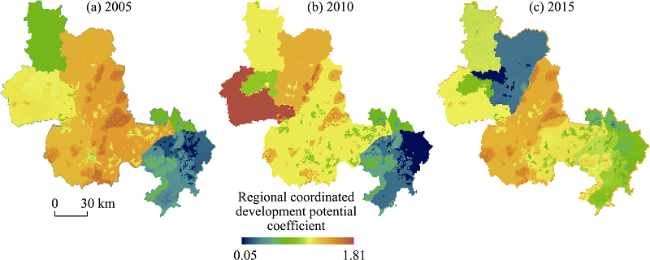
Figure 6 Spatial pattern of coordinated development potential coefficients in the Hefei-Wuhu region
During the period 2005-2015, the average regional coordinated development potential value in the study area increased from 1.085 to 1.121, increasing by 0.003 (0.21%) from 2005 to 2010 and by 0.033 (3.05%) from 2010 to 2015. From 2005 to 2010, the coordinated development potential coefficient of the Hefei-Wuhu region did not change notably. The average coefficient for Hefei City decreased from 1.04 to 0.93. Feixi County decreased the most, falling 0.22. The average of Chaohu City barely changed. Only Wuhu City increased, from 1.27 to 1.3, indicating relatively large potential for coordinated development. It can be seen, then, that the overall capacity for coordinated development in the study area at that stage was weak, and the integration process between the various regions was slow. During the period 2010-2015, the coordinated development potential coefficient of the Hefei-Wuhu region underwent tremendous changes. The overall average for the region increased significantly, and the overall average Df for Hefei City increased to 1.1. Prior to the ADA, the original administrative region reached 1.13, and after Chaohu City was placed under the jurisdiction of Hefei, it increased from 0.96 in 2005 to 1.01. It shows that the ADA promoted the regional integrated development of the provincial capital Hefei; however, the average Df of Wuhu City decreased by 17.7% to 1.07, indicating that Wuhu City’s capacity to coordinate regional development weakened.
3.2.4 Effects of ADA on the regional development pattern
There were significant differences in the spatio-temporal evolution of Administrative Rank Potential Energy pattern before and after the ADA (Figure 7). From 2005 to 2010, the cities in the study area developed relatively independently, and the scope of urban influence was clearly confined to built-up urban areas, with relatively little scope beyond that, and it displayed a scattered pattern. After the ADA, the two cities of Hefei and Wuhu became adjacent, making connections more smoothly, solving issues with the development space of Hefei, and reducing obstacles to integration of areas north and south of the Yangtze River in Hefei and Wuhu, with areas in the mid-section of the Hefei-Wuhu region utilizing their connecting role, which led to rapid development and great progress. After the ADA, the pattern of Administrative Rank Potential Energy in the study area changed significantly from 2010 to 2015, and the influence of Hefei, Chaohu and Wuhu increased significantly. This indicates that the ADA not only promoted the development of Chaohu but was also significant in strengthening connections and coordinated development between Hefei and Wuhu. Nevertheless, development momentum in Feixi and Changfeng counties, which are far from the central administrative region and not on the line between Wuhu and Hefei, was low, and the problem of uncoordinated regional development still existed.
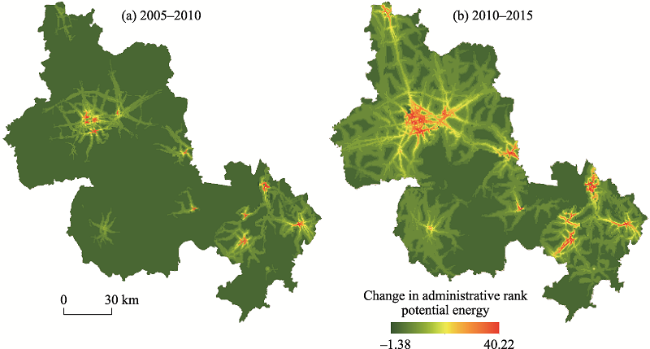
Figure 7 Spatio-temporal evolution of the Administrative Rank Potential Energy in the Hefei-Wuhu region
Considering the difference in change rate of the Administrative Rank Potential Energy in the periods 2005-2010 and 2010-2015, it appears that the ADA had an obvious impact on regional spatial effect (Figure 8). The growth rate of Administrative Rank Potential Energy in the study area from 2010 to 2015 was 20.7% compared to the period 2005 to 2010. More intense regional effects were mainly concentrated along the main traffic arteries and Feixi County, Feidong County, Baohe District, Chaohu City and Sanshan District, as well as areas along the border between Hefei and Wuhu, showing uneven distribution, external dispersion of regional spatial effects and obvious differentiation. The ADA had a direct impact on the administrative region, and the associated and regional effects produced were an important reflection of their effectiveness. The spatial impact at this stage is mainly the expansion of urban built-up areas and transport infrastructure construction, which reflects the increased vitality of urban development and continuous improvements in the intensity of connections between cities after the ADA.
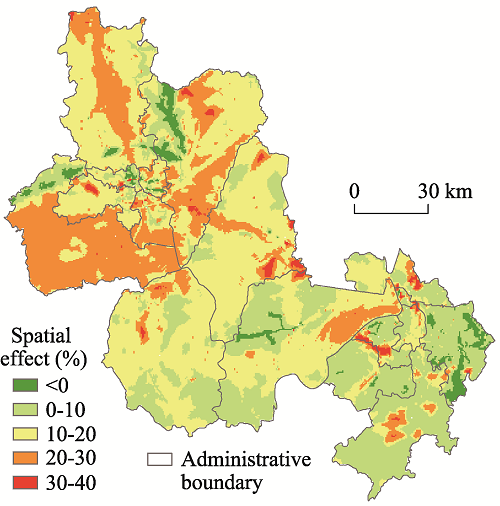
Figure 8 Spatial effects of administrative division adjustment on the regional development pattern
The three-way divisions of Chaohu changed the administrative jurisdictions of Hefei and Wuhu. The ADA expanded the space for urban land and realized a functional reorganization of Hefei that increased its economic and natural resources. After Chaohu became a part of Hefei, the comprehensive management of its watershed was strengthened, thereby further promoting the coordinated and integrated development of the region. Shenxiang Town is the north bridgehead of the Wuhu Yangtze River Bridge, and the ADA helped Wuhu make full use of resources including the golden waterway of the Yangtze River, the Yangtze River Bridge and the Hefei-Chaohu-Wuhu Expressway to develop its inland port industries. In addition, the three-way divisions of Chaohu also directly changed the administrative resources of Hefei and Chaohu. Although Chaohu lost the administrative advantages of being a prefecture-level city after the ADA, Hefei helped it solve problems restricting its economic and social development due to poor management of its water system, especially of Chao Lake, which has significantly increased the development potential of Chaohu. This ADA indirectly changed the regional coordinated development potential of the study area. It helped break down administrative barriers between Hefei and Wuhu, optimized and integrated the allocation of factors of production and resources, and promoted the regional coordinated development of Anhui Province.

4 Conclusion and discussion

This paper constructed a quantitative model based on regional interaction theory, the spatial field energy model and power and exponential functions, and used the Hefei-Wuhu region as an example to measure changes in the development pattern of the study area before and after adjustments to the administrative divisions of Chaohu City in 2011 and the influence and effects of the adjustments. The research indicated the following:
(1) The development potential and influence of an administrative region are closely related to the administrative jurisdiction, administrative ability to allocate resources and coordinated development potential of that district. ADA changed the administrative jurisdiction, administrative resource allocation capabilities and the coordinated development control of administrative regions, in order to improve the development potential of the administrative region. ADA also had a profound impact on regional coordinated and sustainable development.
(2) The ADA played an impotent role in promoting the development of the Hefei-Wuhu region, showing a significant spatial effect. The growth rate of ARPE in the study area from 2010 to 2015 was 20.7% compared to the period 2005 to 2010, and the potential for coordinated development increased to 3.05% from 0.21% before the “cancelling” the prefecture-level city of Chaohu. The ADA significantly improved the development potential of the Hefei-Wuhu region and the level of regional coordinated and sustainable development, which has helped remove spatial and administrative barriers.
(3) The measurement results of the usefulness of the ADA can not only distinguish the complex impacts brought about by social development, but also consistent with real social and economic development conditions. ARPE focus on the development of regional integration and individual development, thereby serving as a reference for explaining and evaluating ADA at the macro- and micro-scales.
As a basic tool of the national governance system, administrative divisions are a huge and complex system. In future research, the index for measuring the regional effect of ADA requires improvement, and further analysis is required to measure the hierarchy of administrative regions. In addition, the effects of ADA on regional economic development need to be in-depth analyzed and summarized.
[1]
Borja J, Castells M, 2000. Local and global: Management of cities in the information age. Berkeley Planning Journal, 65(2): 232-233.

[2]
Brenner N, 1999. Globalisation as reterritorialisation: The re-scaling of urban governance in the European Union. Urban Studies, 36(3): 431-451.

DOI

[3]
Chen Tian, Wang Kaiyong, Chen Yufan, 2018. The influence and qualitative measure methods of administrative division adjustment on administrative region potential: Taking Chongqing city as a case. Scientia Geographica Sinica, 38(5): 654-661. (in Chinese)

DOI

[4]
Chen Zhongxiang, Li Li, 2005. Study on relationship between the changes of city group structure and the district’s administrative adjustment: A case study of the north-central districts in Ningxia. Human Geography, 20(5): 57-61. (in Chinese)

[5]
Chinese Encyclopedia Committee (CEC), 2009. The Volume of Chinese Geography of Encyclopedia of China. 2nd ed. Beijing: Encyclopedia of China Publishing House. (in Chinese)

[6]
Fan Hongyan, Zhang Hongyan, Zhang Zhengxiang et al., 2009. Study on the method of adjustment of town’s administrative zone based on GIS spatial analysis. Geography and Geo-information Science, 25(2): 63-66. (in Chinese)

[7]
Fan Jie, Liang Bo, Guo Rui, 2018. Strategic emphasis of regional coordinated growth pattern optimization in the new era of socialism with Chinese characteristics. Economic Geography, 38(1): 1-10. (in Chinese)

DOI

[8]
Fan Jinzhao, Wang Jianrong, Jiang Luyao, 2011. Study on the phenomenon of reverse adjustment of administrative division during the process of urbanization in contemporary China: A case study of Zhiying town, Yongkang city. Economic Geography, 31(11): 1798-1804. (in Chinese)

[9]
Feiock R C, 2008. Metropolitan governance and institutional collective action. Urban Affairs Review, 44(3): 356-377.

DOI

[10]
Gong Feng, Lei Xin, 2010. The quantitive measurement of Chinese-style fiscal decentralization. Statistical Research, 27(10): 47-55. (in Chinese)

[11]
Gu Chaolin, Wang Ying, Shao Yuan et al., 2015. Research on administrative divisions based on functional areas analysis: A case of Shaoxing metropolitan area. Acta Geographica Sinica, 70(8): 1187-1201. (in Chinese)

DOI

[12]
Guan Xingliang, Fang Chuanglin, Luo Kui, 2012. Regional economic development disparity of China: An application of spatial field. Scientia Geographica Sinica, 32(9): 1055-1065. (in Chinese)

DOI

[13]
Han Xiaohai, Zhang Yaohui, Sun Fujun et al., 2012. Method for determining index weight based on principal component analysis. Journal of Sichuan Ordnance, 33(10): 124-126. (in Chinese)

[14]
Jiang Haibing, Xu Jiangang, Qi Yi, 2010. The influence of Beijing-Shanghai high-speed railways on land accessibility of regional center cities. Acta Geographica Sinica, 65(10): 1287-1298. (in Chinese)

DOI

[15]
König J, Ohr R, 2013. Different efforts in European economic integration: Implications of the EU index. Journal of Common Market Studies, 51(6): 1074-1090.

DOI

[16]
Kwok S M, Tam D M Y, 2010. Rethinking the role of municipal governments on redistribution in Ontario, Canada.[J]ournal of Policy Practice, 9(2): 69-79.

[17]
Han Yuanli, Hu Peng, Huang Xuelian et al., 2007. K-data field approximation method based on k-Voronoi diagram division. Geomatics and Information Science of Wuhan University, 32(4): 353-357. (in Chinese)

[18]
Lambregts B, Janssen-Jansen L, Haran N, 2008. Effective governance for competitive regions in Europe: The difficult case of the Randstad. GeoJournal, 72(1/2): 45-57.

DOI

[19]
Li Shuhong, 2012. Hefei-Wuhu dual core spatial integration based on adjustment division. Geographical Research, 31(10): 1895-1904. (in Chinese)

[20]
Liu Jie, 2013. Industrial structure convergence in western regions of Shandong province. Economic Geography, 33(9): 101-106. (in Chinese)

[21]
Liu Junde, 1996. Theory and Practice of Administrative Divisions in China. Shanghai: East China Normal University Press. (in Chinese)

[22]
Luo Xiaolong, Yin Jie, Tian Dong, 2010. Administrative boundary re-organization in Nanjing metropolitan region. Geographical Research, 29(10): 1746-1756. (in Chinese)

DOI

[23]
Shang Zhenyong, Lu Xiaoxu, Zhang Xiaolin et al., 2015. The impacts of administrative district adjustment on the evolution of urban spatial structure: A case of Huai’an in Jiangsu province. Economic Geography, 35(8): 61-67. (in Chinese)

[24]
Sun Haiyan, 2007. A study on the mechanism construct of regional coordination development. Economic Geography, 27(3): 362-365. (in Chinese)

[25]
Wang Kaiyong, Chen Tian, 2018. Geographical prospects of spatial governance through a review on administrative divisions. Acta Geographica Sinica, 73(4): 688-700. (in Chinese)

DOI

[26]
Wang Kaiyong, Wang Fuyuan, 2020. Theory and measurement model of administrative region potential from a perspective of administrative division adjustment: Taking Chongqing city as a case study. Journal of Geographical Sciences, 30(8): 1341-1362.

DOI

[27]
Wang Li, Deng Yu, Liu Shenghe et al., 2011. The study of urban spheres of influence based on improved field model and its applications: A case study of central China. Acta Geographica Sinica, 66(2): 189-198. (in Chinese)

[28]
Wang Liang, Liu Weidong, 2010. Progress in the study of border and border effects issues by economic geographers: Western countries’ experience and its implications for China. Progress in Geography, 29(5): 601-608. (in Chinese)

DOI

[29]
Xie Dixiang, 2007. Administrative division adjustment and development of metropolitan area: An example of Guangzhou city. Modern Urban Research, (12): 25-31. (in Chinese)

[30]
Xu Mengjie, Chen Li, Lin Shumin et al., 2011. Administrative regionalization adjustment and spatial fractal dimension variation of urban agglomeration: A case study of the Yangtze Delta. Economic Geography, 31(6): 940-946. (in Chinese)

[31]
Yang Yu, Dong Wen, Liu Yi, 2013. Administrative adjustment of Xinjiang in multiple perspectives. Acta Geographica Sinica, 68(10): 1367-1379. (in Chinese)

[32]
Ye Guanjie, Li Lixun, 2018. Effects of administrative division adjustments and structural reforms on economic development of economically strong counties: A case study on Shunde. Tropical Geography, 38(3): 394-404. (in Chinese)

[33]
Yu Zhaoyuan, Hu Yong, Zhu Xiaolin et al., 2014. A unified geometric algebra algorithm for solving multi-type constrained optimal path. Geography and Geo-information Science, 30(2): 10-15. (in Chinese)

[34]
Zhang Jianzuo, Li Guicai, Wang Chao, 2016. Dynamic mechanism of administrative division adjustment under the context of scale rescaling: The case of Guangdong province. Human Geography, 31(2): 74-82. (in Chinese)

[35]
Zhang Xiaoming, Liu Huiling, 2009. The reform and reconstruction of administrative regionalization in the process of regional economic integration: The Yangtze River Delta Region as an example. Journal of University of Science and Technology Beijing (Social Sciences Edition), 25(2): 36-43. (in Chinese)

[36]
Zhao Biao, Zhuang Rulong, Wang Shichen, 2016. The optimization study of the administrative area of Jiangsu province based on the spatial field energy. Economic Geography, 36(6): 8-17. (in Chinese)

Outlines

/