
Journal of Geographical Sciences >
Unraveling the multi-scalar residential segregation and socio-spatial differentiation in China: A comparative study based on Nanjing and Hangzhou
|
Song Weixuan (1981‒), PhD and Associate Professor, specialized in urban social geography. E-mail: wxsong@niglas.ac.cn |
Received date: 2021-07-05
Accepted date: 2021-08-26
Online published: 2022-02-25
Supported by
National Natural Science Foundation of China(41771184)
National Natural Science Foundation of China(42171234)
Copyright
Residential segregation is a dual process of socio-spatial differentiation in residents and spatio-temporal heterogeneity in dwelling. However, most of the existing studies are established from the single perspective of urban residents based on demographic data, which is difficult to reveal the dynamics and complex spatial reconstruction within and between cities. With the characteristics of both stability and timeliness, the rapidly changing housing market is one of the processes and results of socio-spatial reconfiguration, and it is undoubtedly a better lens to observe residential segregation. This paper adopts methods such as multi-group segregation index, multi-scalar segregation profiles, and decomposition of segregation index, with Nanjing and Hangzhou as case cities, and establishes multi-scalar segregation profiles and comparative models based on three geographical scales of census tract, block and grid, and different residential types. A quantitative study was conducted on the degree and pattern of multi-scalar residential segregation in Nanjing and Hangzhou from 2009 to 2018. The paper found that the spatial segregation index is an improvement of the non-spatial segregation index. There are differences between Nanjing and Hangzhou in the evolution process of residential segregation. Nanjing has a higher degree of spatial differentiation as a whole, among which spatial components have a more significant impact.
SONG Weixuan , HUANG Qinshi , GU Yue , HE Ge . Unraveling the multi-scalar residential segregation and socio-spatial differentiation in China: A comparative study based on Nanjing and Hangzhou[J]. Journal of Geographical Sciences, 2021 , 31(12) : 1757 -1774 . DOI: 10.1007/s11442-021-1921-1
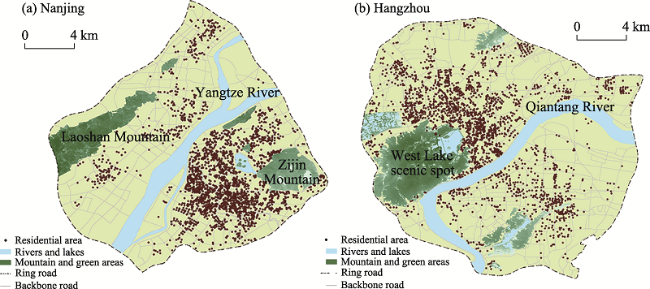
Figure 1 Research area and subjects |
Table 1 Average and median housing prices of Nanjing and Hangzhou from 2009 to 2018 (yuan/m2) |
| Year | 2009 | 2010 | 2011 | 2012 | 2013 | 2014 | 2015 | 2016 | 2017 | 2018 |
|---|---|---|---|---|---|---|---|---|---|---|
| Average housing price of Nanjing | 10733 | 13975 | 15516 | 15516 | 17753 | 19661 | 20159 | 24955 | 30685 | 33982 |
| Average housing price of Hangzhou | 16051 | 21194 | 22613 | 20848 | 21656 | 20372 | 19083 | 20652 | 29714 | 36307 |
| Median housing price of Nanjing | 10656 | 13855 | 15405 | 15372 | 17311 | 19107 | 19756 | 23309 | 29043 | 32000 |
| Median housing price of Hangzhou | 15143 | 20354 | 21971 | 19900 | 20847 | 19516 | 18129 | 19673 | 28750 | 35103 |
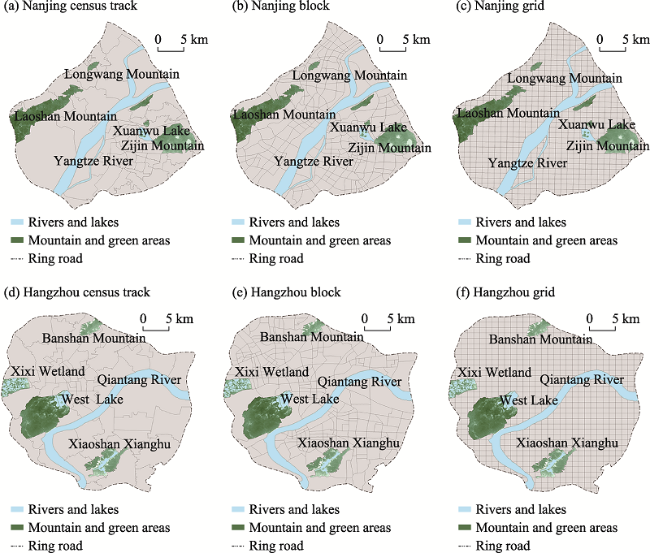
Figure 2 Spatial units between Nanjing and Hangzhou on census tract, block and grid scales |
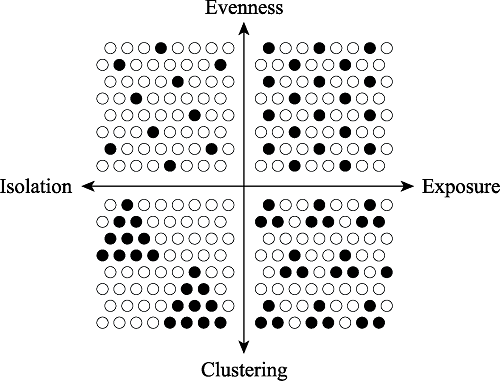
Figure 3 Dimensions of residential differentiation |
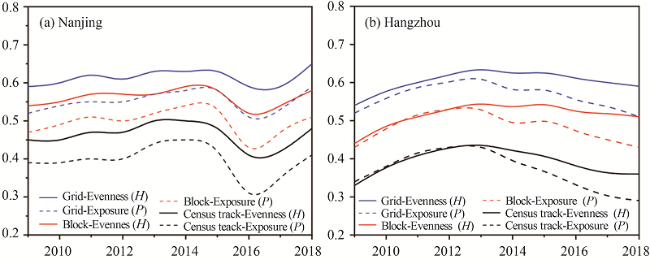
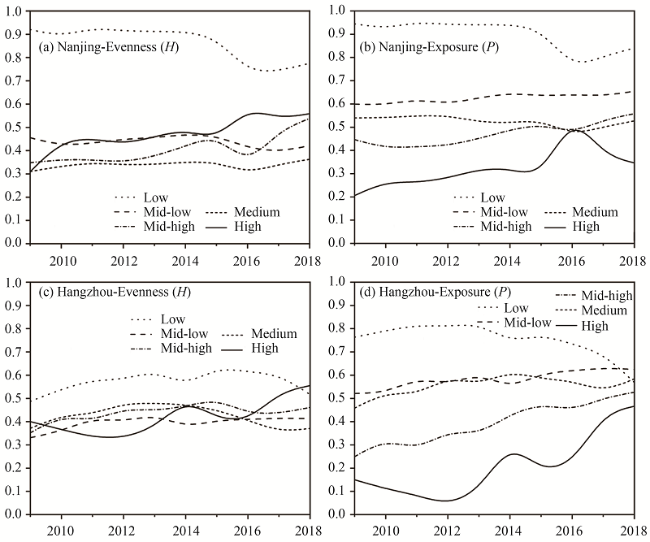
Figure 4 Multi-group evenness (H) and exposure (P) between Nanjing and Hangzhou from 2009 to 2018 |
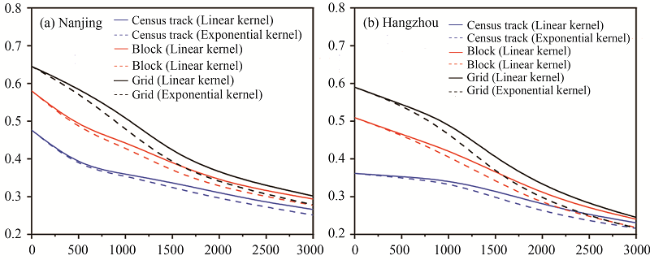
Figure 5 Multi-scalar profiles of residential spatial differentiation between Nanjing and Hangzhou in 2018 |
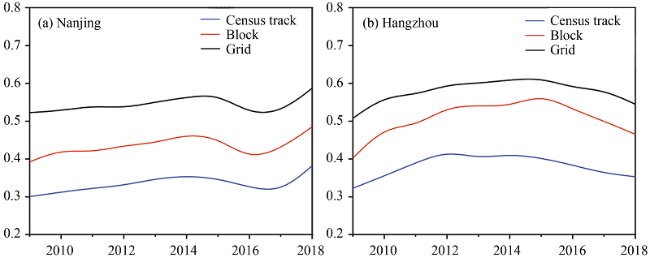
Figure 6 Multi-group spatial information theory index ($\tilde{H}$) based on road networks between Nanjing and Hangzhou from 2009 to 2018 |
Figure 7 Segregation profiles of different housing groups on block scale between Nanjing and Hangzhou from 2009 to 2018 |
Table 2 Percentage of different housing groups between Nanjing and Hangzhou from 2009 to 2018 |
| Proportion (%) | 2009 | 2010 | 2011 | 2012 | 2013 | 2014 | 2015 | 2016 | 2017 | 2018 | |
|---|---|---|---|---|---|---|---|---|---|---|---|
| Nanjing | High-priced housing | 5.10 | 2.98 | 2.59 | 3.90 | 3.79 | 3.11 | 3.14 | 8.72 | 2.79 | 2.43 |
| Medium high-priced housing | 19.09 | 14.87 | 14.75 | 15.69 | 16.21 | 16.83 | 17.11 | 18.17 | 15.45 | 15.16 | |
| Medium-priced housing | 32.14 | 30.73 | 30.20 | 30.91 | 26.86 | 25.20 | 26.96 | 23.89 | 24.44 | 30.23 | |
| Medium low-priced housing | 23.71 | 28.34 | 30.08 | 26.04 | 28.91 | 30.81 | 29.32 | 36.18 | 37.00 | 43.84 | |
| Low-priced housing | 19.95 | 23.08 | 22.39 | 23.45 | 24.23 | 24.05 | 23.47 | 13.04 | 20.31 | 27.62 | |
| Hangzhou | High-priced housing | 1.46 | 0.96 | 0.79 | 0.43 | 0.70 | 2.48 | 1.68 | 2.53 | 5.13 | 4.65 |
| Medium high-priced housing | 9.17 | 8.95 | 7.47 | 7.66 | 7.45 | 10.74 | 10.19 | 12.67 | 16.48 | 16.67 | |
| Medium-priced housing | 28.72 | 31.82 | 27.16 | 31.32 | 25.06 | 32.27 | 27.13 | 28.43 | 26.09 | 31.51 | |
| Medium low-priced housing | 41.54 | 37.22 | 39.13 | 34.82 | 37.53 | 31.67 | 34.44 | 33.03 | 32.92 | 32.78 | |
| Low-priced housing | 19.12 | 21.04 | 25.44 | 25.77 | 29.26 | 22.84 | 26.56 | 23.35 | 19.37 | 14.39 | |
Source: China Real Estate Price Platform. |
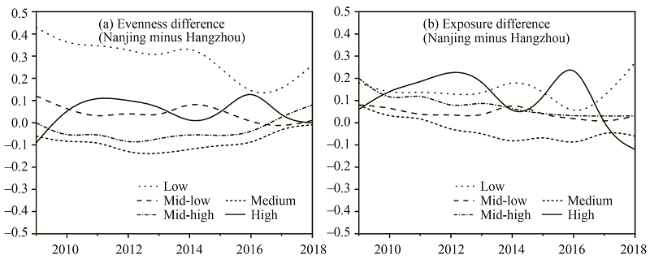
Figure 8 The difference of residential differentiation in different housing groups at block scale between Nanjing and Hangzhou from 2009 to 2018 |
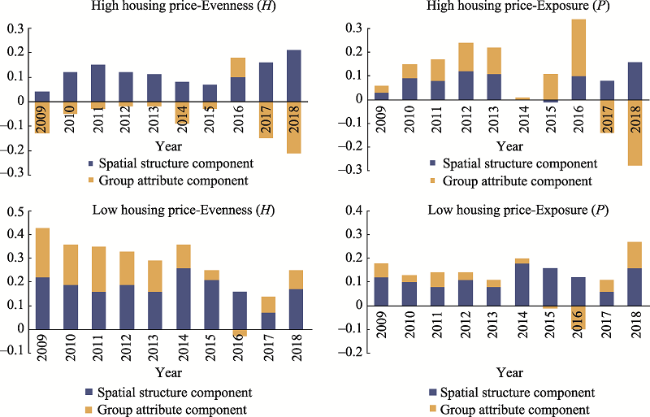
Figure 9 The difference and decomposition of residential differentiation index of high and low housing prices between Nanjing and Hangzhou from 2009 to 2018 |
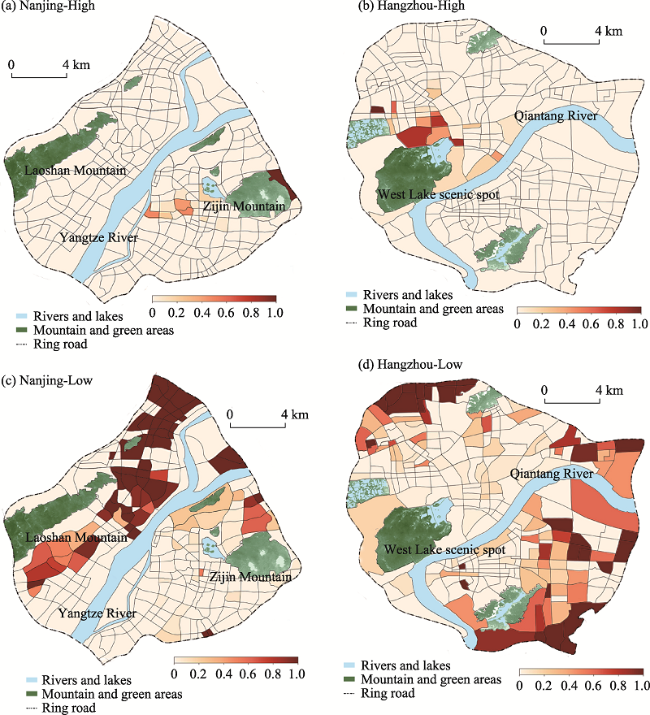
Figure 10 Percentage of high and low housing groups at block scale between Nanjing and Hangzhou in 2018 |
| [1] |
|
| [2] |
|
| [3] |
|
| [4] |
|
| [5] |
|
| [6] |
|
| [7] |
|
| [8] |
|
| [9] |
|
| [10] |
|
| [11] |
|
| [12] |
|
| [13] |
|
| [14] |
|
| [15] |
|
| [16] |
|
| [17] |
|
| [18] |
|
| [19] |
|
| [20] |
|
| [21] |
|
| [22] |
|
| [23] |
|
| [24] |
|
| [25] |
|
| [26] |
|
| [27] |
|
| [28] |
|
| [29] |
Openshaw, 1977. A geographical solution to scale and segregation problems in region: Building, partitioning and spatial modelling. Transactions of the Institute of British Geographers, 4(2): 459-472.
|
| [30] |
|
| [31] |
|
| [32] |
|
| [33] |
|
| [34] |
|
| [35] |
|
| [36] |
|
| [37] |
|
| [38] |
|
| [39] |
|
| [40] |
|
| [41] |
|
| [42] |
|
| [43] |
|
| [44] |
|
| [45] |
|
| [46] |
|
| [47] |
|
| [48] |
|
| [49] |
|
/
| 〈 |
|
〉 |