
Journal of Geographical Sciences >
City size and employment dynamics in China: Evidence from recruitment website data
|
Huang Daquan (1971-), Associate Professor, specialized in spatial planning and urban development. E-mail: huangdaquan@bnu.edu.cn |
Received date: 2020-12-23
Accepted date: 2021-08-10
Online published: 2022-02-25
Supported by
Major Project of National Social Sciences Foundation of China(20&ZD173)
Copyright
This article explored China’s urban employment dynamics with particular focus on the city size effect. Big data derived from the largest recruitment website were used to examine the direct and indirect impacts of city size on employment demand by using mediating and moderating models. We also investigated the roles of the government and location factors which have seldom been considered in literature. Results showed that the concentration degree of new jobs is higher than that of stock employment and population across cities, implying a path dependency mechanism of job creation and employment expansion. Meanwhile, numerous job posts in inland central cities are probably a symptom of more even distribution of employment in future China. Econometric models further verified the significant correlation between city size and job creation. Moreover, industrial diversity, fixed asset investment, and spatial location have heterogeneous effects on employment demand in cities of different sizes and different levels of administration. These results can not only deepen our understanding of the crucial role of city size in urban employment growth but also demonstrate the future trend of labor and population geography of China. Policy implications are then proposed for job creation in cities of China and other developing countries.
HUANG Daquan , HE Han , LIU Tao . City size and employment dynamics in China: Evidence from recruitment website data[J]. Journal of Geographical Sciences, 2021 , 31(12) : 1737 -1756 . DOI: 10.1007/s11442-021-1920-2
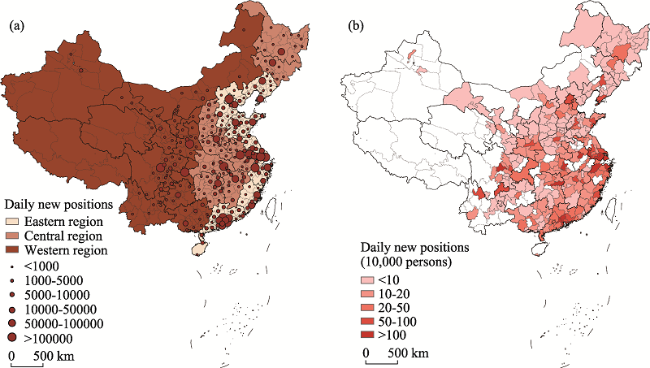
Figure 1 Urban employment and daily job creation in China |
Table 1 Variable definition and data sources |
| Variable | Definition | Data source |
|---|---|---|
| Employment demand | New job positions | www.51job.com |
| City size | City population | China Urban Construction Statistical Yearbook |
| Second-tertiary ratio | Ratio of the secondary to the tertiary industry | China City Statistical Yearbook |
| Industrial diversity | Herfindahl-Hirschman index | China City Statistical Yearbook |
| Provincial capital | Provincial level cities and provincial capitals=1, others=0 | China City Statistical Yearbook |
| Development zone | Area of development zone | Ministry of Natural Resources |
| Investment | Fixed asset investment | China City Statistical Yearbook |
| Location | Distance to central city | China Urban Construction Statistical Yearbook |
Table 2 Descriptive statistics of variables |
| Variable | N | Min | Max | Mean | SD |
|---|---|---|---|---|---|
| Employment demand | 278 | 39 | 342,76 | 9,195.05 | 35,196.70 |
| City size | 278 | 74.54 | 2,479.00 | 204.02 | 259.10 |
| Second-tertiary ratio | 278 | 0.001 | 4.58 | 1.01 | 0.67 |
| Industrial diversity | 278 | 0.030 | 0.850 | 0.172 | 0.091 |
| Provincial capital | 278 | 0 | 1 | 0.31 | 0.05 |
| Development zone | 278 | 0 | 30,763 | 1,411.23 | 2,830.90 |
| Investment | 278 | 25.78 | 1,473.3 | 1,055.17 | 1,620.38 |
| Location | 278 | 12.00 | 1,936 | 227.54 | 192.10 |
Table 3 The regression results of factors affecting urban employment vitality |
| Model 1 Nationwide | Model 1a Eastern region | Model 1b Central region | Model 1c Western region | |
|---|---|---|---|---|
| City size | 1.538***(0.365) | 1.841**(0.657) | 0.915**(0.307) | 0.571**(0.208) |
| Second-tertiary ratio | ‒0.007***(0.002) | 0.364**(0.169) | 0.054**(0.123) | 0.125**(0.041) |
| Industrial diversity | 0.169**(0.026) | 0.195**(0.067) | 0.721**(0.232) | 0.031*(0.017) |
| Provincial capital | 0.107*(0.059) | ‒0.387*(0.211) | ‒0.093*(0.051) | 0.709(1.86) |
| Development zone | 0.03*(0.016) | ‒0.075*(0.044) | 0.029*(0.018) | ‒0.001(0.057) |
| Investment | 0.382*(0.198) | 0.131*(0.051) | 0.024*(0.013) | ‒0.67**(0.231) |
| Location | ‒0.079***(0.015) | ‒0.543***(0.115) | ‒0.428**(0.141) | ‒0.153**(0.054) |
| N | 278 | 97 | 83 | 75 |
| F | 127.394*** | 31.95*** | 27.25*** | 9.929*** |
| Adjustment R2 | 0.757 | 0.693 | 0.703 | 0.455 |
Note: *Significance at a.05 level, **significance at a.01 level, ***significance at a.001 level. Standard error in parentheses. |
Table 4 The regression results of the moderating effect |
| Model 1 | Model 2 | |
|---|---|---|
| City size | 1.538***(0.365) | 1.529***(0.316) |
| Second-tertiary ratio | ‒0.007***(0.002) | ‒0.009**(0.063) |
| Industrial diversity | 0.169**(0.026) | 0.101**(0.945) |
| Provincial capital | 0.107*(0.059) | 0.124*(0.082) |
| Development zone | 0.03*(0.016) | 0.025*(0.013) |
| Investment | 0.382*(0.198) | 0.215**(0.819) |
| Location | ‒0.079***(0.015) | ‒0.152**(0.054) |
| Second-tertiary ratio*City size | 0.021(0.015) | |
| Industrial diversity*City size | 0.075**(0.026) | |
| Provincial capitals*City size | ‒0.727(0.514) | |
| Development zone*City size | 0.335**(0.129) | |
| Investment*City size | 0.112**(0.042) | |
| Location *City size | 0.181*(0.127) | |
| N | 278 | 278 |
| F | 127.394*** | 39.328*** |
| Adjustment R2 | 0.694 | 0.771 |
Note: *Significance at 0.05. **Significance at 0.01. ***Significance at 0.001. Standard error in parentheses. |
Table 5 The regression results of the mediation effect |
| Model 3 Employment | Model 4 City size | Model 1 Employment | Mediating effect | Proportion | |
|---|---|---|---|---|---|
| City size | 1.538***(0.365) | ||||
| Second-tertiary ratio | ‒0.013**(0.005) | ‒0.004*(0.002) | ‒0.007***(0.002) | 0.006 | 46% |
| Industrial diversity | 0.511**(0.182) | 0.223**(0.089) | 0.169**(0.026) | 0.342 | 66% |
| Provincial capital | 0.285(0.209) | 0.116***(0.023) | 0.107*(0.059) | ||
| Development zone | 0.049*(0.031) | 0.013(0.011) | 0.03*(0.016) | ||
| Investment | 0.788**(0.301) | 0.264(0.211) | 0.382*(0.198) | ||
| Location | ‒0.115***(0.025) | ‒0.024**(0.009) | ‒0.079***(0.015) | ‒0.039 | 23% |
| N | 278 | 278 | 278 | ||
| F | 78.312*** | 47.738** | 127.394*** | ||
| Adjustment R2 | 0.641 | 0.442 | 0.757 |
Note: *Significance at.05. **Significance at.01. ***Significance at.001. Standard error in parentheses. |
| [1] |
|
| [2] |
|
| [3] |
|
| [4] |
|
| [5] |
|
| [6] |
|
| [7] |
|
| [8] |
|
| [9] |
|
| [10] |
|
| [11] |
|
| [12] |
|
| [13] |
|
| [14] |
|
| [15] |
|
| [16] |
|
| [17] |
|
| [18] |
|
| [19] |
|
| [20] |
|
| [21] |
|
| [22] |
|
| [23] |
|
| [24] |
|
| [25] |
|
| [26] |
|
| [27] |
|
| [28] |
|
| [29] |
|
| [30] |
|
| [31] |
|
| [32] |
|
| [33] |
|
| [34] |
|
| [35] |
|
| [36] |
|
| [37] |
|
| [38] |
|
| [39] |
|
| [40] |
|
| [41] |
|
| [42] |
|
| [43] |
|
| [44] |
|
| [45] |
|
| [46] |
|
| [47] |
|
| [48] |
|
| [49] |
|
| [50] |
|
| [51] |
|
| [52] |
|
| [53] |
|
| [54] |
|
| [55] |
|
| [56] |
|
| [57] |
|
| [58] |
|
| [59] |
|
| [60] |
|
| [61] |
|
| [62] |
|
| [63] |
|
| [64] |
|
| [65] |
|
| [66] |
|
| [67] |
|
| [68] |
|
| [69] |
|
| [70] |
|
| [71] |
|
| [72] |
|
| [73] |
|
| [74] |
|
| [75] |
|
| [76] |
|
/
| 〈 |
|
〉 |