Special Issue: Fluvial and Geomorphological Features

Adjustment of flood discharge capacity with varying boundary conditions in a braided reach of the Lower Yellow River

  • CHENG Yifei ,
  • XIA Junqiang , * ,
  • ZHOU Meirong ,
  • DENG Shanshan ,
  • LI Zhiwei
Expand
  • State Key Laboratory of Water Resources and Hydropower Engineering Science, Wuhan University, Wuhan 430072, China
*Xia Junqiang (1974-), Professor; specialized in hydraulics and river dynamics. E-mail:

Cheng Yifei (1997-), PhD Candidate; specialized in hydraulics and river dynamics. E-mail:

Received date: 2021-03-01

  Accepted date: 2021-08-14

  Online published: 2022-01-25

Supported by

National Natural Science Foundation of China(51725902)

National Natural Science Foundation of China(51579186)

Copyright

© 2021 Science Press Springer-Verlag

Abstract

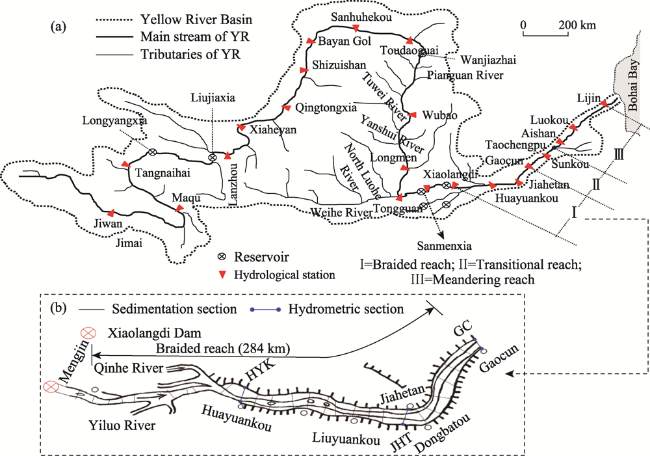
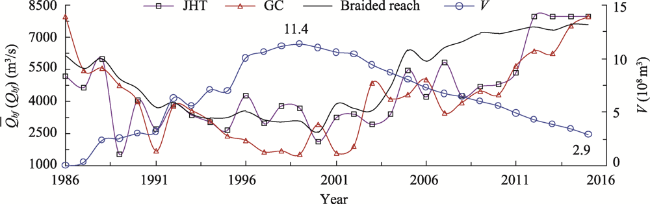
It is of necessity to investigate the adjustment of flood discharge capacity in the Lower Yellow River (LYR) because of its profound importance in sediment transport and flood control decision-making, and additionally its magnitude is influenced by the channel and upstream boundary conditions, which have significantly varied with the ongoing implementation of soil and water conservation measures in the Loess Plateau and the operation of the Xiaolangdi Reservoir. The braided reach between two hydrometric stations of Huayuankou and Gaocun in the LYR was selected as the study area. Different parameters in the study reach during the period 1986-2015 were calculated, covering bankfull discharge (the indicator of flood discharge capacity), the pre-flood geomorphic coefficient (the indicator of channel boundary condition), and the previous five-year average fluvial erosion intensity during flood seasons (the indicator of incoming flow and sediment regime*Functional linkages at scales of section and reach were then developed respectively to quantitatively demonstrate the integrated effects of channel and upstream boundary conditions on the flood discharge capacity. Results show that: (1) the reach-scale bankfull discharge in the pre-dam stage (1986-1999) decreased rapidly by 50%, accompanied with severe channel aggradation and main-channel shrinkage. It recovered gradually as the geometry of main channel became narrower and deeper in the post-dam stage, with the geomorphic coefficient continuously reducing to less than 15 m-1/2*2) The response of bankfull discharge to the channel and upstream boundary conditions varied at scales of section and reach, and consequently the determination coefficients differed for the comprehensive equations, with a smallest value at the Jiahetan station and a highest value (0.91) at reach scale. Generally, the verified results calculated using the comprehensive equations agreed well with the corresponding measured values in 2014-2015*3) The effect of channel boundary condition was more prominent than that of upstream boundary condition on the adjustment of bankfull discharge at the Jiahetan station and the braided reach, which was proved by a larger improvement in determination coefficients for the comprehensive equations and a better performance of geomorphic coefficient on the increase of bankfull discharge.

Cite this article

CHENG Yifei , XIA Junqiang , ZHOU Meirong , DENG Shanshan , LI Zhiwei . Adjustment of flood discharge capacity with varying boundary conditions in a braided reach of the Lower Yellow River[J]. Journal of Geographical Sciences, 2021 , 31(11) : 1615 -1632 . DOI: 10.1007/s11442-021-1914-0

1 Introduction

Flood discharge capacity stands for the capacity of a main channel to convey water, and thus it is generally regarded as the basic capacity of a river. Bankfull discharge, as an essential index of flood discharge capacity (Wu et al., 2008; Hu et al., 2012; Xia et al., 2014a), is the corresponding discharge at bankfull stage (Wolman and Leopold, 1957; William, 1978; Lee and Choi, 2018*It is typically defined as the flow that just fills the main channel to the tops of the floodplain banks in the Lower Yellow River (LYR) (Wu et al., 2008; Xia et al., 2010*Bankfull discharge plays a great role in the contexts of geomorphology and eco-hydraulics. Flow reaching the bankfull stage can normally maintain river morphology and transport most sediment in the river over time (Navratil et al., 2006*In addition, the magnitude and duration of bankfull discharge have important impacts on ecological systems, which will change the habitats of the biota in the interaction zone between channel and floodplain. Therefore, bankfull discharge has been the interest to many researchers including geomorphologists applying it in channel restoration (Doyle et al., 2007) and ecologists focusing on the environment for the organism (Page et al., 2005).
Bankfull discharge is closely related to the definition of bankfull stage. Many methods of the identification of bankfull level can be found in the literature (Riley, 1972; Andrews, 1980; Castro and Jackson, 2001; Xia et al., 2010), including the recognition of geomorphic features and the adoption of geometric criteria, and each method has its corresponding application scope. After the definition of bankfull stage has been decided, the magnitude of bankfull discharge at a section needs to be estimated. One type of the methods, also called as the direct method, is based on the measured stage-discharge curve, and the obtained results are usually regarded as the measurements. However, this method, involving the determination of the bankfull level at a section, is very subjective in practice. Besides, this direct method fails to determine the magnitude of bankfull discharge at ungauged sections. Another frequently used method is about the relationship between bankfull discharge and its influencing factors. Some studies describe the regional relationship which relates bankfull discharge and other channel dimensions to a specified drainage area (McCandless, 2003; Westergard et al., 2005; Mulvihill and Baldigo, 2007*On the basis of observed data, power functions were usually developed in these studies, associated with the corresponding exponents varying a lot with the size of drainage area. Lawlor (2004) used the method of multiple regression analysis and developed a functional linkage between bankfull discharge and channel-morphology characteristics based on the field data of a southwestern Montana River. However, it is unreasonable to treat bankfull discharge as a constant value for the river experiencing contrasting channel evolution due to the altered flow-sediment regime. Therefore, more studies have been devoted to the response of flood discharge capacity to the variation in water discharge and sediment load. Chen et al*2006) analyzed the relationship between the average bankfull discharge at four hydrometric stations and the annual or flood season's incoming water volume in the LYR. Li et al*2010) established a BP modelling of bankfull discharge and found that bankfull discharge shared a close correlation with the peak-flood discharge and the median diameter of suspended load. Wu and Li (2011) developed a delayed response equation to study the influence of flow-sediment regime in previous years and obtained the optimum response time for the braided reach in the LYR. Zhang et al*2019) conducted an indoor microscale physical model experiment to simulate the adjustment of flood conveyance capacity of the LYR in the case of construction of hydropower projects, which significantly changed the flow and sediment conditions.
The Yellow River is characterized by high sediment yield, incompatible relationship between flow and sediment, and high occurrence frequency of disastrous floods (Zhao et al., 2019*Dramatic channel evolution took place in the LYR from 1986 to 2015 because of the aggregate effects of climate change and human activities. Though the operation of the Xiaolangdi (XLD) Reservoir in 1999 has caused the occurrence of channel degradation in the LYR, and later contributes to the recovery of flood discharge capacity, it is still a priority to study the adjustment characteristics of flood discharge capacity in the LYR because of the profound influence of bankfull discharge on flood risk management (Yao et al., 2016*It is worth noting that the analysis of bankfull discharge at scales of section and reach is of equivalent importance for the design of river training works. The former can be instructive to improve the flood discharge capacity of a local subreach, while the latter is notably important to maintain the medium-sized main channel which can safely convey a certain scale of flood (Hu et al., 2012*The great longitudinal variability of bankfull discharge can be found in alluvial channels due to complex fluvial processes, and then the magnitude of bankfull discharge at a specific section would be unrepresentative of a total reach. Therefore, the magnitude of bankfull discharges at scales of section and reach should be estimated. However, the previous methods for the estimation of bankfull discharge show some limitations. The regional relationship between bankfull discharge and drainage area is just applicable to the rivers with similar watershed conditions like geology and vegetation (McCandless, 2003*Hence this kind of relationship is inappropriate to predict the variation of flood conveyance capacity in the LYR because of significant human disturbances. Indeed, it is reasonable to make an approximation of the magnitude of bankfull discharge in the LYR by the incoming flow and sediment conditions rather than regarding it as an equilibrium state. While the calculation of bankfull discharge actually involves two aspects, i.e., the channel boundary condition and the incoming flow-sediment regime, implying that flood discharge capacity is closely related to the channel geometry as well (Wu et al., 2008; Yao et al., 2009; Xia et al., 2014a*In addition, it is also important for river training works to figure out how much the channel boundary condition will perform on the adjustment of flood discharge capacity. Currently, most studies ignore the influence of channel geometry, and thus fail to quantify the relationship between flood discharge capacity and channel boundary condition.
This study is a further investigation into the second method to estimate the magnitude of bankfull discharge. The braided reach between the Huayuankou (HYK) station and the Gaocun (GC) station is selected as the study reach, which are two major hydrometric stations in the LYR. An overall introduction to the study reach is presented firstly, involving the characteristics of flow and sediment transport during the period 1986-2015. The main purposes of the current study are to (1) analyze the adjustment characteristics of the varying channel boundary conditions as well as the bankfull discharges at scales of section and reach; (2) develop respectively new functional linkages between the flood discharge capacity (parameterized by bankfull discharge) and the varying boundary conditions (both the upstream and channel boundary conditions) at scales of section and reach; and (3) examine the performance of channel boundary condition on the adjustment of flood discharge capacity.

2 Study area and methods

2.1 Description of study reach

The Yellow River, originating from the Tibetan Plateau and extending toward the Bohai Sea (Figure 1a), is the second largest river in China in terms of length (5464 km) and the largest river in the world in terms of sediment concentration (Zhang et al., 2021*It just contributes to 2% of the total runoff in China and however 6% of the total sediment load to the oceans around the world (Liu et al., 2012*As a consequence, it is typically characterized by low water discharge and high sediment yield. Different topographical properties lead to various precipitation and temperature characteristics over the entire Yellow River Basin, with an annual precipitation of about 442 mm during 1960-2009. The southwestern part is characterized by the most abundant precipitation and the highest temperature with annual precipitation of 550-1100 mm and an average annual temperature of 10.1℃ during 1960-2010 (Wang et al., 2012; Zhang et al., 2014), which is about four times the precipitation of the northwestern part. The Lower Yellow River, lying in the southwestern part, belongs to the warm temperate and sub-humid climate zone (Zheng et al., 2005*It usually refers to the reach between Mengjin in Henan Province and Lijin in Shandong Province with a length of around 740 km. The bed elevation in the LYR drops significantly by about 94 m, with a mean longitudinal channel slope of 0.12‰ (Li et al., 2018*Before the operation of the XLD Reservoir, the LYR was characterized by severe channel aggradation and frequent occurrence of farm-dike breaches (Bi et al., 2019), and later the situation was improved due to the reservoir operation. According to distinct geomorphological characteristics in the LYR, three different reaches are usually classified, including the braided reach from Mengjin to Gaocun, the transitional reach between Gaocun and Taochengpu, and the meandering reach downstream of Taochengpu (Wu et al., 2005).
Figure 1 Sketch of the Yellow River and the braided reach: (a) the Yellow River; (b) the braided reach
The bed material in the LYR is mainly composed of sand, with the median diameter less than 0.3 mm. Therefore, the channel in the LYR experienced high rates of evolution, especially in the braided reach with a length of 284 km (Figure 1*The main channel in the braided reach is quite wide and shallow, with the value of width-depth ratio usually exceeding 1000 (Wu et al., 2005*There are extensive floodplains on both sides of the LYR, which are utilized by local inhabitants, and the area of floodplains accounts for over 80% of the whole river. The main-channel width varied from 0.9 to 1.4 km, with a mean longitudinal slope of 0.19‰ after the 1999 flood season (Xia et al., 2014b*The transverse channel slope is more than once the value of the longitudinal channel slope (Niu et al., 2013), which thus brings about frequent occurrence of overbank flows and causes a great threat to local habitants. The conflict between the intensity of human activities over the vast floodplains and the frequent farm-dike breaches highlights the urgency of river training works. Moreover, the floodplain bank, characterized by a low content of cohesive sediment, is prone to be eroded, which adds great complexity to river regulation. Thus there is a need to forecast the adjustment in bankfull discharge at a specific section and the whole reach before the regulation of river training. In order to survey the volume of channel evolution, 28 sedimentation sections were set up in the braided reach before 1999. Three hydrometric stations were established to observe hydrological data, covering stations of Huayuankou (HYK), Jiahetan (JHT) and Gaocun (GC) (Figure 1b*Considering the location of hydrometric stations and the availability of long-term hydrological data, this investigation selects the 178-km long braided reach between HYK and GC as the study reach.

2.2 Methods

2.2.1 Bankfull discharge observation

(1) Identification of bankfull level and section-scale bankfull discharge
The low floodplains were extensive on both sides, and the cross-sectional profiles became more complex due to the development of farm dikes in the study reach before 1999 (Figure 2a), which makes the commonly used bankfull indicators (Wolman and Leopold, 1957; Williams, 1978) inappropriate to determine the bankfull stages at these sections. Therefore, a few modification rules proposed by Xia et al*2010) are adopted in this study, which emphasize the performance of farm dikes and the importance of referring to the previous location when the floodplain lips on both sides are not easily recognized. The cross-sectional profile at JHT is selected as an example to display the procedure (Figure 2a*Compared with the previous observations, the points L and R (the square points) are respectively regarded as the lip of the floodplain on the left side (with the bed level of 75.8 m) and the right floodplain lip (74.8 m), among which the lower elevation is taken as the bankfull level. The zone between these two points can be identified as the main-channel zone, and the flow reaching this level is taken as bankfull discharge. After the identification of bankfull level, the bankfull discharge at a section can be calculated according to the simulated stage-discharge relation by a one-dimensional (1D) hydrodynamic model, and the roughness coefficients need to be calibrated using the measured hydrological data. Then the corresponding bankfull discharge can be determined (Qbf =3437 m3/s) according to the simulated stage-discharge curve in Figure 2b. Based on the post-flood surveyed profiles of sedimentation sections in the study reach from 1986 to 2015, the bankfull discharge at each section can be obtained using the same way, together with the hydrological measurements at three hydrometric stations.
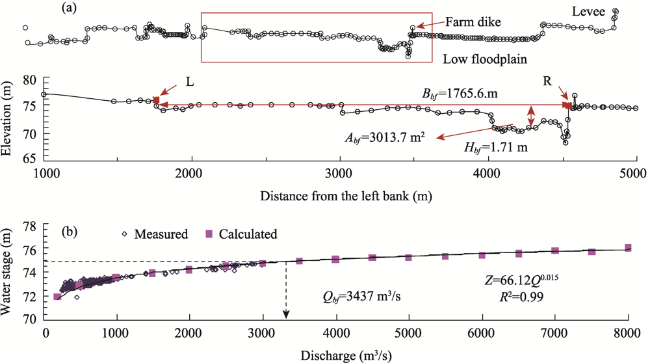
Figure 2 Calculation of bankfull parameters at JHT: (a) determination of bankfull channel parameters; (b) the stage-discharge curve simulated by the 1D hydrodynamic model
(2) Calculation of reach-scale bankfull discharge
Due to a great difference in channel geometry along the braided reach, the bankfull discharge at a specified section may be inefficient to be the representative of the study reach. A method proposed by Xia et al*2014a) is adopted to calculate the reach-scale one. It considers the influence of different bankfull discharges at various sections and the effect of diverse spacing of the successive sections. The equation to calculate the reach-scale bankfull discharge can be written as:
${{\bar{Q}}_{bf}}=\exp \left( \frac{1}{2L}\sum\limits_{i=1}^{M-1}{(\ln Q_{bf}^{i+1}+\ln Q_{bf}^{i})\times \Delta {{x}_{i}}} \right)$
where ${{\bar{Q}}_{bf}}$represents the reach-scale bankfull discharge (m3/s); Δxi is the spacing between the ith and (i+1)th sections (km); M equals the total of sedimentation sections; and L is the length of the study reach (km* ${{\bar{Q}}_{bf}}$calculated by Eq*1) can be regarded as the observed value of the whole reach.

2.2.2 Calculation of channel boundary condition

The channel geometry at a given section is usually characterized by bankfull channel dimensions, e.g., width (Bbf), cross-sectional area (Abf) and depth (Hbf), which is widely used in the contexts of fluvial geomorphology and river management (Harman et al., 2008*Here the simple and widely used form—geomorphic coefficient ($\zeta \text{=}{\sqrt{{{B}_{bf}}}}/{{{H}_{bf}}}\;$) is used as the indicator of channel boundary condition, which also indicates the intrinsic relationship between Bbf and Hbf (Huang and Nanson, 2000; Wu et al., 2005; Wang et al., 2020*The method proposed by Xia et al*2014b) is also adopted to determine bankfull channel dimensions. As shown in Figure 2a, the calculated bankfull channel dimensions at JHT were Bbf =1765.6 m, Abf =2013.7 m2, and Hbf =1.71 m, respectively. Meanwhile, the corresponding geomorphic coefficient was calculated ($\zeta =\sqrt{{{B}_{bf}}}/{{H}_{bf}}$=24.6 m-1/2*Because the pre-flood channel boundary condition controls the conveyance capacity of a river in the flood season, the pre-flood cross section profiles were collected to determine the bankfull channel dimensions. On the basis of the calculated results at each section, the reach-scale bankfull channel dimensions in the pre-flood period can be obtained using the similar method of Eq*1), including ${{\bar{B}}_{bf}}$(reach-scale bankfull width), ${{\bar{H}}_{bf}}$(reach-scale bankfull depth), ${{\bar{A}}_{bf}}$(reach-scale bankfull area) and $\bar{\zeta }$(reach-scale geomorphic coefficient).

2.2.3 Calculation of upstream boundary condition

The fluxes of flow and sediment at HYK (the inlet section) represent the total of water volume and sediment load entering the study reach, which are mainly controlled by the natural condition and anthropogenic influences from the upper and middle catchments (Peng et al., 2010; Ran et al., 2013*Figure 3 shows the temporal variations in water and sediment discharging into the braided reach during flood seasons and hydrological years. The annual average water volume was 27.9 billion m3/yr in the post-dam stage (1986-1999), which slightly declined to 25.4 billion m3/yr after the reservoir operation (2000-2015*While the incoming sediment amount dramatically decreased by almost 90% after the reservoir operation, with the annual average value decreasing from 0.69 billion tonnes/yr during the period 1986-1999 to 0.09 billion tonnes/yr during the period 2000-2015. As shown in Figure 3b,sediment transport during a flood season plays a dominant role, with over 80% of the sediment load in a hydrological year transported during the flood season.
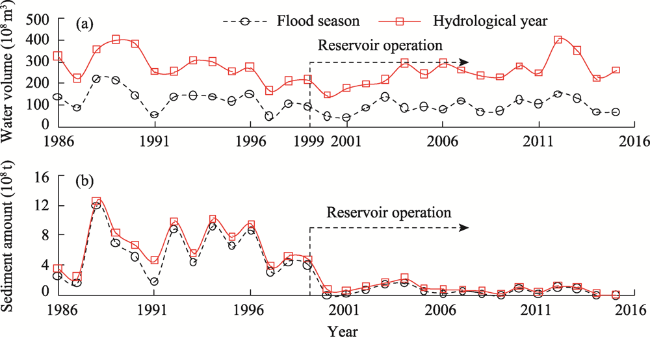
Figure 3 Temporal variations in the flow and sediment regime entering the braided reach during flood seasons and hydrological years: (a) water volume; (b) sediment amount
Given the great variation in sediment load, it is necessary to find a well-defined indicator of flow-sediment conditions. Based on the earlier work, the fluvial erosion intensity F during the flood seasons is an effective parameter (Li et al., 2017), which is expressed by:
${{F}_{i}}=({{\bar{Q}}_{i}}^{2}/{{\bar{S}}_{i}})/{{10}^{4}}$
where ${{\bar{Q}}_{i}}$and ${{\bar{S}}_{i}}$are the mean discharge (m3/s) and sediment concentration (kg/m3) during the ith flood season respectively, and Fi is the corresponding mean fluvial erosion intensity (m9/(kg∙s2)*Fluvial processes in the current year depend on the initial boundary condition, which further is the outcome of previous boundary conditions. Thus it is more reasonable to consider the influence of the upstream boundary condition in the previous years on fluvial processes. As shown in previous studies, the indicator of upstream boundary condition in preceding years can be expressed by the n-year averaged value ${{\bar{F}}_{nf}}=\frac{\text{1}}{n}\sum\limits_{i=1}^{n}{{{F}_{i}}}$ (Wu et al., 2008; Xia et al., 2019).

3 Results and discussion

On the basis of the collected profiles at sedimentation sections and hydrological data in the study reach, the bankfull level at each section was determined, and the corresponding bankfull parameters covering bankfull discharge and channel dimensions were also obtained from 1986 to 2015. Then the reach-scale bankfull parameters were calculated using Eq*1).

3.1 Adjustments in bankfull parameters at scales of section and reach

3.1.1 Adjustment in bankfull discharge

Hydrometric stations of JHT and GC are selected as typical sections for the analysis because of the availability of adequate hydrological data. According to the post-flood bankfull level and the adopted method, the calculated post-flood bankfull discharges at scales of section and reach are shown in Figure 4.
Figure 4 Temporal variations in bankfull discharges at scales of section and reach, and cumulative channel evolution volume (V) in the braided reach
It can be concluded from these results that: (1) the values of Qbf and ${{\bar{Q}}_{bf}}$ varied considerably during the period 1986–2015. The fluctuation of Qbf was different at two stations before 2000, with the maximum decrease of 70.9% and 80.9% at JHT and GC respectively. The variation degree in ${{\bar{Q}}_{bf}}$was relatively slighter, with a maximum decrease of 58.4% during the same period. It indicates that the variation in bankfull discharge at a specific section was contrasting and more sensitive to the altered drivers, and by contrast, the reach-scale bankfull discharge could make a less drastic response to the altered drivers*2) The variation in bankfull discharge was closely related to the process of channel evolution (Figure 4*Continuous channel aggradation occurred in the braided reach from 1986 to 1999, with the cumulative deposition volume of 1.1 billion m3, which resulted in a drastic reduction in bankfull discharge, with the minimum value even less than 2000 m3/s at some sections of the braided reach. After the reservoir became fully operational, dramatic channel degradation took place in the braided reach with the cumulative scour volume of 0.8 billion m3, and consequently bankfull discharges at scales of section and reach increased continuously, which were greater than 7000 m3/s in the recent five years.

3.1.2 Adjustment in channel boundary condition

The calculated pre-flood bankfull channel dimensions are shown in Figure 5. Variations in the pre-flood bankfull channel dimensions were dramatic at different sections, while the variation in reach-scale parameters was moderate. According to the operation of the XLD Reservoir, two stages are divided to analyze the adjustment characteristics of bankfull channel dimensions, covering the aggradation stage from 1986 to 1999 and the degradation stage from 2000 to 2015.
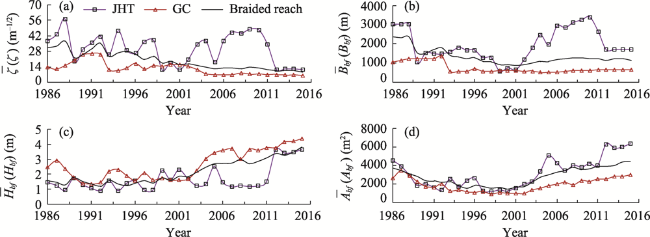
Figure 5 Temporal variations in the pre-flood bankfull channel dimensions: (a) geomorphic coefficient; (b) width; (c) depth; (d) area
In the aggradation stage, geomorphic coefficients generally kept relatively large values which exceeded 20 m-1/2 except GC (Figure 5a), suggesting that the main channel was wide and shallow in most years over this period. In the meantime, it should also be noted that geomorphic coefficients decreased in some years. The variation in geomorphic coefficient was the consequence of the variations in bankfull width and depth. During this period, bankfull widths decreased at different rates due to the unfavorable flow-sediment regime, with a reduction of 80.3% at JHT, 41.3% at GC and 61.3% in the braided reach (Figure 5b), implying that bankfull channel geometry at GC was less influenced because of the conditions of water discharge and sediment load less affected by relatively far human activities in the upstream catchment. Meanwhile, bankfull depths fluctuated (Figure 5c) and the variation was contrary to that in geomorphic coefficients at scales of section and reach, which only slightly increased in the years of 1988 (except GC), 1992, 1996 (except JHT) and 1998, and kept stable around the average value in the rest years. The irregular changes were caused by the exceptional hydrological events in these years, when the main-channel geometry was uniquely shaped with some incision in spite of heavy deposition (Li et al., 2018*Consequently, the bankfull channel areas at the sections and in the braided reach decreased continuously (Figure 5d*In brief, the aggradation stage was characterized by main-channel shrinkage.
In the degradation stage, the bankfull channel dimensions at JHT were characterized by larger fluctuations, deviating from the section of GC and the braided reach. The geomorphic coefficient at JHT increased from 11.1 m-1/2 in 2001 to 47.1 m-1/2 in 2010, and kept abnormally large values during the period 2006-2011 (Figure 5a*Then it became fairly small in the recent four years. These contrasting changes at JHT resulted from the variations in bankfull width and depth at this section. The bankfull width at JHT first increased from 669.3 m in 2001 to 3412.8 m in 2010, and then decreased to 1721.1 m in 2012, and finally kept almost unchanged from 2013 to 2015 (Figure 5b*With regard to the bankfull depth, it first decreased from 2.33 m in 2001 to 1.24 m in 2010, thus leading to a wide and shallow shape with an abnormally large geomorphic coefficient. Then it increased by 142% from 2011 to 2015, shaping a narrow and deep cross-sectional geometry with a fairly small geomorphic coefficient (Figure 5c*In the meantime, the bankfull area varied with the changes of bankfull width and depth, which was comparatively small with the values even less than 1500 m2 from 2000 to 2011 and then became larger from 2012 to 2015 (Figure 5d*The significant changes of bankfull channel dimensions at JHT can be explained by its sensitivity to the changes of flow-sediment regime, the bank soil properties and bank erosion mechanisms (Xia et al., 2019*By contrast, the geomorphic coefficients at GC and in the braided reach continuously decreased during the degradation period with the average values of 8.6 and 12.8 m-1/2 respectively, which were resulted from a significant increase in bankfull depth and a slight change in bankfull width, and consequently the bankfull area increased continuously. Therefore, the degradation stage was generally featured by an incised main channel and a larger wetted area.

3.2 Response of bankfull discharge to channel boundary condition

3.2.1 Response of bankfull discharge at section-scale

In an alluvial river, the adjustment in bankfull channel dimensions exerts a great influence on the variation in bankfull discharge, and the former is the direct results of channel evolution. Generally, a wide and shallow main-channel geometry is shaped by channel deposition, which is in turn associated with a decrease in bankfull discharge. Channel erosion creates a comparatively narrower and deeper main-channel geometry, consequently recovering the magnitude of bankfull discharge. Hence, there is a need to investigate the response of bankfull discharge to channel geometry. The geomorphic coefficient is an important parameter to signify the transverse profile of the main channel and an effective indicator of the channel boundary condition. Therefore, Figures 6a and 6b show the relationships between the post-flood bankfull discharge and the corresponding pre-flood geomorphic coefficient at JHT and GC.
As shown in these figures, the response of bankfull discharge to channel boundary condition is not in accord with the previous qualitative viewpoint that believes there exists a monotonic function in these two variables (Dingman and Afshari, 2018*Variations in bankfull discharge and channel boundary condition were irregular at JHT (Figure 6a*Before the operation of the XLD Reservoir, both the geomorphic coefficient and bankfull discharge fluctuated continuously. The positive correlation presented in Figure 6a was resulted from a considerable reduction in width and a slight change in depth before the reservoir operation (1986-1999), which further led to a decrease in bankfull area and then the bankfull discharge reduced consequently. Although the geomorphic coefficient did not change regularly after the reservoir operation, contrary variations could be found in these two parameters. As the geomorphic coefficient reduced sharply from 48.0 to 11.2 m-1/2, the bankfull discharge recovered rapidly in the post-dam stage. In general, the variations in bankfull discharge and geomorphic coefficient were opposite at GC, implying that a negative correlation existed. Because of extreme shrinkage of the main channel at GC from 1986 to 1991, bankfull discharge decreased significantly in the previous years, which made itself hard to recover in the following several years. It was the reason that the magnitude of bankfull discharge kept a low level from 1993 to 1999, although the geomorphic coefficient became smaller than before (Figure 6b*After the reservoir operation, the geomorphic coefficient at GC decreased continuously and kept stable at the value of 6.7 m-1/2 (2005-2015), associated with the bankfull discharge recovering gradually and further exceeding the value in the year of 1986.
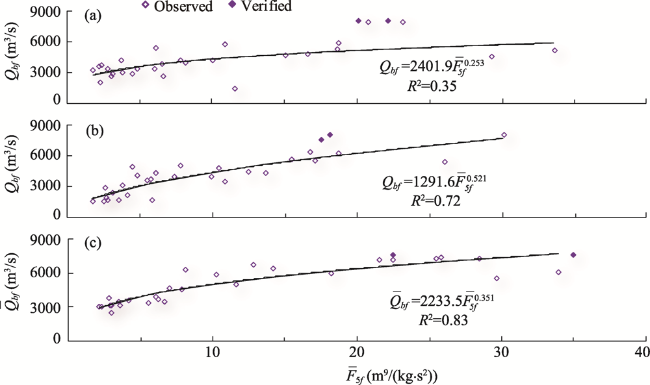
Figure 6 Relationships between bankfull discharge and geomorphic coefficient at different sections of: (a) JHT; (b) GC; and (c) in the braided reach

3.2.2 Response of bankfull discharge at reach-scale

Figure 6c plots the relationship between the post-flood bankfull discharge and the pre-flood geomorphic coefficient of the study reach. As the geomorphic coefficient varied from 35.0 to 17.8 m-1/2 over the period 1986-1999, the bankfull discharge decreased remarkably from 6173 to 3070 m3/s, which was related to the reduced bankfull width and the almost unchanged bankfull depth. While the main channel in the study reach became deeper and narrower after the reservoir operation because of a continual increase in bankfull depth and a slight increase in bankfull width. Consequently, the geomorphic coefficient decreased from 17.8 to 10.8 m-1/2, and in the meantime the bankfull discharge recovered gradually from 3070 m3/s in 1999 to 7589 m3/s in 2015.
It can be concluded that the response law of reach-scale discharge is consistent with the section-scale one, and a negative correlation exists between bankfull discharge and geomorphic coefficient. However, it is far from enough to get a quantitative description about the response by merely taking the channel boundary condition into account. As far as an alluvial river is concerned, channel evolution is deeply influenced by the incoming flow and sediment regime. Hence, the calculation of bankfull discharge should take the influence of flow and sediment into account. Due to the dominant sediment transport during flood seasons, the performance of flow-sediment regime during non-flood seasons is negligible in the analysis below.

3.3 Response of bankfull discharge to upstream boundary condition

3.3.1 Response of bankfull discharge at section-scale

Previous studies have found that these bankfull parameters show a good correlation with the previous 5-year flow and sediment regime in the braided reach (Wu and Li, 2011; Li et al., 2019*Therefore, the fluvial erosion intensities during flood seasons at JHT and GC were calculated by Eq*2) in the case of n = 5 according to the measured hydrological data. The relationship between bankfull discharge and ${{\bar{F}}_{5f}}$is written in the following form:
$ Q_{b f} \text { or } \bar{Q}_{b f}=\alpha \bar{F}_{5 f}^{\beta}$
where α and β are the coefficient and exponent that need to be calibrated.
In the study period from 1986 to 2015, the value of ${{\bar{F}}_{5f}}$at JHT ranged from 1.8 to 33.6 m9/(kg∙s2), which was a little larger than that at GC varying from 1.7 to 30.0 m9/(kg∙s2*The values of Qbf and ${{\bar{F}}_{5f}}$at JHT and GC during the period 1986–2013 were used to calibrate the corresponding parameters in Eq*3), and the values in 2014–2015 were used to verify the accuracy of the equation. Figures 7a and 7b show that there are positive correlations between the bankfull discharge and the average fluvial erosion intensity in the preceding 5-year flood seasons at JHT and GC. The determination coefficients (R2) are 0.35 and 0.72, respectively, which indicates that the response of section-scale bankfull discharge to ${{\bar{F}}_{5f}}$is not very strong. The verification in 2014–2015 deviated a lot from the observation, especially at JHT, suggesting that Eq*3) is inefficient to predict the magnitude of Qbf at a specified section.

3.3.2 Response of reach-scale bankfull discharge

To analyze the variation in reach-scale bankfull discharge, the measured hydrological data at HYK were taken as the upstream boundary condition. Based on the mean sediment concen-tration and discharge during flood seasons over the period from 1986 to 2015, the upstream boundary condition (${{\bar{F}}_{5f}}$) in the study reach was quantified. The values of ${{\bar{Q}}_{bf}}$and ${{\bar{F}}_{5f}}$ from 1986 to 2013 were also used to calibrate the parameters in Eq*3), with the values in 2014–2015 to verify the accuracy of the proposed equation. ${{\bar{Q}}_{bf}}$increased progressively from 3229 to 7321 m3/s as ${{\bar{F}}_{5f}}$increased from 2.1 to 35.0 m9/(kg∙s2) (Figure 7c*The verified results agreed relatively well with the observation, with the calculated bankfull discharges in the years of 2014 and 2015 (6659 and 7780 m3/s) slightly deviating from the corresponding observed values of 7606 and 7589 m3/s. The determination coefficient is larger than 0.80, indicating that the reach-scale bankfull discharge could make a relatively quick response to the 5-year average fluvial erosion intensity during flood seasons.
Figure 7 Responses of bankfull discharge to the preceding five-year average fluvial erosion intensity at different sections of: (a) JHT; (b) GC; and (c) in the braided reach
The analysis about the relationship between bankfull discharge and flow-sediment regime suggests that: (1) the response of bankfull discharge to the flow-sediment regime has shown agreement at scales of section and reach, with positive power functions developed at different scales; (2) section-scale weak correlations were found with lower determination coefficients at JHT and GC; and (3) the determination coefficient was relatively high between reach-scale bankfull discharge and 5-year fluvial erosion intensity during flood seasons, but the accuracy of the proposed relation still needs improvement.

3.4 Estimation of bankfull discharge by channel and upstream boundary conditions

The above investigation indicates that the variation in post-flood bankfull discharge is the direct result of the adjustment of pre-flood channel boundary condition, and also is closely related to the flow-sediment regime especially in the previous years. Herein the combined effects of these two factors are quantitatively analysed at scales of section and reach.

3.4.1 Estimation of section-scale bankfull discharge

Previous studies have established a general power-function equation for the variation in hydraulic geometry (Lawlor, 2004; Theresa and Konstantine, 2014), and herein the effect of a comprehensive factor integrating the pre-flood geomorphic coefficient (ζ) and the 5-year average fluvial erosion intensity during flood seasons ($\bar{F}_{\text{5}f}^{{}}$), is included in an empirical relation, which can be written in this form:
$Q_{b f} \text { or } \bar{Q}_{b f}=k \zeta \bar{F}_{5 f}^{n}$
where k is a coefficient; m and n represent exponents.
On the basis of the calculated results at JHT and GC from 1986 to 2013, the parameters in Eq*4) were calibrated through the method of multiple nonlinear regression analysis. Results are presented in Table 1, which indicate: (1) Qbf presents a negative correlation with the geomorphic coefficient, with the exponent m less than zero, and a positive correlation with fluvial erosion intensity, with the exponent n greater than zero, which agrees with the previous analysis; (2) the irregularity in coefficients and exponents at different sections is correlated with the differences in roughness and the weights of the upstream and channel boundary conditions at each section; and (3) the response of Qbf to the comprehensive factor varies at different sections. The determination coefficient at JHT substantially increases from 0.35 (only considering the influence of fluvial erosion intensity) to 0.55, suggesting that the variation in bankfull discharge is sensitive to the adjustment of channel geometry, while the increase of the determination coefficient is small at GC, indicating that the influence of ${{\bar{F}}_{\text{5}f}}$ is dominant.
Table 1 Calibrated parameters in Eq*4) at sections and in the braided reach
Section/reach k m n R2
JHT 4855.8 -0.231 0.304 0.55
GC 1937.4 -0.097 0.453 0.77
Braided reach 5164.9 -0.248 0.302 0.91

3.4.2 Estimation of reach-scale bankfull discharge

According to the reach-scale bankfull discharges and the calculated results of channel and upstream boundary conditions from 1986 to 2013, the parameters in Eq*4) were calibrated. Results in Table 1 show that the response of reach-scale bankfull discharge to the comprehensive factor agrees with that of section-scale bankfull discharge, but the former's determination coefficient increases by 18% at least compared with the latter; there exists a strong correlation between ${{\bar{Q}}_{bf}}$ and the comprehensive factor, with the determination coefficient (R2) being equal to 0.91, which improves by 10% as compared with that of the relation merely considering the single influence of the upstream boundary condition. Eq*4) quantifies the influence of the comprehensive factor on flood discharge capacity with a higher determination coefficient, and it is more reasonable to explain the adjustment characteristics of bankfull discharge as a consequence.
Figure 8 describes the comparison between the calculated and observed bankfull discharges at scales of section and reach. The corresponding data in 2014–2015 were used to verify the accuracy of Eq*4*The results calculated using Eq*4) can well reproduce the annual variation in bankfull discharge, which decreased markedly before the operation of the XLD Reservoir (1986–1999) and gradually recovered after the operation (2000–2015), suggesting that this simpler and more logical relation could be employed in engineering practice. It should be noted that in Figure 8a, the calculated bankfull discharge in the year of 1989 deviated greatly from the observed one (the triangle one), which was resulted from the abrupt reduction in the fluvial erosion intensity during the 1989 flood season. Actually the delayed response of riverbed requires different weights of the flow and sediment conditions in the preceding years, with those in the last year playing a dominant role. However, the proposed equation for ${{\bar{F}}_{\text{5}f}}$does not differentiate the weight of influence in each year, and assigns the same weight (1/5) to the flow-sediment regime in each year, thus weakening the dominant influence of the current year. There are no obvious differences in those years without extreme flood or dry seasons. However, the bankfull discharge calculated using Eq*4) was greater than the observed one, when the flow-sediment regime at JHT suffered a drastic reduction in the year of 1989. The relative error can be represented by this indicator $\delta \text{=}\left| {{\overline{Q}}_{bf}}-{{\overline{Q}}_{bfc}} \right|/{{\overline{Q}}_{bf}}$, where ${{\overline{Q}}_{bf}}$is the measured value and ${{\overline{Q}}_{bfc}}$ is the calculated value. This indicator is used to examine the performance of the proposed relation for the braided reach. The average of the relative error for the reach-scale bankfull discharge is 8.4%, with over 80% of the study years in the error range of 10%. Moreover, the verification values in the years of 2014 and 2015 are 7291 and 8520 m3/s, with the relative error of 4% and 12% respectively, which suggests that the verification process is relatively reliable. Therefore, Eq*4) can precisely reproduce and predict the variation in reach-scale bankfull discharge. These relations were obtained based on the fundamental principle of fluvial processes, which emphasize the comprehensive influences of various boundary conditions, and therefore these proposed relations would be applicable to other braided rivers. The parameters in these relations need to be re-calibrated before application, owing to the discrepancy in determining bankfull channel dimensions.
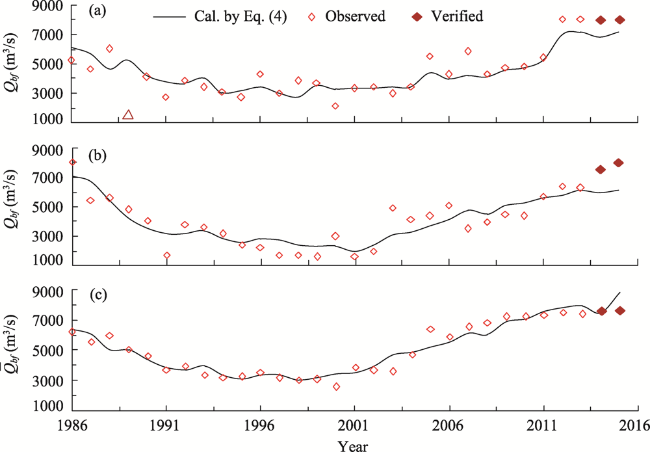
Figure 8 Comparisons between calculated and observed bankfull discharges (a) at JHT; (b) at GC; and (c) in the braided reach
In order to study the better performance of channel or upstream boundary conditions on the improvement of bankfull discharge, the corresponding increase of bankfull discharge is compared as the two factors vary at the same amplitude (e.g., ζ decreases by 10% or ${{\bar{F}}_{5f}}$ increases by 10%*Results show that the improvement of bankfull discharge caused by the decrease of ζ is larger than that caused by the increase of ${{\bar{F}}_{5f}}$ at different scales except GC regardless of the variation amplitude of the two factors, which implies that it can be an effective way to keep a relatively narrower and deeper channel geometry in order to recover the bankfull discharge. The performance of decreasing ζ by 50% is equivalent to that of increasing ${{\bar{F}}_{5f}}$ by 70% at the JHT section and by 75% in the braided reach respectively. Thus it could be helpful to take the pre-flood channel boundary condition into account, before designing the river regulation works for flood control in the braided reach.

4 Conclusions

Bankfull discharge, as the index of flood discharge capacity, is influenced by the combined effects of channel boundary and upstream flow-sediment conditions. On the basis of the measured profiles at sedimentation sections and hydrological data at hydrometric stations in the study reach over the period 1986-2015, the adjustment characteristics of various bankfull parameters are analyzed and moreover the magnitude of bankfull discharge is estimated by the combined effects of two key factors. The following conclusions are drawn from this study.
(1) A dramatic variation in bankfull discharge took place in the braided reach. Before the operation of the XLD Reservoir, the reach-scale bankfull discharge in the braided reach between HYK and GC significantly reduced from 6173 to 3070 m3/s, accompanied with the main-channel shrinkage (bankfull width decreasing by 61.3%); in the post-dam stage, bankfull discharge gradually recovered at scales of section and reach, with the processes of main-channel incision and widening.
(2) Conformity in the response law of bankfull discharge existed at the selected sections and in the braided reach, where bankfull discharge shared a negative correlation with the channel boundary condition and a positive correlation with the upstream boundary condition. Differences in roughness and the weights of these two factors resulted in a great discrepancy between the calibrated parameters in the relations of bankfull discharge. The comprehensive relation generally reproduced the variation in reach-scale bankfull discharge, with the value of determination coefficient equalling 0.91.
(3) The effect of channel boundary condition on the adjustment of bankfull discharge was more prominent than that of upstream boundary condition. Compared with the relations merely considering the influence of upstream boundary condition, the determination coefficients increased by 57%, 7% and 10% at sections of JHT, GC and in the braided reach respectively. The performance of decreasing ζ by 50% was equivalent to that of increasing ${{\bar{F}}_{5f}}$ by 70% at the JHT section and by 75% in the braided reach respectively.
[1]
Andrews E D, 1980. Effective and bankfull discharges of streams in the Yampa River basin, Colorado and Wyoming. Journal of Hydrology, 46(3/4): 311-330.

DOI

[2]
Bi N S, Sun Z Q, Wang H J et al., 2019. Response of channel scouring and deposition to the regulation of large reservoirs: A case study of the lower reaches of the Yellow River (Huanghe). Journal of Hydrology, 568: 972-984.

DOI

[3]
Castro J M, Jackson P L, 2001. Bankfull discharge recurrence intervals and regional hydraulic geometry relationships: Patterns in the Pacific Northwest, USA. Journal of the American Water Resources Association, 37(5): 1249-1262.

DOI

[4]
Chen J G, Hu C H, Dong Z D et al., 2006. Change of bankfull and bed-forming discharges in the Lower Yellow River. Journal of Sediment Research, 5: 10-16. (in Chinese)

[5]
Dingman S L, Afshari S, 2018. Field verification of analytical at-a-station hydraulic-geometry relations. Journal of Hydrology, 564: 859-872.

DOI

[6]
Doyle M W, Shields D, Boyd K F et al., 2007. Channel-forming discharge selection in river restoration design. Journal of Hydraulic Engineering-ASCE, 133(7): 831-837.

DOI

[7]
Harman C, Stewardson M, Derose R, 2008. Variability and uncertainty in reach bankfull hydraulic geometry. Journal of Hydrology, 351(1/2): 13-25.

DOI

[8]
Hu C H, Chen J G, Cuo Q C, 2012. Shaping and maintaining a medium-sized main channel in the Lower Yellow River. International Journal of Sediment Research, 27(3): 259-270.

DOI

[9]
Huang H Q, Nanson G C, 2000. Hydraulic geometry and maximum flow efficiency as products of the principle of least action. Earth Surface Processes and Landforms, 25(1): 1-16.

DOI

[10]
Lawlor S M, 2004. Determination of channel-morphology characteristics, bankfull discharge, and various design-peak discharges in Western Montana. U.S. Geological Survey Scientific Investigation Report 2004-5263, Reston, Virginia.

[11]
Lee W H, Choi H S, 2018. Characteristics of bankfull discharge and its estimation using hydraulic geometry in the Han River basin. KSCE Journal of Civil Engineering, 22(7): 2290-2299.

DOI

[12]
Li J, Xia J Q, Zhou M R et al., 2017. Variation in reach-scale thalweg-migration intensity in a braided reach of the lower Yellow River in 1986-2015. Earth Surface Processes and Landforms, 42(13): 1952-1962.

DOI

[13]
Li J, Xia J Q, Zhou M R et al., 2018. Channel geometry adjustments in response to hyperconcentrated floods in a braided reach of the Lower Yellow River. Progress in Physical Geography, 42(3): 352-368.

[14]
Li W W, Wu B S, Xia J Q et al., 2010. Correlation analysis on affecting factors of bankfull discharge of the Lower Yellow River. Yellow River, 32(6): 10-12. (in Chinese)

[15]
Li X J, Xia J Q, Li J et al., 2019. Adjustments in reach-scale bankfull geometry of a braided reach undergoing contrasting channel evolution processes. Arabian Journal of Geosciences, 12: 535.

DOI

[16]
Liu S M, Li L W, Zhang G L et al., 2012. Impacts of human activities on nutrient transports in the Huanghe (Yellow River) estuary. Journal of Hydrology, 430: 103-110.

[17]
McCandless T L, 2003. Maryland stream survey: Bankfull discharge and channel characteristics of streams in the Allegheny Plateau and the Valley and Ridge hydrologic regions. CBFO-S03-01, U.S. Fish and Wildlife Service.Chesapeake Bay Field Office, Annapolis, Maryland.

[18]
Mulvihill C I, Baldigo B P, 2007. Regionalized equations for bankfull-discharge and channel characteristics of streams in New York State-Hydrologic region 3 east of the Hudson River. U.S. Geological Survey Scientific Investigations Report 2007-5227,Reston,Virginia.

[19]
Navratil Q, Albert M B, Herouin E et al., 2006. Determination of bankfull discharge magnitude and frequency: Comparison of methods on 16 gravel-bed river reaches. Earth Surface Process and Landforms, 31(11): 1345-1363.

DOI

[20]
Niu Y G, Duanmu L M, Zhou N B, 2013. Causes of irregular channel regime and countermeasures in the Lower Yellow River. Yellow River, 35(8): 1-2, 9. (in Chinese)

[21]
Page K, Read A, Frazier P et al., 2005. The effect of altered flow regime on the frequency and duration of bankfull discharge: Murrumbidgee River, Australia. River Research and Applications, 21(5): 567-578.

DOI

[22]
Peng J, Chen S L, Dong P, 2010. Temporal variation of sediment load in the Yellow River basin, China, and its impacts on the lower reaches and the river delta. Catena, 83(2/3): 135-147.

DOI

[23]
Ran L S, Lu X X, Xin Z B et al., 2013. Cumulative sediment trapping by reservoirs in large river basins: A case study of the Yellow River basin. Global and Planetary Change, 100: 308-319.

DOI

[24]
Riley S J, 1972. A comparison of morphometric measures of bankfull. Journal of Hydrology, 17(1/2): 23-31.

DOI

[25]
Theresa M M, Konstantine P G, 2014. Regional bankfull geometry relationships for southern California mountain streams and hydrologic applications. Geomorphology, 221: 242-260.

DOI

[26]
Wang Q X, Fan X H, Qin Z D et al., 2012. Change trends of temperature and precipitation in the Loess Plateau Region of China, 1961-2010. Global and Planetary Change, 92/93: 138-147.

DOI

[27]
Westergard B E, Mulvihill C I, Ernst A G et al., 2005. Regionalized equations for bankfull-discharge and channel characteristics of streams in New York State:hydrologic region 5 in central New York. U.S. Geological Survey Scientific Investigation Report 2004-5247, Reston, Virginia.

[28]
Williams G P, 1978. Bank-full discharge of rivers. Water Resources Research, 14: 1141-1154.

DOI

[29]
Wolman M G, Leopold L B, 1957. River flood plains: Some observations on their formation. U.S. Geological Survey Professional Paper 282-C: 87-109.

[30]
Wu B S, Wang G Q, Ma J M et al., 2005. Case study: river training and its effects on fluvial processes in the Lower Yellow River, China. Journal of Hydraulic Engineering, 131(2): 85-96.

DOI

[31]
Wu B S, Wang G Q, Xia J Q et al., 2008. Response of bankfull discharge to discharge and sediment load in the Lower Yellow River. Geomorphology, 100(3/4): 366-376.

DOI

[32]
Wu B S, Li L Y, 2011. Delayed response model for bankfull discharge predictions in the Yellow River. International Journal of Sediment Research, 26(4): 445-459.

DOI

[33]
Wang Y J, Wu B S, Zhong D Y, 2020. Adjustment in the main-channel geometry of the Lower Yellow River before and after the operation of the Xiaolangdi Reservoir from 1986 to 2015. Journal of Geographical Sciences, 30(3): 468-486.

DOI

[34]
Xia J Q, Wu B S, Wang G Q et al., 2010. Estimation of bankfull discharge in the Lower Yellow River using different approaches. Geomorphology, 117(1/2): 66-77.

DOI

[35]
Xia J Q, Li X J, Zhang X L et al., 2014a. Recent variation in reach-scale bankfull discharge in the Lower Yellow River. Earth Surface Processes and Landforms, 39(6): 723-734.

DOI

[36]
Xia J Q, Li X J, Li T et al., 2014b. Response of reach-scale bankfull channel geometry to the altered flow and sediment regime in the Lower Yellow River. Geomorphology, 213: 255-265.

DOI

[37]
Xia J Q, Li J, Carling P A et al., 2019. Dynamic adjustments in bankfull width of a braided reach. Proceedings of the Institution of Civil Engineers-Water Management, 172(4): 207-216.

DOI

[38]
Yao W Y, Sun Y Q, Li Y, 2009. Influencing factors and judging indexes for the basic flood-conveying and sediment transporting capacity in the Lower Yellow River. Journal of Sediment Research, 1: 1-9.. (in Chinese)

[39]
Yao W Y, Xiao P Q, Shen Z Z et al., 2016. Analysis of the contribution of multiple factors to the recent decrease in discharge and sediment yield in the Yellow River Basin, China. Journal of Geographical Sciences, 26(9): 1289-1304.

DOI

[40]
Zhang J L, Shang Y Z, Liu J Y et al., 2021. Optimisation of reservoir operation mode to improve sediment transport capacity of silt-laden rivers. Journal of Hydrology, 594: 125951.

DOI

[41]
Zhang Q, Peng J T, Singh V P et al., 2014. Spatio-temporal variations of precipitation in arid and semiarid regions of China: The Yellow River basin as a case study. Global and Planetary Change, 114: 38-49.

DOI

[42]
Zhang X, Chen M H, Wu P X et al., 2019. The use of a microscale physical model to simulate bankfull discharge in the lower reaches of the Yellow River. Water, 12(1): 13.

DOI

[43]
Zhao Y, Cao W H, Hu C H et al., 2019. Analysis of changes in characteristics of flood and sediment yield in typical basins of the Yellow River under extreme rainfall events. Catena, 177: 31-40.

DOI

[44]
Zheng J Y, Han Z X, Ge Q S, 2005. Variation of precipitation for the last 300 years over the middle and lower reaches of the Yellow River. Science in China Series D-Earth Sciences, 48(12): 2182-2193.

DOI

Outlines

/