Special Issue: Fluvial and Geomorphological Features

Effect of Three Gorges Dam on Poyang Lake water level at daily scale based on machine learning

  • HUANG Sheng , 1, 2 ,
  • XIA Jun , 1, 2, 3, * ,
  • ZENG Sidong 4 ,
  • WANG Yueling 3 ,
  • SHE Dunxian 1, 2
Expand
  • 1. State Key Laboratory of Water Resources and Hydropower Engineering Science, Wuhan University, Wuhan 430072, China
  • 2. Hubei Key Laboratory of Water System Science for Sponge City Construction, Wuhan University, Wuhan 430072, China
  • 3. Key Laboratory of Water Cycle and Related Land Surface Processes, Institute of Geographic Sciences and Natural Resources Research, CAS, Beijing 100101, China
  • 4. Chongqing Institute of Green and Intelligent Technology, CAS, Chongqing 400714, China
*Xia Jun (1954-), PhD and Professor, specialized in hydrology and water resources. E-mail:

Huang Sheng (1996-), PhD Candidate, specialized in hydrology and water resources. E-mail:

Received date: 2021-02-08

  Accepted date: 2021-09-02

  Online published: 2022-01-25

Supported by

Strategic Priority Research Program of the Chinese Academy of Sciences(XDA23040500)

National Natural Science Foundation of China(41890823)

Copyright

© 2021 Science Press Springer-Verlag

Abstract

Lake water level is an essential indicator of environmental changes caused by natural and human factors. The water level of Poyang Lake, the largest freshwater lake in China, has exhibited a dramatic variation for the past few years, especially after the completion of the Three Gorges Dam (TGD*However, there is a lack of more accurate assessment of the effect of the TGD on the Poyang Lake water level (PLWL) at finer temporal scales (e.g., the daily scale*Here, we used three machine learning models, namely, an Artificial Neural Network (ANN), a Nonlinear Autoregressive model with eXogenous input (NARX), and a Gated Recurrent Unit (GRU), to simulate the daily lake level during 2003-2016. We found that machine learning models with historical memory (i.e., the GRU model) are more suitable for simulating the PLWL under the influence of the TGD. The GRU-based results show that the lake level is significantly affected by the TGD regulation in the different operation stages and in different periods. Although the TGD has had a slight but not very significant impact on the yearly decline of the PLWL, the blocking or releasing of water at the TGD at certain moments has caused large changes in the lake level. This machine-learning-based study sheds light on the interactions between Poyang Lake and the Yangtze River regulated by the TGD.

Cite this article

HUANG Sheng , XIA Jun , ZENG Sidong , WANG Yueling , SHE Dunxian . Effect of Three Gorges Dam on Poyang Lake water level at daily scale based on machine learning[J]. Journal of Geographical Sciences, 2021 , 31(11) : 1598 -1614 . DOI: 10.1007/s11442-021-1913-1

1 Introduction

As a key component of surface water, lakes are well recognized for their valuable functions in regulating river runoff, supporting biodiversity, and promoting regional socio-economic development (Zhang et al., 2014*Water level is a commonly observed variable and is related to the role of lakes in the hydrological cycle (Messager et al., 2016; Theuerkauf et al., 2019*Lake water level variations are very sensitive to environmental changes, including climatic factors and human activities (Yuan et al., 2015; Ma et al., 2020), and monitoring and prediction of water levels based on the potential driving factors can provide important information for local decision-makers in water resource management. In recent years, anthropogenic activities, such as reservoir construction, human water consumption, and sand mining, have had increasingly significant impacts on lake water levels, and their impacts may continue to grow in the future (Wrzesiński and Ptak, 2016; Wang et al., 2017).
Poyang Lake, the largest freshwater lake in China, is connected to the Yangtze River, which is the world's largest hydropower river. This has generated a complicated lake-river regime. The alternate conversion between river and lake facies creates a unique ecological environment and forms a wetland ecosystem with rich species diversity, providing an ideal habitat for migratory birds in the winter (Aharon-Rotman et al., 2017; Li et al., 2019*As the largest habitat for wintering migratory birds in Asia (Sun et al., 2015), the Poyang Lake wetlands are a focus for protection by the World Wildlife Fund. The water level is an important geometric characteristic of lake wetland ecosystems, and its seasonal variation directly affects the date and duration of the wetland's submerged or exposed states and the birds' food resources (Xia et al., 2017*Due to the dual effects of the inflow of the Yangtze River and its five main tributaries in the basin, the Poyang Lake water level (PLWL) has exhibited inherent rhythmic changes between high and low levels for a long time (Chen et al., 2019).
Since the 2000s, the hydrologic rhythm of Poyang Lake has undergone significant modification (Mei et al., 2015; Ye et al., 2018*Many reasons for these changes have been widely explored in the past two decades, such as climate change (Gao et al., 2014; Liu and Wu, 20162014) and sand mining (Lai et al., 2014; Ye et al., 2018*However, it remains controversial whether the Three Gorges Dam (TGD) has caused the decrease in the PLWL, hydrological droughts, and shrinkage of the area of Poyang Lake and how great the effect may be (Zhang et al., 2012; Feng et al., 2014, 2016; Song and Ke, 2014; Wang et al., 2017*Zhang et al*2015) found that the TGD impoundment has changed the seasonal flow patterns of Poyang Lake. Liu et al*2016) revealed that the TGD impoundment has contributed to the shrinkage of Poyang Lake based on a comprehensive analysis. Liu et al*2017) pointed out that the TGD impoundment operations with different design frequencies would cause varying degrees of decline in the lake level. However, these studies mainly focused on the effects of the TGD impoundment on the PLWL, and they did not fully consider other periods (e.g., the period before flooding), and a comprehensive quantitative evaluation of the response of the PLWL to the TGD regulation is still lacking.
At present, there are two methods of quantitatively evaluating the effect of the TGD on the fluctuation of the PLWL. The first method includes the use of hydrodynamic models based on physical processes (Lai et al., 2014; Wang et al., 2019*These models often require many inputs, especially topographical data, which are not so easy to obtain and are often unavailable (Woodget et al., 2015; Le et al., 2019*In addition, the parameters of the hydrodynamic models, such as the Manning roughness coefficient and sediment transport rate, remain poorly ascertainable (Mohammadi and Kashefipour, 2014; Roushangar and Shahnazi, 2020*Data limitations and parameter uncertainties make it difficult to implement hydrodynamic modeling or to achieve a good performance. This opens up opportunities for the application of data-driven approaches such as machine learning models based on the relationships between the inputs and outputs (Liu et al., 2017; Ning et al., 2019*Due to the effective generalization of highly complex nonlinear processes, data-driven models have been continuously developed in recent years and have been widely used in lake water resource management (Zhou et al., 2019; Ye et al., 2020*However, previous data-driven approaches have primarily been applied at monthly or even coarser temporal scales, which has hindered the more accurate (e.g., daily-scale) quantification of the TGD's effects on the downstream lake water levels (Song and Ke, 2014; Liu et al., 2017).
Machine learning has been demonstrated to perform well in exploring the implicit internal relationships in nonlinear systems (Lecun et al., 2015*Studies have shown that machine learning is superior in simulating lake water levels under complex environmental conditions (Liang et al., 2018; Bonakdari et al., 2019; Zhu et al., 2020*In this study, we used machine learning methods to quantify the effect of the TGD on the PLWL on the daily scale. First, three machine learning models, namely, an Artificial Neural Network (ANN), a Nonlinear Autoregressive model with eXogenous input (NARX), and a Gate Recurrent Unit (GRU), were used to simulate the daily-scale water level changes of Poyang Lake over long time periods. Next, the best model was used to predict the lake level differences between the cases with and without the TGD. Then, the effect of the TGD on the PLWL was investigated from different analytical perspectives. The results of this study can facilitate the effective management of the Poyang Lake and the sustainable development of the Yangtze River Economic Belt.

2 Study area and data

2.1 Study area

The Yangtze River is the third longest river in the world, with a total length of 6387 km and a drainage area of approximately 1.8 million km² (Zheng et al., 2020*As the largest lake connected to the Yangtze River, Poyang Lake (115°50°‒116°45°E, 28°23°‒29°45°N) plays an irreplaceable role in regulating the hydrological conditions in the lower reaches of the Yangtze River. Poyang Lake is in the subtropical monsoon climate zone. Its annual mean temperature is about 16-18 ℃, and its annual precipitation is 1400-1700 mm (Dai et al., 2015*Influenced by the climate, the flow direction of the river-lake system changes significantly, resulting in a complex flow rhythm characterized by a noticeable water level variation in Poyang Lake (Lai et al., 2014*In most cases, the water source of Poyang Lake comes from five rivers, i.e., the Raohe, Xinjiang, Xiushui, Fuhe, and Ganjiang rivers, and then, the water flows into the Yangtze River through the single outlet at the Hukou hydrological station after storage in the lake. The streamflows of the five rivers are measured at seven hydrologic stations, namely, the Lijiadu, Hushan, Waizhou, Wanjiabu, Meigang, Dufengkeng, and Qiujin hydrologic stations, which are usually referred to as the five rivers and seven inlets. During the flood season in the upper and middle reaches of the Yangtze River, the lake level may be lower than the water level of the Yangtze River at the corresponding position, and at that time the water from the river will flow back into the lake.
The TGD, near the demarcation point of the upper and middle reaches of the Yangtze River is known for being the world's largest hydroelectric power project. The TGD is 185 m high, with a total reservoir storage capacity of 39 billion m3, i.e., about 4.5% of the yearly mean discharge of the Yangtze River (Xu and Milliman, 2009*It began operation in 2003 and finally reached a normal water level of 175 m after six years. The TGD has had a profound impact on the river-lake relationship, flow regime, channel erosion, water quality, and even human activities in the middle and lower reaches of the Yangtze River (Liu et al., 2016; Xu et al., 2013; Guo et al., 2012*As is shown in Figure 1, Poyang Lake is located approximately 900 km downstream from the TGD along the Yangtze River. In the section between these two locations, the main tributaries in the Dongting Lake Basin and the Han River merge into the Yangtze River. The water exchange between the Dongting Lake Basin and the Yangtze River is measured at the Chenglingji hydrological station, while the discharge of the Han River into the Yangtze River is measured at the Xiantao hydrological station.
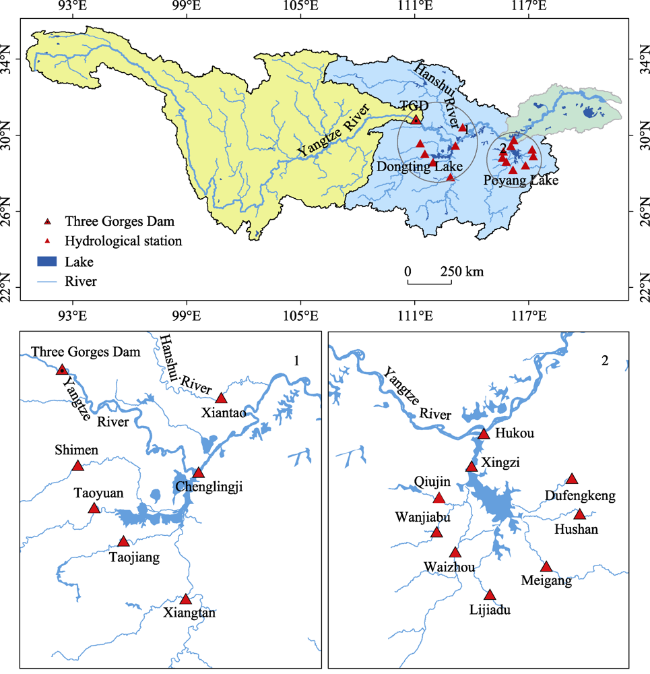
Figure 1 Map showing the study area and associated hydrological stations

2.2 Data

The data used in this study include the observed daily upstream water level of the TGD, the observed daily water level at the Xingzi hydrological station, the observed daily flow at the seven hydrological stations on the five tributaries that feed Poyang Lake, and the observed daily flow at four hydrological stations on the four tributaries of Dongting Lake during 2003-2016, which were collected by the Changjiang Water Resources Commission of the Ministry of Water Resources. The observed daily inflow and outflow of the TGD are available from the official website of the China Three Gorges Corporation (https://www.ctg. com.cn/*The observed daily flows at the Chenglingji and Xiantao hydrological stations are available from the official website of the Hubei Hydrology and Water Resources Center (http://sw.hubeiwater.gov.cn/), which chronicles the daily water level and flow of many measurement stations in the middle reaches of the Yangtze River in detail. Several missing water level and discharge data points were obtained through interpolation of the data for the previous and next dates.

3 Methods

3.1 Problem formulation

Based on the same hydrological series, we quantitatively analyzed the water level variation at the Xingzi station, which is a representative hydrological station in Poyang Lake, between the cases with and without the TGD in order to clarify the effect of the TGD on the PLWL. The PLWL is jointly affected by the five rivers and the water input from the upper-middle Yangtze River, which mainly comes from the operation of the TGD, the Dongting Lake Basin, and the Han River Basin. Therefore, the flow data from the outlet sections of these basins and rivers were used as the model inputs to simulate the PLWL. Prior to this, since the flow exchange between Dongting Lake and the mainstream of the Yangtze River is affected by the TGD, it was first necessary to predict the discharge of Dongting Lake into the Yangtze River based on the discharge of the TGD and the four main tributaries in the Dongting Lake Basin. Figure 2 shows a simplified schematic diagram of our study. The flow from Dongting Lake into the mainstream of the Yangtze River was calculated using submodel 1, and then, the water level at the Xingzi hydrological station on Poyang Lake was predicted based on previous calculations and the other flow data using submodel 2. Both submodels use the same machine learning method.
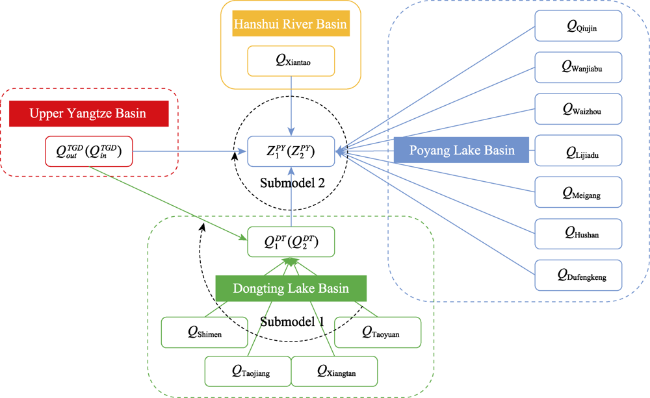
Figure 2 A simplified diagram of the prediction of the PLWL.
The performances of the submodels using the three machine learning methods were compared based on the Nash-Sutcliffe efficiency (NSE) and the mean absolute error (MAE*These evaluation indicators are calculated as follows:
$NSE=1-\left[ \frac{\mathop{\sum }^{}{{\left( y_{i}^{obs}-y_{i}^{pre} \right)}^{2}}}{\mathop{\sum }^{}{{\left( y_{i}^{obs}-y_{mean}^{obs} \right)}^{2}}} \right]$
$MAE=\frac{\mathop{\sum }^{}\left( y_{i}^{obs}-y_{i}^{pre} \right)}{n}$
where $y_{i}^{obs}$ is the observed value, $y_{i}^{pre}$ is the predicted value, $y_{mean}^{obs}$ is the mean observed value, $y_{mean}^{pre}$ is the mean predicted value, and n is the data length. In this study, we divided all of the data into a training dataset (70%) and a testing dataset (30%) for use in the
$Q_{out}^{TGD}$ and $Q_{in}^{TGD}$ are the outflow and inflow of the TGD, respectively. $Q_{1}^{DT}$ and $Q_{2}^{DT}$ are the simulated flow of Dongting Lake into the Yangtze River with and without the Three Gorges Dam, respectively, calculated using submodel 1. $Z_{1}^{PY}$ and $Z_{2}^{PY}$ are the simulated water level of Poyang Lake with and without the TGD, respectively, calculated using submodel 2.
machine learning models. Among the three models, the best-fit model was used to predict the PLWL without the TGD.
In order to quantify the effect of the TGD on the PLWL, we selected the simulated lake level during 2003–2016 from the best-performing model as the reference series, denoted as $Z_{1}^{PY}$. Then, we replaced the input of the TGD outflow ($Q_{out}^{TGD}$) with the TGD inflow ($Q_{in}^{TGD}$) and kept the other inputs the same in order to separate the TGD's effect from that of the complex lake-river system. In this way, we gained a better understanding of how the TGD influences the PLWL without the interference of climatic and other factors. That is, the flow of the upper Yangtze River was restored to the scenario without the TGD. The predicted PLWL was recalculated accordingly, denoted as $Z_{2}^{PY}$. To simplify the formula, we defined the inputs as $Q_{four}^{DT}$ for the daily discharge of the four tributaries into Dongting Lake and the daily discharge of the five rivers and seven inlets into Poyang Lake as $Q_{seven}^{PY}$. The calculation process used in this study is as follows:
$Q_{1}^{DT}={{F}_{1}}\left( Q_{out}^{TGD},Q_{four}^{DT} \right)$
$Z_{1}^{PY}={{F}_{2}}\left( Q_{out}^{TGD},Q_{1}^{DT},{{Q}_{\text{Xiantao}}},Q_{seven}^{PY} \right)$
$Q_{2}^{DT}={{F}_{1}}\left( Q_{in}^{TGD},Q_{four}^{DT} \right)$
$Z_{2}^{PY}={{F}_{2}}\left( Q_{in}^{TGD},Q_{2}^{DT},{{Q}_{\text{Xiantao}}},Q_{seven}^{PY} \right)$
$\Delta {{Z}_{daily}}=Z_{1}^{PY}-Z_{2}^{PY}$
where F1 and F2 are submodel 1 and submodel 2, respectively. $Q_{1}^{DT}$ and $Q_{2}^{DT}$ are the daily flow from the Dongting Lake Basin into the Yangtze River with the TGD and without the TGD, respectively; and ${{Q}_{\text{Xiantao}}}$ is the daily flow of the Han River measured at the Xiantao station. The effect was evaluated based on $\Delta {{Z}_{daily}}$, which represents the effect of the TGD on the PLWL at the daily scale.

3.2 Artificial neural network

The Artificial Neural Network (ANN) is a very classic algorithm in the field of machine learning. ANNs are abstracted from the physiological structure of the human brain. They use discrete layers, connections, and the direction of the data propagation to simulate the signal transmission process between biological neurons. Therefore, ANN models, like the human nervous system, have the characteristics of self-learning, associative storage, and high-speed search for optimal solutions, and they have been used as an efficient method of analyzing the relationship between input data and output data (Hu et al., 2018*As is shown in Figure 3a, a typical ANN model consists of three layers: input, hidden, and output layers. The nodes in each layer represent neurons, and the connections between two nodes represent information transmission. Back propagation is the core algorithm by which ANN models realize their function. Error back propagation involves passing the error from the output to the input layer by layer, that is, allocating the error to all of the nodes of each layer and then adjusting the weight of the connections between the different nodes to obtain the network parameters with the smallest errors. Generally, the architecture of the ANN model can be mathematically expressed as
${{y}_{k}}={{f}_{2}}\left[ \underset{j=1}{\overset{{{n}_{2}}}{\mathop \sum }}\,{{w}_{jk}}{{f}_{1}}\left( \underset{i=1}{\overset{{{n}_{1}}}{\mathop \sum }}\,{{w}_{ij}}{{x}_{i}}+{{b}_{1j}} \right)+{{b}_{2k}} \right]$
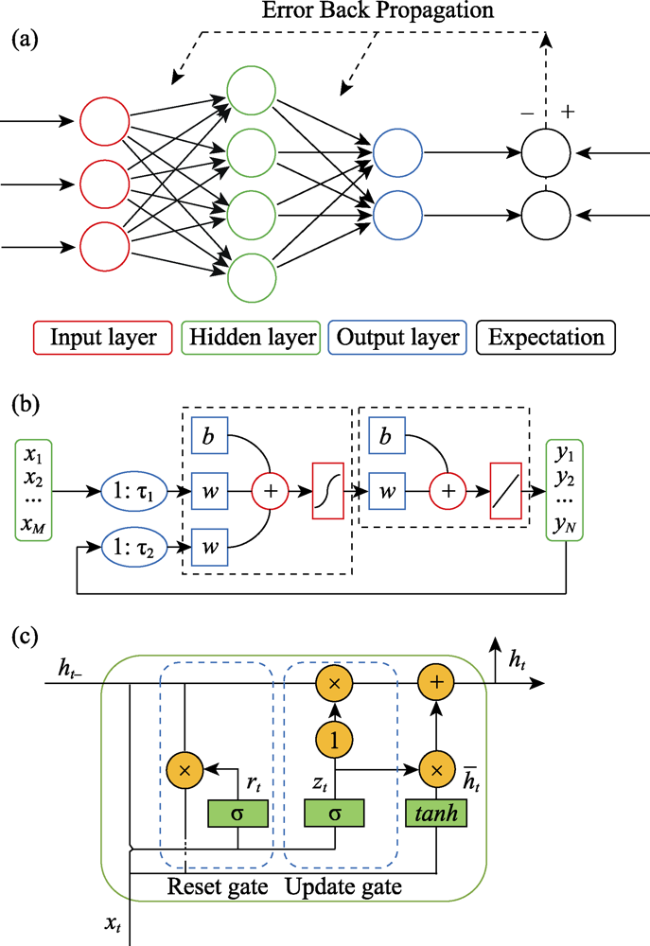
Figure 3 Architectures of the three machine learning models: (a) Artificial Neural Network (ANN), (b) Nonlinear Autoregressive model with eXogenous input (NARX), and (c) Gate Recurrent Unit (GRU)
where xi is an input variable of the model at node i, and yk is an output variable of the model at node k; ${{f}_{1}}(\cdot )$ is the activation function of the hidden layer and ${{f}_{2}}(\cdot )$ is the activation function of the output layer; b1j and b2k represent the biases of the hidden layer and output layer, respectively; wij and wjk are the weights of the connections between the two corresponding layers; n1 and n2 are the total numbers of nodes in the input layer and the hidden layer, respectively.
The Levenberg-Marquardt method was used for the training, and the tansig function was used as the activation function (Yang et al., 2019*We obtained the parameters of the ANN model through trial and error (Ye et al., 2020*Both submodels are three-layer structures, and the numbers of nodes in the hidden layers in submodels 1 and 2 are 8 and 15, respectively.

3.3 Nonlinear Autoregressive model with exogenous input

The Nonlinear Autoregressive model with eXogenous input (NARX) is a dynamic neural architecture commonly used for nonlinear systems (Menezes and Barreto, 2008*As a class of recurrent neural network, NARX does a good job solving time series problems with long-term dependencies (Lin et al., 1996*Without a lack of generality, the NARX network can be expressed as
$y\left( t+1 \right)=f\left[ y\left( t \right),\cdots,y\left( t-{{\tau }_{2}}+1 \right),x\left( t \right),\cdots,x\left( t-{{\tau }_{1}}+1 \right) \right]$
where x(t) and y(t) are the input variable and the output variable of the network at time step t, respectively; ${{\tau }_{1}}\ge 1$ and ${{\tau }_{2}}\ge 1$ are the input-delay and output-delay, respectively; and $f(\cdot )$ is a nonlinear mapping function. The NARX network architecture is shown in Figure 3b, and the model with multiple inputs and outputs can be mathematically represented as
\[{{y}_{o}}\left( t+1 \right)={{f}_{o}}\left\{ \underset{h=1}{\overset{nh}{\mathop \sum }}\,{{w}_{ho}}{{f}_{h}}\left[ \underset{i=1}{\overset{M}{\mathop \sum }}\,\underset{k=0}{\overset{{{\tau }_{1}}}{\mathop \sum }}\,{{w}_{hik}}{{x}_{i}}\left( t-k \right)+\underset{j=1}{\overset{N}{\mathop \sum }}\,\underset{l=0}{\overset{{{\tau }_{2}}}{\mathop \sum }}\,{{w}_{hjl}}{{y}_{j}}\left( t-l \right)+{{b}_{h}} \right]+{{b}_{o}} \right\}\]
where nh, M, and N, are the number of hidden neurons, inputs, and outputs, respectively; who, whik, and whjl are the weights of the connections; and bh and bo are the biases hidden among the different layers. The detail of the NARX network has been described by Menezes and Barreto (2008) and Yang et al*2019).
Both the ANN model and the NARX model were constructed using MATLAB. The NARX network is mainly defined by three parameters: the input-delay τ1, the output-delay τ2, and the number of neurons in the hidden layer nh. The grid search method was implemented in the process of tuning the parameters (Liang et al., 2018*As a result, the hyper-parameters τ1, τ2, and nh were set to 6, 3, and 12 for submodel 1 and 6, 6, and 10 for submodel 2.

3.4 Gate Recurrent Unit

The Gate Recurrent Unit (GRU), a nice variant of the Long Short-Term Memory network (LSTM), is suitable for processing a time series of events with very long delays or intervals. The GRU was proposed in 2014, and it has a hidden unit which includes a reset gate and an update gate (Cho et al., 2014*These two gates can adaptively control the amount of information remembered or forgotten in a sequence. Specifically, the reset gate determines how to add the input into the previous memory, while the update gate controls how much of the previous memory can be saved in the current time step. With the gate mechanism, the GRU can solve the problem of gradient disappearance well and can achieve long-term memory during back propagation. The GRU model's architecture is shown in Figure 3c, and it can be expressed generically as
$\begin{align} & {{h}_{t}}=\left[ 1-\sigma \left( {{W}_{z}}{{x}_{t}}+{{U}_{z}}{{h}_{t-1}}+{{B}_{z}} \right) \right]\otimes {{h}_{t-1}}+\sigma \left( {{W}_{z}}{{x}_{t}}+{{U}_{z}}{{h}_{t-1}}+{{B}_{z}} \right)\otimes \\ & \text{tanh}\left\{ W{{x}_{t}}+U\left[ \sigma \left( {{W}_{r}}{{x}_{t}}+{{U}_{r}}{{h}_{t-1}}+{{B}_{r}} \right)\otimes {{h}_{t-1}} \right]+B \right\}, \\\end{align}$
${{y}_{t}}=~{{W}_{y}}{{h}_{t}}+{{B}_{y}}$
where xt and yt are the input and output of the GRU network at time step t, respectively; and ht is in the hidden state. σ and tanh are the activation functions. Wz, Wr, W, and Wy are the weights of the connections, and Bz, Br, B, and By are the biases; $\otimes $ denotes the Hadamard product, that is, the corresponding elements are multiplied. Equation (11) only shows the hidden state of the GRU model at time step t, which reveals the relationship between ht and ht1. Similarly, ht1 is also related to ht2, and ht2 is related to ht3 … Analogous to a conveyor belt of information, the model's memory of the sequence is formed.
The GRU model was developed using the deep learning framework Pytorch in the spyder module of Anaconda. Adaptive moment estimation (Adam) was chosen as the optimization algorithm for the GRU model. Using the trial and error method, we determined the optimal number of hidden layers and the initial learning rate (1 and 0.003, respectively), which are two sensitive hyper-parameters. Then, we used the grid search method and the rough to fine principle to search for the other best hyper-parameters. Finally, the hyper-parameters of the time step, batch size, and hidden size were set to 25, 30, and 25 for submodel 1 and 90, 60, and 25 for submodel 2.

4 Results and discussion

4.1 Model performance at water level simulation

To eliminate the influence of the initialization parameters, we ran each model 10 times and used the average value. Table 1 shows the performances of the ANN, NARX, and GRU at simulating the flow from Dongting Lake into the Yangtze River and the lake level at the Xingzi station in Poyang Lake. The training and testing results suggest that the NARX and GRU models clearly outperform the ANN model in terms of the streamflow and water level simulations. This is mainly due to the fact that in the daily-scale simulations, it takes some time for the water from the TGD to flow into Dongting Lake or Poyang Lake, and this time is longer than a day. In addition, the delay time has a great impact on these models. The ANN model directly establishes the relationship between the TGD's discharge and the model outputs in the same day, so its simulation results are not very good. However, the inputs of both the NARX and GRU models contain the discharge information of the TGD in past periods, which is called history memory, so the time lag problem can be avoided. Furthermore, the performance of the GRU model is better than that of the NARX model, indicating that the gate mechanism has some advantages in processing memory information. Due to the gate mechanism, the GRU model can deal with longer time series more flexibly and can capture the effective information from the long-term memory to improve the prediction accuracy. In conclusion, regardless of the evaluation indicators, the GRU model performs best among the three models.
Table 1 Performances of the three models at simulating the streamflow and water level
Variables Models Training Testing
NSE MAE NSE MAE
Dongting
( $Q_{1}^{DT}$)
ANN 0.7205 1780.8 0.7154 1914.4
NARX 0.9412 899.8 0.9206 1035.0
GRU 0.9612 750.1 0.9410 942.6
Poyang
( $Z_{1}^{PY}$)
ANN 0.8654 0.9511 0.8251 1.0735
NARX 0.9790 0.3745 0.9604 0.4806
GRU 0.9849 0.3207 0.9746 0.4264

Note: The unit of the MAE of variable $Q_{1}^{DT}$ is m3/s, and that of variable $Z_{1}^{PY}$ is m.

The simulation results of the GRU network for the flow from Dongting Lake and the PLWL are shown in Figure 4. The GRU model successfully captures the trends of the flow and water level with a high simulation accuracy. However, the simulation errors at the crest and trough are slightly larger, especially for the PLWL. For the high water level simulations, the model underestimates the partial high water level, leading to a negative deviation. For the low water level simulations, the model overestimates the partial low water level, leading to a positive deviation. The underestimation of the high water level and the overestimation of the low water level may be caused by the activation function, whose slope goes to 0 when the variable is very large or very small (Yang et al., 2019*In addition, human activities, such as sand mining, urban water demand, and land-use change, also cause errors in the model. In general, the results suggest that the GRU model is an effective prediction model and reveals the relationship between the TGD and the PLWL well.
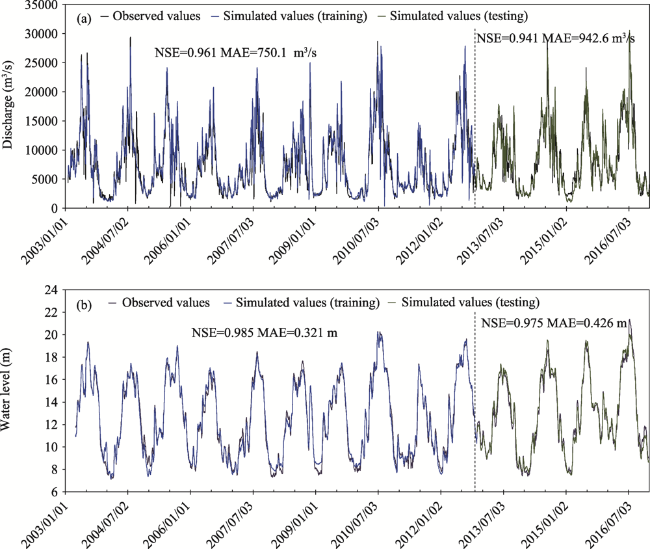
Figure 4 Simulation results for the training and testing periods calculated using the GRU model: (a) The flow from Dongting Lake into the Yangtze River, and (b) the water level of Poyang Lake

4.2 Evaluating the effect of the TGD using the GRU model

The GRU network described above was used to establish the close relationship between the TGD flow and the PLWL. By replacing the outflow sequence of the TGD with the inflow sequence and keeping the other variables the same, we obtained the lake level without the TGD, and we obtained the daily differences between the cases with and without the TGD (Figure 5*The area of the upper half of the horizontal axis (positive) represents the water replenishment effect of the TGD on Poyang Lake, and the area of the lower half (negative) represents the water storage effect of the TGD.
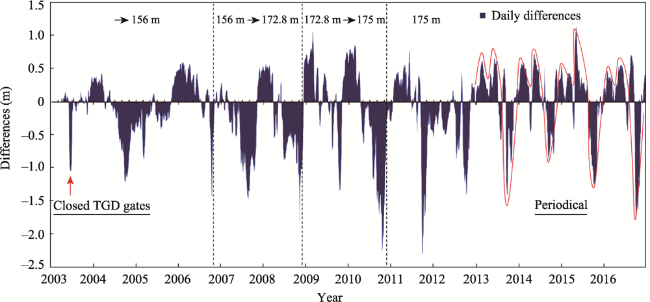
Figure 5 The daily water level differences between the cases with and without the Three Gorges Dam in the different operation stages
The TGD has a significant regulating effect on the PLWL in the different stages (Figure 5*On 1 June 2003, the TGD gates were officially closed to store water, raising the upstream water level to 135 m, so the difference at this time was a negative number with a large absolute value. The negative effect of the TGD on the PLWL lasted for a long period before October 2006, which was when the TGD's impoundment reached 156 m and the TGD entered the initial operation stage and its flood control benefits could be fully utilized. In the following years, the TGD rapidly approached the goal of reaching a 175-m reservoir water level, and the area enclosed by the differences in the lower half of the horizontal axis is significantly larger. In 2009, due to the drought in the middle and lower reaches of the Yangtze River, the TGD increased its outflow and did not reach the water storage goal. In 2010, there was flooding in the Yangtze River Basin, and the PLWL was greatly affected by the flood retention of the TGD. In addition, in 2010, the TGD achieved its goal of reaching the normal storage level of 175 m for the first time. Before it reached a water level of 175 m, the negative effect of the TGD on the PLWL was more significant than the positive effect. Since then, the positive and negative effects have occurred alternately and periodically. In July 2012, there was a major flood in the upper reaches of the Yangtze River, and the TGD had a prominent effect on the water storage, similar to that in 2010. Based on the section from 2013 to 2016 in Figure 5, we found that there were two main crests for the water replenishment of the TGD to Poyang Lake in the first half of each year. The first is caused by the eco-water compensation to the channels and lakes in the middle and lower reaches of the Yangtze River during the dry season, and the second occurs because the TGD must lower the reservoir level to 145 m before the rainy season to improve the flood protection capacity or flooding will occur in the upper reaches of the Yangtze River.
As is shown in Figure 5, the blocking or releasing of water at the TGD at certain moments caused a great change in the PLWL. We divided the positive and negative effects of the TGD on the lake level into 11 intervals according to the daily differences and counted the number of days during 2003-2016 in each interval (Figure 6a*The positive effect was mainly distributed in the (0, 0.6) interval, indicating that the TGD's water replenishment effect on the PLWL is relatively stable. However, the interval distribution of the negative effect is relatively scattered, which shows that the impoundment effect of the TGD on the PLWL varies greatly. The monthly distribution of the negative effect, which causes the lake level to drop by more than 1 m, is shown as Figure 6b. This negative effect only exists from June to November, which coincides with the flood season in the upper reaches of the Yangtze River and the impoundment period of the TGD. Therefore, the significant weakening effect of the TGD on the PLWL mainly occurs during the flood and impoundment period. In particular, in October, the TGD reduces the lake level by more than 1 m for an average of 14.4 days.
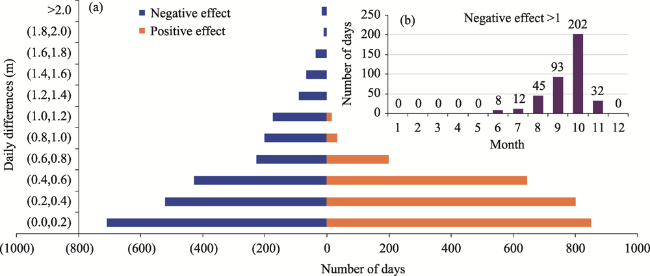
Figure 6 (a) The number of days of daily water level differences in each interval, and (b) the monthly distribution of the negatively affected days that cause the lake level to drop by more than 1 m

4.3 Quantifying the intra-year effect in different periods

In order to better quantify the long-term impact of the TGD on the PLWL, we analyzed the multi-year mean observed water level, the simulated water level, and the daily differences between the simulated water level for the cases with and without the TGD (Figure 7*The effects of the TGD on the PLWL during the dry period, the period before flooding, the flood period, and the impoundment period were quantified more accurately and reasonably at the daily scale in order to avoid the problem that monthly temporal scale may disguise some sharp effects of the TGD on the PLWL in a short time (Liu et al., 2017*From late December to early March, i.e., the main dry period, the lake level rose by about 0.28 m due to replenishment from the TGD. About a month before the flood season, the TGD emptied most of its capacity to enable flood control during the flood season, which also played a role in the annual fluctuation of Poyang Lake's water level. As a result, the differences were positive for most of the days during the dry season and the period before flooding. However, the multi- year mean daily differences became negative during the flooding and impoundment periods because the TGD blocked most of the water from the upper reaches of the Yangtze River in the summer and autumn. From July to August, i.e., the main flood season in the Yangtze River Basin, the TGD weakened the flood peak of Poyang Lake, lowering the water level at the Xingzi station by about 0.25 m. Mid-September to October is the impoundment period of the TGD, but it sometimes lasts until November during the extra-dry years. As is shown in Figure 7, the TGD has a remarkable effect on the decrease in the water level of Poyang Lake during this period, especially in October. By calculating the mean value of the daily differences, it was concluded that the PLWL decreased by 0.91 m in October. As a general rule, it is customary for the lake level at the Xingzi station to drop below 12 m as a sign that Poyang Lake has entered the dry period. Therefore, the TGD causes Poyang Lake to enter the dry period about 7 days earlier on average.
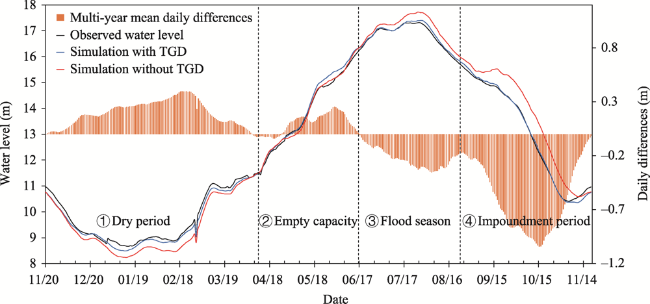
Figure 7 Multi-year mean water level and daily differences at the Xingzi station in Poyang Lake

4.4 Effects on the yearly water level decline of Poyang Lake

Poyang Lake has shrunk in size due to water level decline in recent years, yet the mechanism of this change remains contentious (Liu et al., 2013; Wang et al., 2017*Since this transition occurred around 2000, which is very close to the construction time of the TGD, many studies have focused on the impact of the TGD (Ye et al., 2020*In this study, it was found that the mean value of the multi-year differences during 2003-2006 is 0.07 m after being statistically processed, which shows that the TGD only has had a slight but not very significant impact on the decline of the PLWL. We defined the time interval from the current year to the next year when the TGD reaches the highest water level as a cycle year and calculated the mean water level difference between the cases with and without the TGD in each cycle year (Figure 8*As is shown in Figure 8, the TGD does not necessarily lower the PLWL every year. In fact, it has a replenishing effect on the lake level in some dry years. During 2003-2016, the TGD lowered Poyang Lake's water level by up to 0.468 m from 3 December 2006 to 30 October 2007, and it replenished Poyang Lake by up to 0.163 m from 19 November 2005 to 3 December 2006. Whether the TGD reduces or raises the yearly lake level during a given year mainly depends on the inflow during that year. Figure 9 shows that the correlation coefficient between the annual mean differences and the annual mean inflow of the TGD is about 0.61 (moderately correlated*Therefore, the yearly effect of the TGD on the lake level is affected by the incoming flow from the upper reaches of the Yangtze River and it has little to do with the net differences between the annual inflow and outflow caused by the TGD. To confirm the impact of the TGD on the decline in the yearly lake level, longer hydrological series data need to be considered, including the data before the construction of the TGD, and more driving factors also need to be compared in the future.
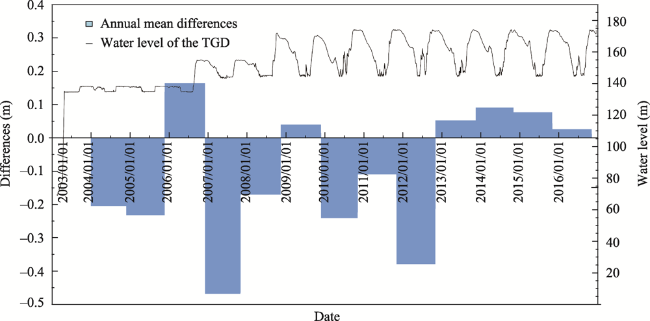
Figure 8 Annual mean water level differences between the cases with and without the Three Gorges Dam during 2003-2016
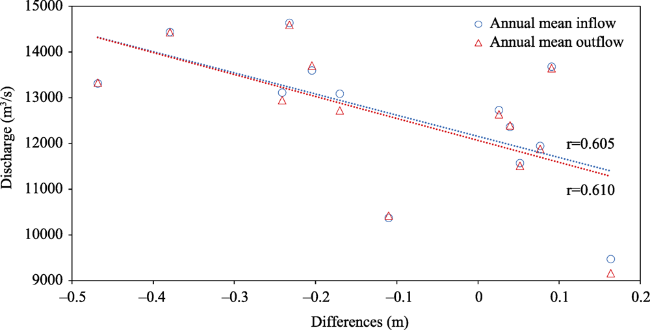
Figure 9 Correlation between the annual mean differences and the annual mean inflow (outflow) of the TGD

5 Conclusions

In this study, we investigated the applicability of three machine learning models (ANN, NARX, and GRU) to the simulation of the PLWL and evaluated the effect of the TGD on the lake level based on water level differences at the daily scale. The main conclusions of this study are as follows.
(1) The machine learning models with historical memory are more suitable for simulating the PLWL under the influence of the TGD. The GRU performs best among the three machine learning models used, with an NSE >0.97.
(2) In the different stages of operation, the TGD has different effects on the PLWL. Before the TGD reached the normal water level of 175 m, the effect of the TGD on lowering the lake level was significant. The effect of the TGD's impoundment on the lake level varied greatly, while the replenishment effect was relatively stable during 2003-2016.
(3) The operation of the TGD has had a significant effect on the intra-year fluctuations in the PLWL, with different performances in different periods. During the flood period and the impoundment period, the TGD lowers the lake level, while it tends to raise the lake level during the dry period and the period before flooding by replenishing the water.
(4) The TGD has a slight but not very significant impact on the yearly water level decline of Poyang Lake, and it only lowered the water level by 0.07 m during 2003-2016. Moreover, the yearly effect of the TGD on the lake level is affected by the incoming flow from the upper Yangtze River.
The results of this study provide scientific guidance for water resource management in the middle and lower reaches of the Yangtze River and for the sustainable development of the Yangtze River Economic Belt.
[1]
Aharon-Rotman Y, McEvoy J, Zheng Z J et al., 2017. Water level affects availability of optimal feeding habitats for threatened migratory waterbirds. Ecology and Evolution, 7(23): 10440-10450.

DOI

[2]
Bonakdari H, Ebtehaj I, Samui P et al., 2019. Lake water-level fluctuations forecasting using minimax probability machine regression, relevance vector machine, Gaussian process regression, and extreme learning machine. Water Resources Management, 33(11): 3965-3984.

DOI

[3]
Chen L G, Chen L M, Jia J W et al., 2019. Quantitative effects of water level variation on the habitat area of wintering waterfowl in dry season of the Poyang Lake. Journal of Hydraulic Engineering, 50(12): 1502-1509. (in Chinese)

[4]
Cho K, Van Merriënboer B, Gulcehre C et al., 2014. Learning phrase representations using RNN encoder-decoder for statistical machine translation. EMNLP 2014-2014 Conference on Empirical Methods in Natural Language Processing, Proceedings of the Conference, 1724-1734.

[5]
Dai X, Wan R R, Yang G S, 2015. Non-stationary water-level fluctuation in China's Poyang Lake and its interactions with Yangtze River. Journal of Geographical Sciences, 25(3): 274-288.

DOI

[6]
Feng L, Han X X, Hu C M et al., 2016. Four decades of wetland changes of the largest freshwater lake in China: Possible linkage to the Three Gorges Dam? Remote Sensing of Environment, 176: 43-55.

DOI

[7]
Feng L, Hu C M, Chen X L, 2014. Dramatic inundation changes of China's two largest freshwater lakes: Natural process or influenced by the Three Gorges Dam? A revisit. Environmental Science and Technology, 48(3): 2088-2089.

DOI

[8]
Gao J H, Jia J J, Kettner A J et al., 2014. Changes in water and sediment exchange between the Changjiang River and Poyang Lake under natural and anthropogenic conditions, China. Science of the Total Environment, 481(1): 542-553.

DOI

[9]
Guo H, Hu Q, Zhang Q et al., 2012. Effects of the Three Gorges Dam on Yangtze River flow and river interaction with Poyang Lake, China: 2003-2008. Journal of Hydrology, 416/417: 19-27.

DOI

[10]
Hu C H, Wu Q, Li H et al., 2018. Deep learning with a long short-term memory networks approach for rainfall-runoff simulation. Water (Switzerland), 10(11): 1-16.

DOI

[11]
Lai X J, Huang Q, Zhang Y H et al., 2014. Impact of lake inflow and the Yangtze River flow alterations on water levels in Poyang Lake, China. Lake and Reservoir Management, 30(4): 321-330.

DOI

[12]
Lai X J, Liang Q H, Jiang J H et al., 2014. Impoundment effects of the Three-Gorges-Dam on flow regimes in two China's largest freshwater lakes. Water Resources Management, 28(14): 5111-5124.

DOI

[13]
Lai X J, Shankman D, Huber C et al., 2014. Sand mining and increasing Poyang Lake's discharge ability: A reassessment of causes for lake decline in China. Journal of Hydrology, 519(PB): 1698-1706.

[14]
Le X H, Ho H V, Lee G et al., 2019. Application of long short-term memory (LSTM) neural network for flood forecasting. Water (Switzerland), 11(7): 1387.

DOI

[15]
Lecun Y, Bengio Y, Hinton G, 2015. Deep learning. Nature, 521(7553): 436-444.

DOI

[16]
Li Y K, Qian F W, Silbernagel J et al., 2019. Community structure, abundance variation and population trends of waterbirds in relation to water level fluctuation in Poyang Lake. Journal of Great Lakes Research, 45(5): 976-985.

DOI

[17]
Liang C, Li H Q, Lei M J et al., 2018. Dongting Lake water level forecast and its relationship with the Three Gorges Dam based on a long short-term memory network. Water (Switzerland), 10(10): 1389.

DOI

[18]
Lin T, Horne B G, Tiňo P et al., 1996. Learning long-term dependencies in NARX recurrent neural networks. IEEE Transactions on Neural Networks, 7(6): 1329-1338.

PMID

[19]
Liu Y B, Wu G P, 2016. Hydroclimatological influences on recently increased droughts in China's largest freshwater lake. Hydrology and Earth System Sciences, 20(1): 93-107.

DOI

[20]
Liu Y B, Wu G P, Guo R F et al., 2016. Changing landscapes by damming: The Three Gorges Dam causes downstream lake shrinkage and severe droughts. Landscape Ecology, 31(8): 1883-1890.

DOI

[21]
Liu Y B, Wu G P, Zhao X S, 2013. Recent declines in China's largest freshwater lake: Trend or regime shift? Environmental Research Letters, 8(1): 14010-14019.

DOI

[22]
Liu Z J, Guo S L, Guo J L et al., 2017. The impact of Three Gorges Reservoir refill operation on water levels in Poyang Lake, China. Stochastic Environmental Research and Risk Assessment, 31(4): 879-891.

DOI

[23]
Ma Y, Xu N, Zhang W H et al., 2020. Increasing water levels of global lakes between 2003 and 2009. IEEE Geoscience and Remote Sensing Letters, 17(2): 187-191.

DOI

[24]
Mei X F, Dai Z J, Du J J et al., 2015. Linkage between Three Gorges Dam impacts and the dramatic recessions in China's largest freshwater lake, Poyang Lake. Scientific Reports, 5(November), 1-9.

[25]
Menezes J M P, Barreto G A, 2008. Long-term time series prediction with the NARX network: An empirical evaluation. Neurocomputing, 71(16-18): 3335-3343.

DOI

[26]
Messager M L, Lehner B, Grill G et al., 2016. Estimating the volume and age of water stored in global lakes using a geo-statistical approach. Nature Communications, 7: 1-11.

[27]
Mohammadi S, Kashefipour S M, 2014. Numerical modeling of flow in riverine basins using an improved dynamic roughness coefficient. Water Resources, 41(4): 412-420.

DOI

[28]
Ning L X, Zhou Y K, Cheng C X et al., 2019. Using a complex network to analyze the effects of the Three Gorges Dam on water level fluctuation in Poyang Lake. ISPRS International Journal of Geo-Information, 8(11): 470.

DOI

[29]
Roushangar K, Shahnazi S, 2020. Prediction of sediment transport rates in gravel-bed rivers using Gaussian process regression. Journal of Hydroinformatics, 22(2): 249-262.

DOI

[30]
Song C Q, Ke L H, 2014. Recent dramatic variations of China's two largest freshwater lakes: Natural process or influenced by the Three Gorges Dam? Environmental Science and Technology, 48(3): 2086-2087.

DOI

[31]
Sun C J, Zhen L, Wang C et al., 2015. Impacts of ecological restoration and human activities on habitat of overwintering migratory birds in the wetland of Poyang Lake, Jiangxi Province, China. Journal of Mountain Science, 12(5): 1302-1314.

DOI

[32]
Theuerkauf E J, Braun K N, Nelson D M et al., 2019. Coastal geomorphic response to seasonal water-level rise in the Laurentian Great Lakes: An example from Illinois Beach State Park, USA. Journal of Great Lakes Research, 45(6): 1055-1068.

DOI

[33]
Wang D, Zhang S H, Wang G L et al., 2019. Quantitative assessment of the influences of Three Gorges Dam on the water level of Poyang Lake, China. Water (Switzerland), 11(7): 1519.

[34]
Wang J D, Sheng Y W, Wada Y, 2017. Little impact of the Three Gorges Dam on recent decadal lake decline across China's Yangtze Plain. Water Resources Research, 53(5): 3854-3877.

DOI

[35]
Woodget A S, Carbonneau P E, Visser F et al., 2015. Quantifying submerged fluvial topography using hyperspatial resolution UAS imagery and structure from motion photogrammetry. Earth Surface Processes and Landforms, 40(1): 47-64.

DOI

[36]
Wrzesiński D, Ptak M, 2016. Water level changes in Polish lakes during 1976-2010. Journal of Geographical Sciences, 26(1): 83-101.

DOI

[37]
Xia S X, Liu Y, Chen B et al., 2017. Effect of water level fluctuations on wintering goose abundance in Poyang Lake wetlands of China. Chinese Geographical Science, 27(2): 248-258.

DOI

[38]
Xu K H, Milliman J D, 2009. Seasonal variations of sediment discharge from the Yangtze River before and after impoundment of the Three Gorges Dam. Geomorphology, 104(3/4): 276-283.

DOI

[39]
Xu X B, Tan Y, Yang G S, 2013. Environmental impact assessments of the Three Gorges Project in China: Issues and interventions. Earth-Science Reviews, 124: 115-125.

DOI

[40]
Yang S Y, Yang D W, Chen J S et al., 2019. Real-time reservoir operation using recurrent neural networks and inflow forecast from a distributed hydrological model. Journal of Hydrology, 579(October): 124229.

[41]
Ye X C, Liu F H, Zhang Z X et al., 2020. Quantifying the impact of compounding influencing factors to the water level decline of China's largest freshwater lake. Journal of Water Resources Planning and Management, 146(6): 05020006.

DOI

[42]
Ye X C, Xu C Y, Zhang Q et al., 2018. Quantifying the human induced water level decline of China's largest freshwater lake from the changing underlying surface in the lake region. Water Resources Management, 32(4): 1467-1482.

DOI

[43]
Yuan Y J, Zeng G M, Liang J et al., 2015. Variation of water level in Dongting Lake over a 50-year period: Implications for the impacts of anthropogenic and climatic factors. Journal of Hydrology, 525: 450-456.

DOI

[44]
Zhang Q, Li L, Wang Y G et al., 2012. Has the Three-Gorges Dam made the Poyang Lake wetlands wetter and drier? Geophysical Research Letters, 39(20): L20402.

[45]
Zhang Q, Ye X C, Werner A D et al., 2014. An investigation of enhanced recessions in Poyang Lake: Comparison of Yangtze River and local catchment impacts. Journal of Hydrology, 517: 425-434.

DOI

[46]
Zhang Z X, Chen X, Xu C Y et al., 2015. Examining the influence of river-lake interaction on the drought and water resources in the Poyang Lake basin. Journal of Hydrology, 522: 510-521.

DOI

[47]
Zheng L, Liu H, Huang Y F et al., 2020. Assessment and analysis of ecosystem services value along the Yangtze River under the background of the Yangtze River protection strategy. Journal of Geographical Sciences, 30(4): 553-568.

DOI

[48]
Zhou Y Q, Ma J R, Zhang Y L et al., 2019. Influence of the Three Gorges Reservoir on the shrinkage of China's two largest freshwater lakes. Global and Planetary Change, 177(March): 45-55.

[49]
Zhu S L, Hrnjica B, Ptak M et al., 2020. Forecasting of water level in multiple temperate lakes using machine learning models. Journal of Hydrology, 585(March): 124819.

Outlines

/