Special Issue: Fluvial and Geomorphological Features

Spatial distribution and influencing factors of Surface Nibble Degree index in the severe gully erosion region of China's Loess Plateau

  • ZHOU Yi , 1, 2 ,
  • YANG Caiqin 1, 2 ,
  • LI Fan 1, 2 ,
  • CHEN Rong 1, 2
Expand
  • 1. School of Geography and Tourism, Shaanxi Normal University, Xi'an 710119, China
  • 2. National Experiment and Teaching Demonstration Center for Geography, Xi'an 710119, China

Zhou Yi (1984-), Associate Professor, specialized in loess landform digital terrain analysis.E-mail:

Received date: 2021-05-17

  Accepted date: 2021-08-19

  Online published: 2022-01-25

Supported by

National Natural Science Foundation of China(41871288)

National Natural Science Foundation of China(41930102)

The Fundamental Research Funds for the Central Universities(GK202003064)

Copyright

© 2021 Science Press Springer-Verlag

Abstract

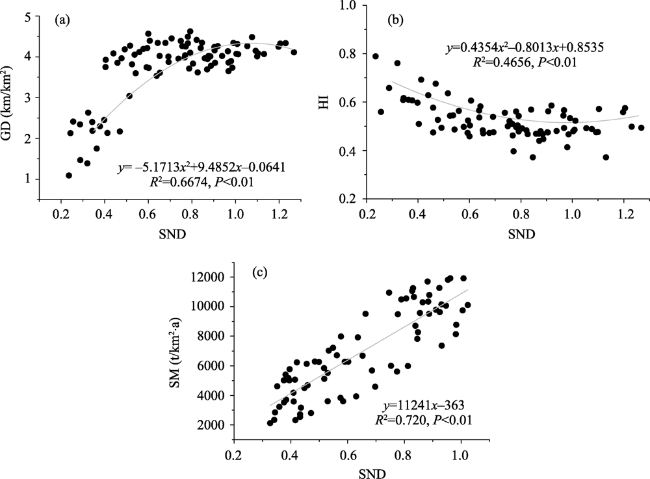
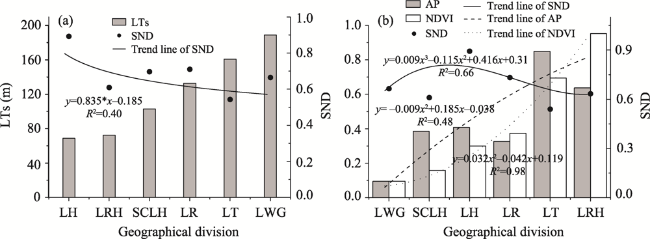
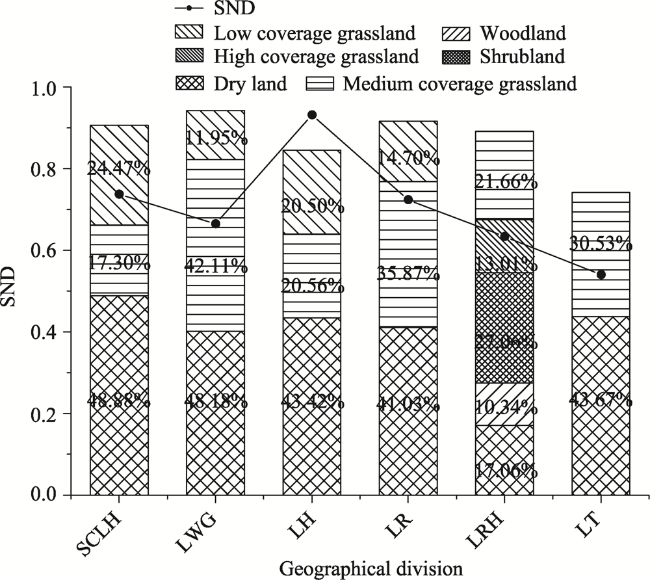
In China's Loess Plateau severe gully erosion (LPGE) region, the shoulder-line is the most intuitive and unique manifestation of the loess landform, which divides a landform into positive and negative terrains (PNTs*The spatial combination model of PNTs is of great significance for revealing the evolution of the loess landform. This study modeled and proposed the Surface Nibble Degree (SND), which is a new index that reflects the comparison of the areas of PNTs. Based on 5 m DEMs and matched high-resolution remote sensing images, the PNTs of 172 complete watersheds in the LPGE were extracted accurately, and the SND index was calculated. The spatial distribution trend of SND was discussed, and the relationship between SND and the factors that affect the evolution mechanism of regional landform was explored further. Results show that: (1) The SND can be calculated formally. It can quantify the development of the loess landform well*2) The SND of the LPGE has evident spatial differentiation that increases from southwest to northeast. High values appear in Shenmu of Shaanxi, Shilou of Shanxi, and northern Yanhe River, whereas the low values are mainly distributed in the southern loess tableland and the inclined elongated ridge area of Pingliang in Gansu and Guyuan in Ningxia*3) In the Wuding River and Yanhe River, the SND decreases with the increase in flow length (FL*In the North-Luohe River and Jinghe River, the SND increases with FL*4) SND is significantly correlated with gully density and sediment modulus and moderately correlated with hypsometric integral. As for the mechanism factors analysis, the relationship between loess thickness and SND is not obvious, but SND increased first and then decreased with the increase of precipitation and vegetation in each geographical division, and we found that the land use type of low coverage grassland has greater erosion potential.

Cite this article

ZHOU Yi , YANG Caiqin , LI Fan , CHEN Rong . Spatial distribution and influencing factors of Surface Nibble Degree index in the severe gully erosion region of China's Loess Plateau[J]. Journal of Geographical Sciences, 2021 , 31(11) : 1575 -1597 . DOI: 10.1007/s11442-021-1912-2

1 Introduction

China's Loess Plateau is one of the regions in the world that is most seriously affected by soil erosion (Feng et al., 2010; Yuan et al., 2019*Soil erosion is affected by various factors, including rainfall, land use, and variations in the catchment surface, such as terrain, topography, and soil type (Clark, 2000; Ochoa et al., 2016; Wang et al., 2016; Rajbanshi and Bhattacharyaa, 2020; Wang et al., 2020*The vast expanse of continuous and widely spread loess on the Loess Plateau, the geomorphology of thousands of gullies, and the serious soil erosion have attracted the attention of domestic and foreign scholars (Li et al., 2020*Geomorphology is the manifestation of internal process, and it is the main basis for the research of its formation causes (Liu, 2016*The gullies on the Loess Plateau are shaped by the unique geographical environment and long-term severe soil erosion. Severe soil erosion has brought great disasters to the natural environment, economy, and society of the region (Zhang, 1993; Li et al., 2008; Gao et al., 2016; Li et al., 2019*Therefore, in-depth research on the landform characteristics and macroscopic spatial differences of the Loess Plateau will reveal its formation mechanism and development trend (Xiong et al., 2021), thereby further clarifying the spatial variance pattern of soil erosion, predicting the development process, and guiding the ecological restoration (Liu et al., 2017) and development of the Loess Plateau. The regional comprehensive management and development (Gao et al., 2016), and the implementation of the strategic policy in harmonious integration of the development of the National Western Development and the environment (Magdoff et al., 2011; Zhang et al., 2012) have important theoretical significance and application prospects.
Unique loess surface morphology must contain clues of the evolution of the loess morphology for a long time (Zhou et al., 2010*The shoulder-line is a topographic structure line that reflects the morphological characteristics of the loess landform best. The inter-gully land (positive terrain) and the gully land (negative terrain) (Luo 1956; Song et al., 1990) divided by the shoulder-line are staggered, thereby forming a unique loess landscape. In the research of Zhou et al. on the 1:1 million digital landform classification system of China's terrestrial landforms, they pointed out that “positive and negative terrains, as one of the five most basic interactive relationships in the classification of landform types, is a unity of the interdependence and role in the formation and evolution of landforms, the frequency of their replacement, the degree of contrast and structural characteristics are very crucial” (Zhou et al., 2009*The binary combination of PNTs has always been an important starting point for studying complex geoscience systems. However, in many geoscience studies, the qualitative description of PNTs is redundant with quantitative research. The reason is that PNTs' boundary is not obvious. In the severe gully erosion areas of the Loess Plateau (LPGE), the problem of the boundary between positive and negative topography can be solved effectively. The shoulder-lines, which are the natural boundary between the PNTs of the loess are more developed because of the vertical cleavage and collapsibility characteristics of loess (Zhou et al., 2010*Therefore, the shoulder-line is an excellent starting point to study the spatial differences of loess morphology and the evolution mechanism of geomorphology. Regarding the study of the loess landform along the shoulder-line, from the perspective of the whole watershed, some predecessors mainly used the inter-gully and gully divided by the shoulder-line to study the topographic and landform characteristics of the two (Jing, 1986; Liu, 1993), the classification system (Luo, 1956), the evolution of loess landforms, and the formation of gullies (Xiong et al., 2016; Lv et al., 2017) and to provide scientific basis for soil and water conservation in the Loess Plateau (Jing, 2004*From the perspective of the basin, most of the existing studies have focused on the areas below the shoulder-line, such as gully density (GD) (Tian et al., 2013), gully point characteristics (Jiang et al., 2013; Zhu et al., 2014) and gully retreat (Vanmaercke et al., 2016), gully network (Wu et al., 2017; Yang et al., 2017), gully profile group (Cao et al., 2019), gully cross section characteristics (Zhou et al., 2020), and the relationship between gully length and area (Li et al., 2017*The research on the positive topography and spatial combination of the PNTs is slightly insufficient. The research on positive topography mainly includes watershed profile (Tang et al., 2015), shallow gully erosion (Zheng et al., 2016), and soil erosion (Wang et al., 2013*The latter research is mainly in line with on the study of the spatial variations and evolution of the loess landforms based on the spatial change characteristics along the gully (Xiao et al., 2007; Zhou et al., 2013; Zhou et al., 2019) and the discussion of the relationship between water and sand (Zheng et al., 1998; Chen et al., 1999).
The above studies have laid the foundation for the development of loess landforms. However, shortcomings, which are mainly reflected in the fact that most studies have segmented the binary combination of the PNTs, are explored in a small area, and lacked the distribution and difference of erosion in large-scale areas, are still encountered. Academician Liu Dongsheng mentioned in the article “The history, current status and future of loess research in China” (Liu et al., 2001) that one of the problems that need to be solved urgently in the study of the Loess Plateau is: “The law of erosion of the loess landform and the time law of its formation we have not studied enough.”
Field surveys and remote sensing interpretation work have found in the LPGE that the distribution of PNTs and their combined morphological characteristics have become the most intuitive and external manifestation of the difference regularity of the loess morphology, which is an important clue for studying the spatial difference of loess morphological types and is also an effective carrier to express the macro-differentiation pattern of loess landform. The evolution of the loess landform is precisely the positive terrain being constantly eroded and the negative terrain constantly expanding. This research begins from the true characteristics of the natural surface. The most intuitive and unique shoulder-line of the loess landform landscape was used as the starting point. Along the line, the ratio of the gully area to the inter-gully area is used as a macro statistical indicator to measure the extent of the development of gully erosion in the region. Its spatial difference characteristics have always been the topic of landform landscape and soil erosion research, and the influences of precipitation, vegetation, land use types (LUTs), and loess thickness (LTs) under the different geographical zoning types are also investigated. This research is a useful exploration of the digital terrain analysis of the Loess Plateau from appearance to mechanism and has great significance to the soil and water conservation work of the plateau.

2 Materials and methods

2.1 Study area and datasets

2.1.1 Study area

The LPGE is located in northwestern China and belongs to semi-arid and semi-humid climate with serious soil erosion and fragile ecological environment (Li et al., 2017) (Figure 1*It is also the main source of sediment in the Yellow River and the key region regarding soil and water conservation in China (Chen et al., 2004; Fu et al., 2017*The study area mainly refers to the core region of the obvious gully erosion in the Loess Plateau, which is characterized by gully development, typical loess cover, various types of landforms, no mountain bedrock exposure, and no plains (Zhou, 2011*The basic geographic data in Figure 1 were obtained from NGCC (http://www.ngcc.cn/ngcc/).
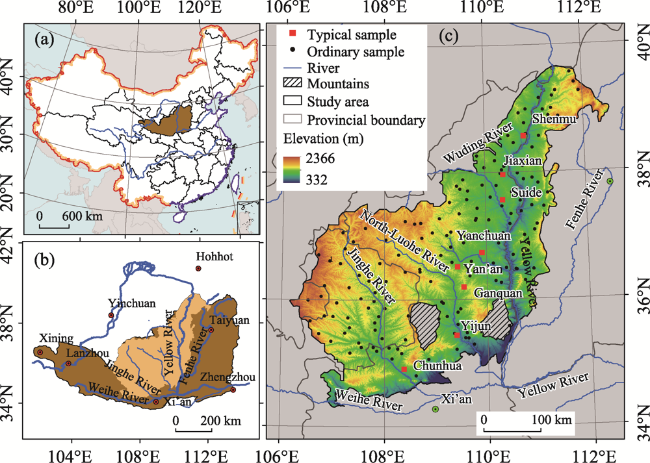
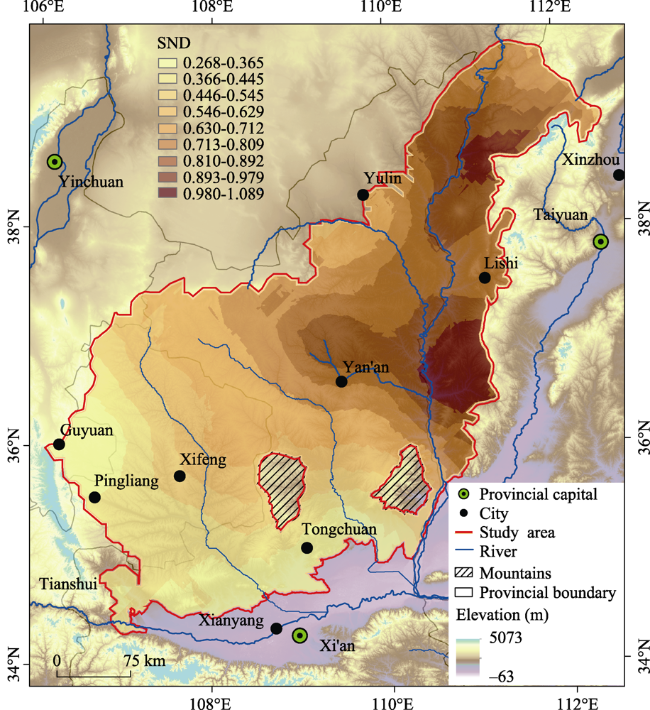
Figure 1 Maps of China's Loess Plateau showing (a) location of the study area, and (b) location of Loess Plateau severe gully erosion region (LPGE); and (c) topographic map of the study area obtained using ASTER GDEM and test area distribution
The region starts from the east of Liupan Mountain in the west to the west of Lvliang Mountain in the east, to the northern boundary of the Guanzhong Plain in the south and to the Mu Us Desert in the north (34°19°‒39°39°N, 106°09°‒112°32°E*It covers an area of 144,220 km2 with an altitude ranging between 332 m and 2366 m above sea level. The types of regional geomorphology from south to north follow the loess tableland (LT) and rugged tableland areas in the south, the loess ridge (LR) in the central part, the loess hill (LH) in the middle and north, and the northern sandstorm transitional area (Zhou et al., 2010*At the same time, this area is the main depositional area of loess, and the thickness of the loess covered ranges from 50 to 300 m, which has obvious regional differences.

2.1.2 Datasets

The high spatial resolution image from Google Earth was used as the data source. On the basis of ensuring data scientificness, completeness, and representativeness of the experimental areas, the data still need to be based on an area that is appropriate (Tian et al., 2013), has stable and typical geomorphological features (Tang et al., 2015; Zhou et al., 2009), and is reasonably distributed in the region to extract 172 sample areas' shoulder-line through a combination method of automatic and visual interpretation. The LT, LR, and LH areas should also be covered. In addition, due to limited data, this study used the 5-m resolution DEM data that were provided by Shaanxi Administration of Surveying, Mapping, and Geo-information. Moreover, the topographic factors that GD and hypsometric integral (HI) of some sample areas, are calculated. The sediment modulus (SM) data came from hydrological stations, and the data of normalized difference vegetation index (NDVI), precipitation, and LUTs were provided by the Resources and Environment Data Center of the Chinese Academy of Sciences. The loess thickness (LTs) data were compiled by the Second Hydrogeological Party of Bureau of Geology and Mineral Resources of Shaanxi Province.

2.2 Methods

2.2.1 Extraction of the shoulder-line

In the LPGE, the shoulder-line has obvious boundaries and divides the complete watershed into the gully area and the inter-gully area. Huge differences can be noted in defining method and morphological characteristics along the shoulder-line in LT and loess hilly-gully area, which are the main landform types in the study (Figure 2*According to a large number of field investigations, gully development in the LT and broken tableland areas is relatively late, and a gentle slope transitional area between the PNTs of the LPGE is observed, the slope of which is roughly in the range of 5°-15°. In the hilly-gully area, the gullies for the hilly and hilly-ridge areas are relatively mature, and the slope between the tops of the elongated ridges (liang) and the gullies have larger slopes in the range of 15°-25° (Xiao et al., 2007), and the slope change characteristics are more evident.
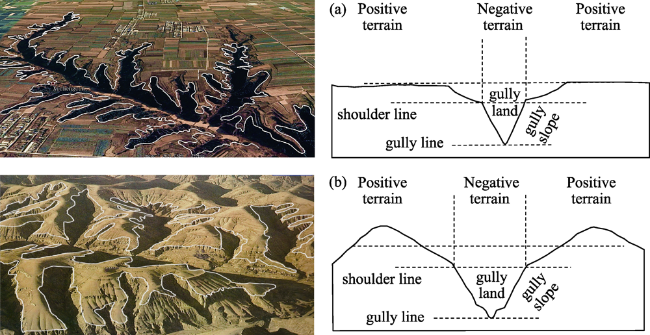
Figure 2 The shoulder-line and its structures on the Loess Plateau severe gully erosion region (a. loess tableland area; b. loess hilly-gully area)
At present, two main methods can be used to obtain the shoulder-line. One is based on high-resolution remote sensing images by using visual interpretation to extract manually. This method has high accuracy but low efficiency. The second is the automatic or semi-automatic extraction of the shoulder-line based on DEM (Xiao et al., 2007; Zhou et al., 2013; Yan et al., 2011) and image segmentation methods (Wang et al., 2015; Yang et al., 2019*Zhou and Xiao identify the candidate points of the shoulder-line based on slope turning (Figure 3*This method is derived from the definition of the shoulder-line itself, which has high accuracy and efficiency but poor continuity. Therefore, our study selected this method to obtain the candidate points along the shoulder-line based on DEM. Subsequently, they were superimposed with high-resolution remote sensing images, and visual interpretation was used to obtain a continuous and accurate shoulder-line of each sample. The area of samples selected in this experiment tends to be approximately 10 km2.
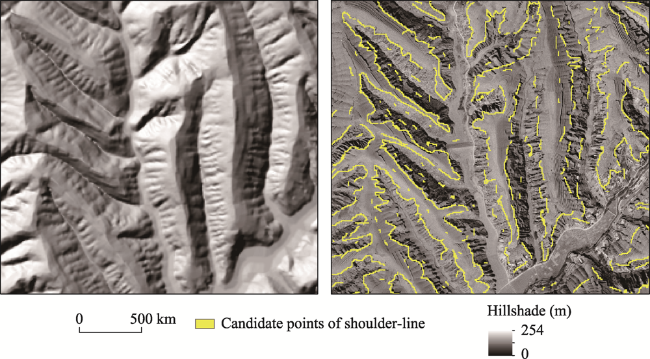
Figure 3 The candidate points of shoulder-line based on automatic method

2.2.2 Construction of the Surface Nibble Degree (SND) Index

In the LPGE, the positive and negative terrains represent the original accumulation of loess surface morphology and the surface morphology shaped by modern erosion, respectively. The shoulder-line is the boundary that divides the loess landform into the PNTs dominated by inter-gully and gully areas. Its dynamic change reveals that the gully expands continuously, the gully area grows gradually, and the landform is being eroded continuously (Figure 4).
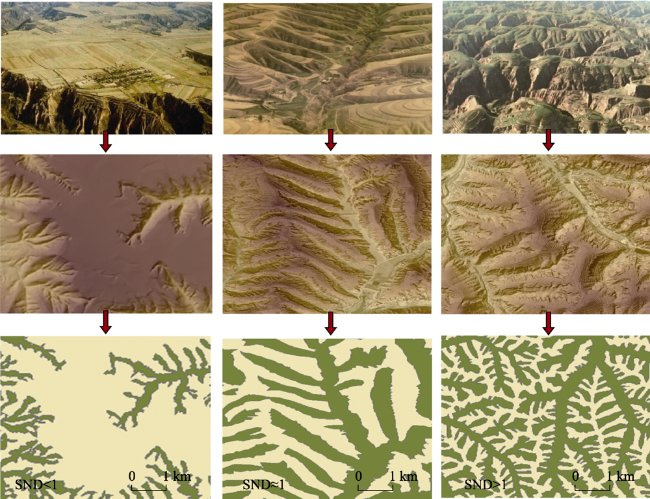
Figure 4 Abstract expression of the process of gully development and the quantification of Surface Nibble Degree on the loess surface
The SND is used to characterize gully developmental morphology in a whole watershed.
The gully expansion is that the positive terrain is constantly eroded by the negative terrain in horizontal dimension. In other words, SND reflects the area ratio of the water erosion gully to the slope surface area without obvious water erosion (Zhou et al., 2011; Yang et al., 2019) and is expressed as:
SND=SN/SP,
where SN is the projected area of the negative terrain area on the horizontal dimension, and SP is the projected area of the positive terrain area on the horizontal dimension. When SND is greater than 1, the negative terrain is dominant. When SND is equal to 1, the area between PNTs are equal, and the development of watershed is at a medium level. The larger the value is, the closer the shoulder-line along the watershed line, the stronger the degree of traceable erosion and lateral erosion, and the more severe the historical sediment yield will be.

2.2.3 Geostatistical interpolation analysis

Geostatistical analysis means to perform the best unbiased interpolation estimation for the sample data based on a large number of sample points by considering the spatial position of the sample points and the distance between the samples. The basis for geostatistical analysis is Tobler's first law of geography, which states that the closer the distance is, the more similar the sample will be. Numerous interpolation methods exist for spatial interpolation through geostatistical analysis (Li et al., 2020*The Kriging interpolation method can reflect various terrain changes. It is widely used in the field of geoscience. Kriging interpolation requires a certain number of sample points that meet the normal distribution, and a spatial correlation is observed between the sample points. In this study, the large number of sample points and the spatial correlation between them met the requirements of the Kriging interpolation method. Therefore, it was used to study the spatial differences of SND. Before conducting spatial interpolation, we performed exploratory analysis for the variables. For the variables that are unsatisfied normal distribution, we conducted the function transformation to satisfy the variables' normal distribution in the histogram. Meanwhile, in the exploratory analysis stage, we found that the variables obey the second-order stationary that is needed for Kriging interpolation through the spatial autocorrelation detection of the semi-variable function. Generally speaking, ordinary Kriging needs to obey the second-order stationary hypothesis, whereas the universal Kriging is fit for the data that has a clear trend. We adopt universal Kriging interpolation because of the obvious spatial trend for the SND. Then, a SND spatial interpolation map was obtained.

3 Results and discussion

3.1 Landform development in eight key tests

The landform types of the eight key test areas basically represent the typical loess landform of different development stages, and along with it, the degree of landform development in these test areas is also quite different. Therefore, the comparison of the SND in these regions provides an insight into the recognition of the regularity of landform development in the LGPE. In this study, eight key test areas, such as Shenmu, Jiaxian, Suide, Yanchuan, Yan'an, Ganquan, Yijun, and Chunhua (Figure 5), were selected from north to south to calculate the SND. According to Table 1, as the degree of landform development continues to mature from south to north, the SND presents a continuous distribution pattern (Zhou et al., 2010*In the Yan'an area, which represents the loess hilly-ridge landform, the SND has reached 0.97 and continues to increase after a low value in Suide area. The supervision area of the Loess Plateau soil and water loss and the ecological construction policies, such as “returning farmland to forests,” and the comprehensive river basin management have been effectively practiced and have contributed to significant regional ecological environment restoration (Fu, 2014*In Jiaxian and Shenmu, the value has exceeded 1, indicating that the negative terrain area exceeds the positive terrain area, the surface erosion has been very serious, and it has become a key concern for water and soil conservation region. In the southern LT and broken tableland areas, the surface erosion is relatively weak, a large area of positive topography is observed. Meanwhile, in the loess hilly-ridge areas where the loess landform is more mature, the surface is more fragmented, and the erosion is more serious.
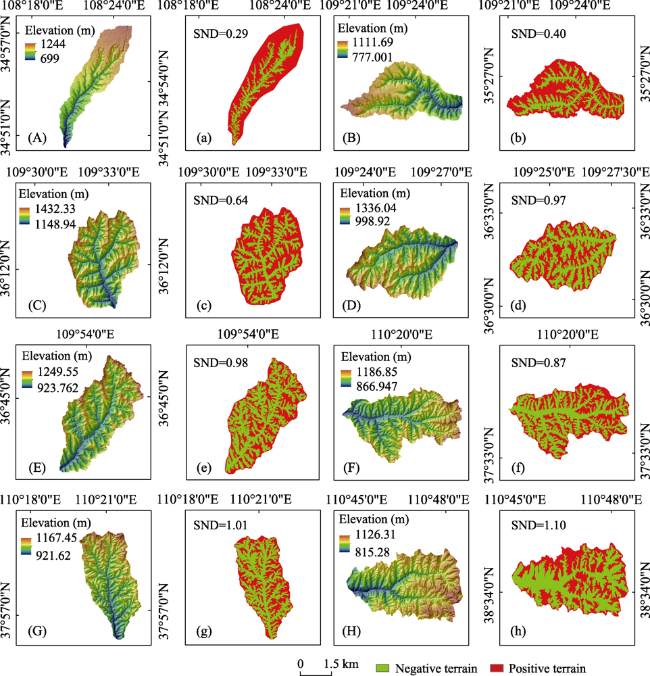
Figure 5 The Surface Nibble Degree of eight key watersheds on the Loess Plateau from south to north (a. Chunhua; b. Yijun; c. Ganquan; d. Yan'an; e. Yanchuan; f. Suide; g. Jiaxian; h. Shenmu)
Table 1 Statistics of different landform types for key watershed samples on the Loess Plateau
Name P terrain (km2) N terrain (km2) Watershed (km2) SND Lon Lat Landform type
Chunhua 30.8425 8.8657 39.7082 0.29 108.376 34.9018 Loess tableland
Yijun 19.1229 7.6041 26.7170 0.40 109.408 35.4398 Loess residual tableland
Ganquan 11.8106 7.5338 19.3444 0.64 109.546 36.2017 Loess ridge
Yan'an 9.3437 9.0372 18.3809 0.97 109.430 36.5230 Loess hilly-ridge
Yanchuan 9.4479 9.3030 18.7509 0.98 109.910 36.7351 Loess hilly-ridge
Suide 6.6881 5.8591 12.5472 0.87 110.332 37.5688 Loess hill
Jiaxian 6.6615 6.7144 13.3759 1.01 110.534 37.9655 Loess hill
Shenmu 5.5759 6.1503 11.7262 1.10 110.778 38.5685 Loess hilly-ridge

3.2 Spatial differences analysis

Existing studies have shown that the systematic exploration of the morphological characteristics, structural types and spatial distribution of the eroded landform is the key to a comprehensive understanding of the loess landform erosion morphology and its evolution (Arabameri et al., 2019; Liu, 2017*This research will explore the spatial differences of SND from two aspects.

3.2.1 Spatial distribution trend of SND in the LPGE

The landform evolution of the LPGE has a certain regularity in the spatial distribution. From south to north, the characteristics of landform development are shown as the LT and rugged tableland areas in the south, the LR in the central part, the LH in the middle and north, and the northern sandstorm transitional area (Zhou, 2011*Based on eight key test areas (Figure 5 and Table1) and 164 general watershed samples (Figure 6 and Table 2) in the LPGE, the universal Kriging interpolation method in the ArcGIS geostatistical analysis is used to simulate the surface spatial trend of the SND, and the trend map is obtained. In Figure 7, SND is gradually increasing from southwest to northeast. The high values of SND appear in the northeast of the study area, especially in Shenmu of Shaanxi, Baode to Xingxian in Shanxi. In the northern area of Yanhe River basin, the value is above 0.87, and the regional geomorphology is very mature, whereas the low value areas of SND are mainly distributed in the LT and rugged tableland areas in the south of the study area. In the inclined elongated ridge area in Guyuan of Ningxia and Pingliang of Gansu, the SND is less than 0.43, the gully development is not obvious, and these areas are a large area of plains. The trend of SND is gradually transitional, and it coincides with previous studies on loess gully erosion landform classification (Zhou, 2011; Liu, 2017; Zhang, 2013; Li et al., 2020), indicating that the spatial pattern of SND in the loess gully area shows good consistency with the distribution of loess landform division.
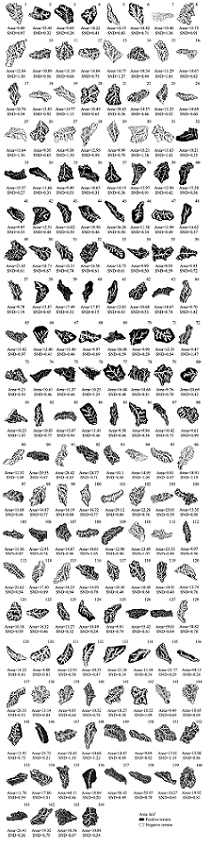
Figure 6 The Surface Nibble Degree of the 164 general watersheds in the Loess Plateau severe gully erosion region
Table 2 Statistics of latitude and longitude of general watershed samples on the Loess Plateau
Number Lat Lon Number Lat Lon
1 110.033 37.0707 12 110.198 38.1848
2 107.951 35.3999 13 109.222 37.0174
3 106.835 35.7482 14 109.474 37.3572
4 107.231 35.4794 15 110.83 36.8835
5 110.279 36.2634 16 110.495 37.3494
6 110.248 36.1131 17 110.915 37.4759
7 110.802 38.772 18 111.382 39.1953
8 110.953 38.3863 19 110.758 36.5699
9 109.305 37.0718 20 109.894 36.4359
10 110.472 37.1896 21 107.331 35.1658
11 109.81 37.2797 22 111.117 39.1658
Number Lat Lon Number Lat Lon
23 109.984 38.0775 68 108.402 35.3774
24 111.052 37.8289 69 111.9215 39.2664
25 110.956 37.094 70 108.608 34.8039
26 109.837 37.4431 71 108.087 35.2474
27 110.713 38.9347 72 110.318 37.4710
28 110.65 37.9804 73 110.700 37.3854
29 110.771 37.8817 74 109.429 37.7926
30 110.758 37.0093 75 110.834 38.9883
31 110.746 38.1056 76 110.918 36.4765
32 106.763 36.0591 77 106.964 35.3487
33 106.554 35.6681 78 110.379 38.0940
34 106.931 36.6177 79 108.403 36.4414
35 107.137 36.5798 80 107.818 35.5294
36 106.513 35.9951 81 107.225 36.8137
37 107.0 35.7445 82 110.584 36.0768
38 110.384 36.4940 83 111.294 38.8903
39 107.070 35.9556 84 109.696 35.6187
40 107.309 36.1977 85 110.174 36.2950
41 107.278 36.7339 86 109.767 36.4583
42 107.320 35.5627 87 110.722 36.6932
43 107.502 35.3238 88 109.793 37.2528
44 107.688 35.8767 89 111.491 38.8743
45 107.807 35.6414 90 108.942 37.0613
46 107.780 35.2545 91 109.081 37.2824
47 109.478 35.8585 92 109.287 37.5356
48 108.143 35.0713 93 109.502 37.7438
49 107.817 36.1229 94 111.186 38.9767
50 107.695 36.3004 95 111.017 37.178
51 107.906 36.5821 96 110.241 36.8861
52 108.025 36.9507 97 109.559 37.8908
53 108.005 35.8717 98 108.712 37.2122
54 107.179 37.0657 99 108.594 37.2009
55 107.623 37.1344 100 108.407 37.2424
56 107.778 37.2294 101 108.712 36.7946
57 109.625 37.5820 102 108.171 37.0806
58 107.553 35.2536 103 107.394 36.9248
59 109.049 35.6990 104 109.59 37.0042
60 109.731 35.2954 105 109.3 36.8327
61 109.626 35.3987 106 108.733 36.976
62 107.540 36.0237 107 110.518 36.7005
63 111.236 37.6664 108 111.093 38.5642
64 110.591 36.4738 109 110.52 37.6902
65 109.551 36.8988 110 110.812 36.7609
66 108.329 35.1554 111 110.746 36.3063
67 108.254 35.2298 112 110.128 36.5689
Number Lat Lon Number Lat Lon
113 109.664 36.3772 139 110.218 37.7938
114 109.697 36.606 140 110.093 37.6126
115 109.322 36.5958 141 109.943 37.8034
116 109.104 36.7068 142 110.936 37.9112
117 108.275 36.7145 143 110.332 37.0434
118 108.693 36.4447 144 110.055 37.2545
119 108.899 36.293 145 109.138 35.9500
120 110.478 38.5782 146 109.397 35.2169
121 108.031 36.2957 147 109.647 37.7163
122 107.493 36.3935 148 110.572 36.4798
123 106.711 36.7131 149 110.693 38.1253
124 106.828 36.2325 150 111.352 39.0003
125 109.811 36.0532 151 111.451 39.2793
126 109.424 35.8032 152 109.841 38.2649
127 109.213 35.7367 153 110.302 37.9837
128 109.111 35.9684 154 110.687 37.5559
129 107.887 35.7404 155 109.563 35.4001
130 107.799 35.9819 156 111.153 37.4615
131 107.291 35.7277 157 110.331 36.9478
132 109.42 35.6105 158 108.461 35.7526
133 109.6 35.4757 159 110.415 35.5783
134 109.358 35.4727 160 108.688 36.4855
135 108.848 35.0658 161 111.830 39.4029
136 107.848 35.1926 162 111.752 39.5629
137 106.735 35.4812 163 110.829 38.6034
138 110.58 38.4604 164 110.332 38.0383
Figure 7 Spatial distribution of Surface Nibble Degree on the Loess Plateau

3.2.2 Spatial variances of SND in the middle reaches of the Yellow River

The middle reaches of the Yellow River flow through the core area of LPGE. In this study, the Wuding River, Yanhe River, North-Luohe River, and Jinghe River from north to south are selected as the study areas. The flow length (FL) of every small watershed with its water outlet as the direction axis is used to explore the different characteristics of SND in each watershed.
The FL is a distance of the starting point of each small watershed to the outlet point along the river network, which makes the centroid of each watershed as the starting point, and its unit is kilometers.
The Wuding River belongs to the first level basin of the Yellow River. The landform in the basin is dominated by LR, which is seriously eroded and mature. As shown in Figure 8a, the value of SND in the basin continues to decrease with the increase in FL, which also indicates that the erosion in the lower reaches of this basin is more serious than that in the upper reaches. In addition, the northern part, which is far from the water outlet, belongs to the sandstorm transitional area, which is an alternate zone of water and wind erosion, and the erosion is relatively strong.
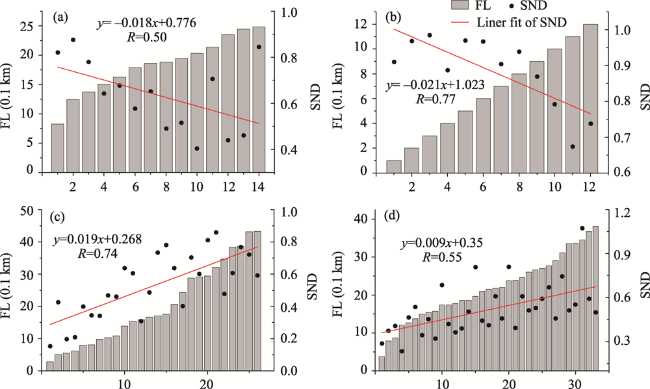
Figure 8 SND changes with the flow length in each watershed of the Yellow River Basin (a. Wuding River; b. Yanhe River; c. North-Luohe River; d. Jinghe River)

SND changes with the flow length in each watershed of the Yellow River Basin (a. Wuding River;
b. Yanhe River; c. North-Luohe River; d. Jinghe River)

The Yanhe River, which flows from Ansai to Yanchuan in Shaanxi, also belongs to the first level of the Yellow River Basin and is a transitional area of loess hilly-ridge landform. The SND value of each basin with the increase in FL decreases more smoothly in Figure 8b, that is, the longer the FL is, the weaker the erosion will be.
Three landform types can be found in the North-Luohe River basin and Jinghe River basin, and they all belong to the second level basins of the Yellow River Basin. Existing studies found that most of the landform types at the outlet of the basins are LT and rugged tableland areas. In comparison with loess hilly-ridge areas in the upper and middle reaches of the basins, the LT areas are covered with large patches of positive terrain, the development of this landform is very young, and the erosion is relatively weak (Li et al., 2017*Thus, the value of the SND is relatively small and is the same as those in Figures 8c and 8d. From LT to LR and then to LH, the value of the SND increases with the FL. Such findings also explain the coupling between the developmental stage of the landform types and the SND to some extent.

3.3 Correlation analysis of landform development indicators

In existing studies, some indicators, such as GD, HI and SM, have been proven to be able express the evolution stage of the landform better. GD represents the ratio of the gully line length to the watershed area, HI represents the relationship between the elevation and the area in a watershed, and SND represents the ratio of the area of positive terrain to the area of negative terrain in a watershed. From the perspective of geomorphology, these indicators all reflect the erosion and development of loess landforms. Therefore, they are correlated to some extent. Theoretically, for the younger landform area, the bigger the HI is, the smaller the GD will be, and the smaller the SND is. However, the notion is not completely consistent with our conclusion. The SND has a strong correlation with GD (R2=0.6674, P<0.01) (Figure 9a), and SM (R2=0.720, P<0.01) (Figure 9c), whereas the correlation with HI (R2=0.4656, P<0.01) (Figure 9b) is not so strong. Considering the accuracy and limitation of 5-m DEM, 90 samples were selected to calculate HI based on Zhu et al*2013), and GD was calculated on the basis of Tian et al*2013), SM data were obtained from 80 hydrological stations.
Figure 9 The correlations between Surface Nibble Degree and the indexes of watershed evolution and soil sediment modulus (HI, GD and SM) (HI - hypsometric integral; GD - gully density; SM - sediment modulus)
The HI is a three-dimensional index constructed on the basis of watershed elevation and area (Zhou et al., 2019*It is a macroscopic index and can be used to divide the development stage of regional geomorphology, revealing that the eroded material in the watershed accounts for the total. The SND is a two-dimensional plane index that represents that the degree of the positive terrain is eroded by the negative terrain and has nothing to do with elevation.
The correlation between SND and GD is higher. GD is a topographical feature factor that can reflect the development of gully in the LPGE, compared with SND based on a two- dimensional plane. The latter can not only indicate the direction in which the gully extends, but also the degree of lateral widening in multi-direction. In addition, GD is affected by terrain and DEM resolution, the extraction of gully line often needs to adopt appropriate thresholds, which are subjectively affected by human activities and are uncertain. Moreover, a large number of mixed gullies with inherited gullies and water erosion gullies in the LPGE were observed to have a greater influence on the GD.
SM is a comprehensive index. There is a good correlation between SM and SND (Figure 9c), which is also an internal performance of the development of landform erosion. However, the SM data are often due to the considerable area of the hydrological stations, the large difference in geographical conditions in the basin, and the complex erosion types in fact cannot reflect the erosion on different types of landform units or land use units. Furthermore, the observation values of the hydrological stations correspond to the amount of suspended sediments, and the load is not counted. Therefore, SND can be used as a reliable indicator to measure the degree of regional erosion.

3.4 Analysis of factors that affect landform development

Soil erosion on the Loess Plateau is restricted by many factors. Previous research has shown that the major natural factors affecting soil erosion include geology and topography, climate, soil, and vegetation. In this research, we used LTs, annual precipitation (AP), NDVI, and LUTs as influencing factors in different geographical divisions to study their effects. Geographical division map is provided by National Earth System Science Data Center, National Science & Technology Infrastructure of China (http://www.geodata.cn), including sandstorm transition (SST), loess wide gully (LWG), sand-covered loess hill (SCLH), loess inter-montane basin (LIMB), LH, LR, LT, loess rocky hill (LRH), bed-rocky mountains (BRM), and river alluvial plain (RAP*Considering that obvious gullies in SST, LIMB, BRM, and RAP are few, our study does not consider these types.

3.4.1 Loess thickness

A huge area of continuously and widely spread loess can be found on the Loess Plateau, especially in Dongzhiyuan, Luochuanyuan, and the inclined elongated ridges of Guyuan in Ningxia. The LTs can reach more than 150 m. Figure 10a shows that the influence of LTs on SND is not obvious, and existing studies believe that the LTs have a greater impact on the vertical erosion index (Zhou et al., 2019), while SND is a sign of erosion in horizontal dimension. Field research shows that the sedimentary loess of the north of Qingyang in Gansu and south of Wuqi in Shaanxi has been undergoing a flowing water erosion controlled by Ordos ancient topography. The degree of erosion is greater, thereby forming a deep and slender dendritic gully extension. The surface erosion is not obvious, but the slope is large, which is attributed to the prime period of gully development.
Figure 10 The relationship between Surface Nibble Degree with LTs (a) and NDVI - AP (b) in different geographical divisions (LT -loess thickness; AP - annual precipitation; NDVI - normalized difference vegetation index; LWG - loess wide gully; SCLH - sand-covered loess hill; LH - loess hill; LR - loess ridge; LT - loess tableland; LRH - loess rocky hill)

3.4.2 NDVI and annual precipitation

Precipitation is an important factor that affects soil erosion and landform development (Zhou et al., 2019*By studying the relationship between AP and SND (Figure 10b), we found that the SND first increase and then decrease with the increment in AP. Rainfall and slope runoff are used as the main motivation of soil separation and sediment transport (Feng et al., 2010*However, high-intensity vegetation can be found in the LRH and LT areas, the total amount of rainfall is large but not concentrated, and this vegetation can not only directly intercept rainfall and reduce the amount of rainfall input into the forest land but can also weaken the energy of rainfall and convert the energy into penetration energy, and reduce soil erosion (Liu et al., 1994*Thus, the SND decreases with rainfall in these regions. Apart from of this, we believe that precipitation intensity and previous soil water content also have more important impact on erosion. Due to the limited time of the data in this paper, we hope to study these influences on the SND in the future.
The role of vegetation in preventing and controlling soil erosion has been widely discussed by scholars at home and abroad. Since people's research on soil erosion began, they have realized important role vegetation plays in preventing and controlling soil erosion (Chen et al., 1996; Yang et al., 2014*Vegetation affects soil erosion mainly by reducing the energy of rainfall so that the surface is not directly hit by rainfalls, increasing ground runoff infiltration time, improving soil physical and chemical properties, and enhancing soil erosion resistance (Carroll et al., 2000*NDVI is widely used as a vegetation index for monitoring and expressing the conditions of vegetation because it is closely linked with vegetation cover density, biomass, and leaf area index (Tucker et al., 1979*In our study, we use the NDVI data to study the influence of vegetation on SND. As shown in Figure 10b, with the gradual increase in NDVI from north to south, the SND first increases and then decreases when the vegetation coverage reaches a certain threshold, which is in good agreement with previous studies (Li et al., 2015; Zhou et al., 2019*However, their special values in our study need to be verified further.

3.4.3 Land use types

Regarding the impact of LUTs on SND, we used the zonal statistical analysis method to calculate the land use categories under different geographical divisions. This study only shows that the LUTs in each zone accounts for more than 10% of the total area of the class, and then the average SND of each zone is calculated. As shown in Figure 11, except for the LRH area, dry land accounts for about 40% in other zones (Table 3), and low coverage grassland is only distributed in loess hilly-ridge and wide hilly-gully areas, the SCLH in the study area is relatively small. The more grassland with low coverage, the more serious the erosion. The possible reason is that this grassland type lacks water and is sparse, and the surface is dry; hence, the viscosity of the loess particles is low with the occurrence of runoff due to the lack of intercepting precipitation. Erosion occurs easily, and the surface loess is affected by runoff, thereby intensifying the erosion. The research is consistent with Lei X (2020), where in high-coverage grassland and woodland areas have weak erosion, while low coverage grassland has strong erosion.
Figure 11 The relationships between Surface Nibble Degree and LUTs in different geographical divisions of the Loess Plateau (LUTs - land use types; LWG - loess wide gully; SCLH - sand-covered loess hill; LH - loess hill; LR - loess ridge; LT - loess tableland; LRH - loess rocky hill)
Table 3 Statistics of land use types and areas in different geographical divisions of the Loess Plateau (SST - sandstorm transition; LWG - loess wide gully; SCLH - sand-covered loess hill; LIMB - loess inter-montane basin; LH - loess hill; LR - loess ridge; LT - loess tableland; LRH - loess rocky hill; BRM - bed-rocky mountains; RAP - river alluvial plain; HCGL - high coverage grassland; MCGL - medium coverage grassland; LCGL - low coverage grassland)
SST LWG SCLH LIMB LH LR LRH LT BRM RAP
Dry land (%) 40.20 40.18 48.88 54.75 43.42 41.03 17.06 43.67 33.77 67.83
Woodland (%) 10.34
Shrubland (%) 10.52 27.06 13.55
HCGL (%) 13.01
MCGL (%) 10.81 42.11 17.30 20.56 35.87 21.66 30.53 24.95 18.47
LCGL (%) 31.21 11.95 24.47 16.18 20.50 14.70 13.62

4 Conclusions

This research uses a combination of semi-automatic and visual interpretation method to extract the shoulder-line, constructs SND, and uses geostatistical analysis method to explore the spatial differences of SND and reveal the spatial pattern of loess landform deeply and systematically. It is also of great significance to the planning of soil and water conservation on the Loess Plateau.
(1) The SND can be calculated formally.
(2) SND shows a pattern of gradual increase from southwest to northeast, and high values appear in Shenmu of Shaanxi, Shilou of Shanxi, and northern Yanhe River, whereas the low values are mainly distributed in the southern LT and the inclined elongated ridge area of Pingliang in Gansu and Guyuan in Ningxia. High value areas are the areas that are most seriously affected by soil erosion and sediment yield in the LPGE. The erosion modulus is above 9000 (t·km‒2·a‒1), and it is as high as 13,000 (t·km‒2·a‒1) in Hequ and Shilou. Once again, this result confirmed the importance of soil and water conservation to soil erosion.
(3) The first level basins of the middle reaches of the Yellow River, such as the Yanhe River and Wuding River, have the worst erosion. With increase in FL, the SND decreases in the first level basins and increases in the second level basins. The SND is an indicator of landform development types. In the watershed with single landform type or similar development stage, the influence of FL is more significant. In the large watershed with complex geomorphic types, the influence of FL on the SND is insignificant because of the difference of landform development stages.
(4) The SND, highly coupled with SM, has an obvious correlation with GD and a middle correlation with HI. Therefore, the SND of the LPGE can be used as an important parameter to measure the intensity of soil erosion and the stage of landform development. As for the mechanism factor analysis, the relationship between LTs and SND is not obvious, but SND increased first and then decreased with the increase of AP and NDVI in each geographical division, and we found that the TUTs of low coverage grassland have greater erosion potential. Soil erosion is restricted by many factors, it is expected that detailed studies will be carried out from the perspectives of rainfall intensity, aspect and so on in the future for providing scientific advice and references for soil and water conservation on the Loess Plateau.
[1]
Arabameri A, Pradhan B, Rezaei K, 2019. Spatial prediction of gully erosion using ALOS PALSAR data and ensemble bivariate and data mining models. Geosciences Journal, 23(4): 669-686.

DOI

[2]
Cao J J, Tang G A, Fang X et al., 2019. Terrain relief periods of loess landforms based on terrain profiles of the Loess Plateau in northern Shaanxi Province, China. Frontiers of Earth Science, 13(2): 410-421.

DOI

[3]
Carroll C, Merton L, Burger P, 2000. Impact of vegetative cover and slope on runoff, erosion, and water quality for field plots on a range of soil and spoil materials on central Queensland coal mines. Soil Research, 38(2): 313-328.

DOI

[4]
Chen H, Lu Z C, Zhou J X et al., 2004. Interactions of environmental factors on sediment yield in the region of the middle Yellow River basin. Journal of Sediment Research, 2004(2): 40-46. (in Chinese)

[5]
Chen H, Wang K Z, 1999. A study on the slope gully erosion relationship on small basins in the loess areas at the middle reaches of the Yellow River. Geographical Research, 18(4): 363-372. (in Chinese)

[6]
Chen Q B, Fei X L, 1996. New progress in the research of soil erosion forecast. Soil and Water Conservation in China, (2): 20-23. (in Chinese)

[7]
Clark C, 2000. Storms, floods and soil erosion: The consequences of the storm of 13 May 1998 at Hadspen, Somerset. Weather, 55(1): 17-25.

DOI

[8]
Fu B J, 2014. The integrated studies of geography: Coupling of patterns and processes. Acta Geographica Sinica, 69(8): 1052-1059. (in Chinese)

[9]
Feng X M, Wang Y F, Chen L D et al., 2010. Modeling soil erosion and its response to land-use change in hilly catchments of the Chinese Loess Plateau. Geomorphology, 118(34): 239-248.

DOI

[10]
Gao H D, Li Z B, Jia L L, et al., 2016. Capacity of soil loss control in the Loess Plateau based on soil erosion control degree. Journal of Geographical Sciences, 26(4): 457-472.

DOI

[11]
Jing K, 1986. A study on gully erosion on the Loess Plateau. Scientia Geographica Sinica, 6(4): 340-347. (in Chinese)

[12]
Jing K, Zheng F L, 2004. An introduction to the typical models for soil and water conservation in China. Research of Soil and Water Conservation, 11(4): 34-39. (in Chinese)

[13]
Jiang L, Tang G A, Zhao M W et al., 2013. Extraction and analysis of loess gully heads considering geomorphological structures. Geographical Research, 32(11): 2153-2162. (in Chinese)

[14]
Lei X, 2020. Research on the spatial differentiation characteristics of the proximity index of the Loess Plateau in northern Shaanxi based on DEM[D]. Xi'an: Shaanxi Normal University. (in Chinese)

[15]
Li C R, Li F Y, Ma J et al., 2017. The study of watershed topography characteristic in the middle reaches of the Yellow River. Geography and Geo-Information Science, 33(4): 107-112. (in Chinese)

[16]
Li C R, Li F Y, Dai Z Y et al., 2020. Spatial variation of gully development in the Loess Plateau of China based on the morphological perspective. Earth Science Informatics, 13(4): 1103-1117.

DOI

[17]
Li Z, Zhang Y, Zhu Q K et al., 2015. Assessment of bank gully development and vegetation coverage on the Chinese Loess Plateau. Geomorphology, 228(1): 462-469.

DOI

[18]
Li Z, Zhang Y, Zhu Q K et al., 2017. A gully erosion assessment model for the Chinese Loess Plateau based on changes in gully length and area. Catena, 148(2): 195-203.

DOI

[19]
Li Z B, Zhu B B, Li P, 2008. Advancement in study on soil erosion and soil and water conservation. Acta Pedologica Sinica, 45(5): 802-809. (in Chinese)

[20]
Li Z S, Yang L, Wang G L et al., 2019. The management of soil and water conservation on the Loess Plateau of China: Present situations, problems, and counter-solutions. Acta Ecologica Sinica, 39(20): 7398-7409. (in Chinese)

[21]
Liu G B, Shangguan Z P, Yao W Y et al., 2017. Ecological effects of soil conservation in Loess Plateau. Bulletin of Chinese Academy of Sciences, 32(1): 11-19. (in Chinese)

[22]
Liu K, 2017. Gully features extraction and the regional difference analysis in the severe soil erosion region of Loess Plateau of China based on multisource data. Nanjing: Nanjing Normal University. (in Chinese)

[23]
Liu L M, Liu P, 1993. Study on methodology and models of quantifying soil erosion in the hilly-gully loess regions. Journal of Soil and Water Conservation, 7(3): 73-79. (in Chinese)

[24]
Liu T S, Sun J M, Wu W X, 2001. Past, present and future of the Chinese loess research: A discussion on the reality facts and math. Quaternary Sciences, 21(3): 185-207. (in Chinese)

[25]
Liu X D, Wu Q X, Zhao H Y, 1994. The vertical interception function of forest vegetation and soil and water conservation. Research of Soil and Water Conservation, 1(3): 8-13. (in Chinese)

[26]
Luo L X, 1956. A tentative classification of landforms in the Loess Plateau. Acta Geographica Sinica, 22(3): 201-222. (in Chinese)

[27]
Lv G N, Xiong L Y, Chen M et al., 2017. Chinese progress in geomorphometry. Journal of Geographical Sciences, 27(11): 1389-1412.

DOI

[28]
Magdoff F, 2011. Ecological civilization. Monthly Review, 62(8): 1-25.

[29]
Ochoa P A, Fries A, Mejía D et al., 2016. Effects of climate, land cover and topography on soil erosion risk in a semiarid basin of the Andes. Catena, 140: 31-42.

DOI

[30]
Rajbanshi J, Bhattacharyaa S, 2020. Assessment of soil erosion, sediment yield and basin specific controlling factors using RUSLE-SDR and PLSR approach in Konar River Basin, India. Journal of Hydrology, 587(C): 1-55.

[31]
Song G Q, Li L T, Li R, 1990. Approach on proportions between gullied-land and ridge-land in the rolling loess area, northern Shaanxi. Bulletin of Soil and Water Conservation, 10(3): 37-44.. (in Chinese)

[32]
Tian J, Tang G A, Zhou Y et al., 2013. Spatial variation of gully density in the Loess Plateau. Scientia Geographica Sinica, 33(5): 622-628.. (in Chinese)

[33]
Tucker C, 1979. Red and photographic infrared linear combinations for monitoring vegetation. Remote Sensing of Environment, 8(2): 127-150.

DOI

[34]
Vanmaercke M, Poesen J, Van M B et al., 2016. How fast do gully headcuts retreat? Earth Science Reviews, 154: 336-355.

DOI

[35]
Wang B, Zheng F L, Mathias J M et al., 2013. Soil erodibility for water erosion: A perspective and Chinese experiences. Geomorphology, 187: 1-10.

DOI

[36]
Wang N, Jiao J Y, Bai L C et al., 2020. Magnitude of soil erosion in small catchments with different land use patterns under an extreme rainstorm event over the northern Loess Plateau, China. Catena, 195: 104780.

DOI

[37]
Wang Z J, Jiao J Y, Rayburg S et al., 2016. Soil erosion resistance of “Grain for Green” vegetation types under extreme rainfall conditions on the Loess Plateau, China. Catena, 141: 109-116.

DOI

[38]
Wu X L, Xiong L Y, Hu E L, 2017. An adaptive approach to selecting accumulation threshold for gully networks extraction from DEMs. Geography and Geo-Information Science, 33(4): 93-98. (in Chinese)

[39]
Xiao C C, Tang G A, 2007. Classification of valley shoulder line in loess relief. Arid Land Geography, 30(5): 646-653. (in Chinese)

[40]
Xiong L Y, Tang G A, Strobl J et al., 2016. Paleotopographic controls on loess deposition in the Loess Plateau of China. Earth Surface Processes Landforms, 41(9): 1155-1168.

DOI

[41]
Xiong L Y, Tang G A, Yang Xin et al., 2021. Geomorphology-oriented digital terrain analysis: Progress and perspectives. Journal of Geographical Sciences, 31(3): 456-476.

DOI

[42]
Yan J S, Tang G A, Li F Y et al., 2011. An edge detection based method for extraction of loess shoulder-line from grid DEM. Geomatics and Information Science of Wuhan University, 36(3): 363-367. (in Chinese)

[43]
Yang L, Wei W, Chen L D et al., 2014. Response of temporal variation of soil moisture to vegetation restoration in semi-arid Loess Plateau, China. Catena, 115: 123-133.

DOI

[44]
Yang X, Dai W, Tang G A et al., 2017. Deriving ephemeral gullies from VHR image in loess hilly areas through directional edge detection. ISPRS International Journal of Geo-Information, 6(11): 371-389.

DOI

[45]
Yang X Na, J M, Tang G A et al., 2019. Bank gully extraction from DEMs utilizing the geomorphologic features of a loess hilly area in China. Frontiers of Earth Science, 13(1): 151-168.

DOI

[46]
Yuan X F, Han J C, Shao Y J et al., 2019. Geodetection analysis of the driving forces and mechanisms of erosion in the hilly-gully region of northern Shaanxi Province. Journal of Geographical Sciences, 29(5): 779-790.

DOI

[47]
Zhang J C, 2012. Policy research on ecological environment management in western China[D]. Yangling: Institute of Soil and Water Conservation, Northwest A&F University. (in Chinese)

[48]
Zhang L, 2013. Spatial pattern of the loess landforms based on core topographic factor analysis[D]. Nanjing: Nanjing Normal University. (in Chinese)

[49]
Zheng F L, Kang S Z, 1998. Erosion and sediment yield in different zones of loess slopes. Acta Geographica Sinica, 53(5): 428-435. (in Chinese)

[50]
Zheng F L, Xu X M, Qin C, 2016. A review of gully erosion process research. Transactions of the Chinese Society for Agricultural Machinery, 47(8): 48-59, 116. (in Chinese)

[51]
Zhou C H, Cheng W M, Qian J K et al., 2009. Research on the classification system of digital land geomorphology of 1: 1000000 in China. Journal of Geo-Information Science, 11(6): 707-724. (in Chinese)

DOI

[52]
Zhou Y, 2011. DEM based research on positive-negative terrains and their spatial variation on Loess Plateau[D]. Nanjing: Nanjing Normal University. (in Chinese)

[53]
Zhou Y, Lei X, Yang F et al., 2019. Characteristics and influencing factors of proximity distance index on the northern Shaanxi Loess Plateau in China. Journal of Mountain Science, 16(12): 2844-2855.

DOI

[54]
Zhou Y, Tang G A, Xi Y et al., 2013. A shoulder-lines connection algorithm using improved Snake Model. Geomatics and Information Science of Wuhan University, 38(1): 82-85. (in Chinese)

[55]
Zhou Y, Yang X, Xiao C C et al., 2010. Positive and negative terrains on northern Shaanxi Loess Plateau. Journal of Geographical Sciences, 20(1): 64-76.

DOI

Outlines

/