Research Articles

Urban forest loss using a GIS-based approach and instruments for integrated urban planning: A case study of João Pessoa, Brazil

  • Leandro Ismael de Azevedo LACERDA 1 ,
  • José Augusto Ribeiro da SILVEIRA 2 ,
  • Celso Augusto Guimarães SANTOS , 3, * ,
  • Richarde Marques da SILVA 4 ,
  • Alexandro Medeiros SILVA 4 ,
  • Thiago Victor Medeiros do NASCIMENTO 3 ,
  • Edson Leite RIBEIRO 5 ,
  • Paulo Vitor Nascimento de FREITAS 1
Expand
  • 1. Federal University of Paraíba, Laboratory of Urban and Built Environment - LAURBE, 58051-900 João Pessoa, Paraíba, Brazil
  • 2. Federal University of Paraíba, Department of Architecture and Urbanism, 58051-900 João Pessoa, PB, Brazil
  • 3. Federal University of Paraíba, Department of Civil and Environmental Engineering, 58051-900 João Pessoa, PB, Brazil
  • 4. Federal University of Paraíba, Department of Geosciences, 58051-900 João Pessoa, PB, Brazil
  • 5. Ministry of Cities, Setor de Autarquias Sul, Quadra 01, Lote 01/06, Bloco H, Ed. Telemundi II, 70070-010 Brasília, DF, Brazil
*Celso A G Santos (1966-), PhD and Professor, E-mail:

Leandro I A Lacerda (1994-), specialized in architecture and urbanism

Received date: 2020-11-08

  Accepted date: 2021-03-10

  Online published: 2021-12-25

Supported by

Brazilian Agency for the Improvement of Higher Education(Coordenação de Aperfeiçoamento de Pessoal de Nível Superior - CAPES) - Fund Code 001;The National Council for Scientific and Technological Development, Brazil - CNPq(304213/2017-9)

The National Council for Scientific and Technological Development, Brazil - CNPq(304540/2017-0)

The Federal University of Paraíba

Abstract

Urban forests play an important role in the thermal comfort and overall life of local populations in large- and medium-sized cities. This study analyzes urban forest loss and maps land use and land cover (LULC) changes between 1991 and 2018 by evaluating the use of urban planning instruments for the mitigation of urban forest loss in João Pessoa, Brazil. For this purpose, satellite-derived LULC images from 1991, 2006, 2010 and 2018 and data on urban forest loss areas obtained using the Google Earth Engine were used. In addition, this paper also discusses the instruments used for integrated urban planning, which are (a) the legal sector, responsibility and nature; (b) the urban expansion process; and (c) the elements of urban infrastructure. The results show a clear shift in land use in the study area. The major changes in LULC classes occurred in urban areas and herbaceous vegetation, while the greatest loss was in arboreal/shrub vegetation. Thus, an increase in the pressure to occupy zones intended for environmental preservation could be estimated. Our results showed similar accuracies with other studies and more spatial details. The characteristics of the patterns, traces, and hotspots of urban expansion and forest cover loss were explored. We highlighted the potential use of this proposed framework to be applied and validated in other parts of the world to help better understand and quantify various aspects of urban-related problems such as urban forest loss mapping using instruments for integrated urban planning and low-cost approaches.

Cite this article

Leandro Ismael de Azevedo LACERDA , José Augusto Ribeiro da SILVEIRA , Celso Augusto Guimarães SANTOS , Richarde Marques da SILVA , Alexandro Medeiros SILVA , Thiago Victor Medeiros do NASCIMENTO , Edson Leite RIBEIRO , Paulo Vitor Nascimento de FREITAS . Urban forest loss using a GIS-based approach and instruments for integrated urban planning: A case study of João Pessoa, Brazil[J]. Journal of Geographical Sciences, 2021 , 31(10) : 1529 -1552 . DOI: 10.1007/s11442-021-1910-4

1 Introduction

Urban forests are essential to the quality of life of the local population. However, forest cover in urban areas has been gradually decreasing with the increase in urbanization worldwide (Jones and McDermott et al., 2018; Baines et al., 2020). The natural environment plays a direct role in quality of life, as green urban areas can influence the well-being of people in cities, contributing to friendliness, cooperation and resilience to depression and the stress of city life and providing opportunities for group activities, exercise and leisure (Vecchiato and Tempesta 2013).
Urban forests are highly influenced by land use configurations and social factors (Fan et al., 2019), and in Latin America, the preservation of urban forests in large cities is a challenge (Sartori et al., 2018). Considering the diversity of a city’s components and the dynamic characteristics of its sites, in terms of planning, a city cannot be simply seen as a product of human activity; rather, it must be seen as an everchanging social universe (Silva et al., 2018a).
Among the elements involved in city dynamics, urban forests have been gradually perceived as a key component of good urban environment functioning and as a structural element of a city (Dilek et al., 2008); urban forests are much more than merely an object or living being and are instead a pillar for the dynamics and quality of the urban environment, as they directly interact with the physical, social and natural components.
The concept of urban forests, which is internationally associated with urban afforestation, originated in the United States and Canada in the 1960s, where urban forests are considered components of the urban landscape (Canetti et al., 2018). Several studies have reported on the use of techniques and methods to quantify and identify urban afforestation in cities around the world. More recently, cities such as Guangzhou (China), Lyon (France), Melbourne (Australia), Rotterdam (Netherlands) and Portland (Oregon, USA) (Ordóñez & Duinker, 2013; Ostoić et al., 2018; Wang et al., 2019) have revitalized their public areas through pedestrian-oriented approaches based on actions related to landscaping and urban afforestation in an effort to bring people back to public spaces (Romagosa, 2018); however, the roles of the public and social agents that influence landscape modification, such as the loss of vegetation cover and urban sprawl, have not been discussed in these initiatives.
In contrast to the number of studies on this topic on other continents, such as those mentioned above, studies on integrated planning that aim to understand the controlling factors and the roles played by key actors in urban afforestation are lacking in Latin America in general and particularly in João Pessoa, Brazil. A detailed description of the study area is provided by Ulbricht & Heckendorff (1998), who used a sequence of satellite imagery taken in 1985, 1988 and 1996 to show the changes in land use and occupation during those years.
To analyze the changes in land use and land cover (LULC), remote sensing (RS) and geographic information systems (GIS) have been applied around the world using various time series and orbital products (Shojaei et al., 2017; Silva et al., 2018b; Reba and Seto, 2020). However, most articles presented quantitative information on changes for effective urban planning without analyzing the results from instruments. In addition, the new generation of GIS applications using RS images involves web-based geospatial processing technology on the Internet (Zeng et al., 2020). Currently, new digital imaging technologies enable the production of a large data volume, such as locations and times, which is shared through the Internet (Le Coz et al., 2016). Despite numerous studies that highlighted the merits of online information processed by users on the Internet, new works involving spatial data in urban areas can be emphasized as still being important for effective urban planning (Sharvelle et al., 2017; McGlinn et al., 2019). Additionally, the significant value of data generated on the Internet has not been maximized for urban areas.
Therefore, this paper presents a new combined approach based on multivariate analysis and a GIS approach for LULC change and urban forest loss mapping using web-based processing of free available data. Thus, this study proposes a new urban mapping of João Pessoa based on the Google Earth Engine and a GIS approach, constituting a low-cost practical tool based on municipal geospatial data and GIS analysis (Zurqani et al., 2019, Santos et al., 2021). Thus, the objectives of this study are (1) to identify the LULC changes using Landsat imagery from 1991, 2006, 2010 and 2018; (2) to identify the urban forest loss on an annual scale between 2000 and 2012 using global forest change data; and (3) to analyze the integrated planning instruments designed to mitigate the loss of urban trees. The study area is the county of João Pessoa (Brazil), and the study is expected to contribute to the understanding of the key factors of urban planning instruments for the mitigation of urban forest loss.

2 Materials and methods

The processing of Landsat 5/Thematic Mapper (TM) and Landsat 8/Operational Land Imager (OLI) imagery and global forest change data involves many steps. The general flowchart of the methodology used in this study is given in Figure 1.
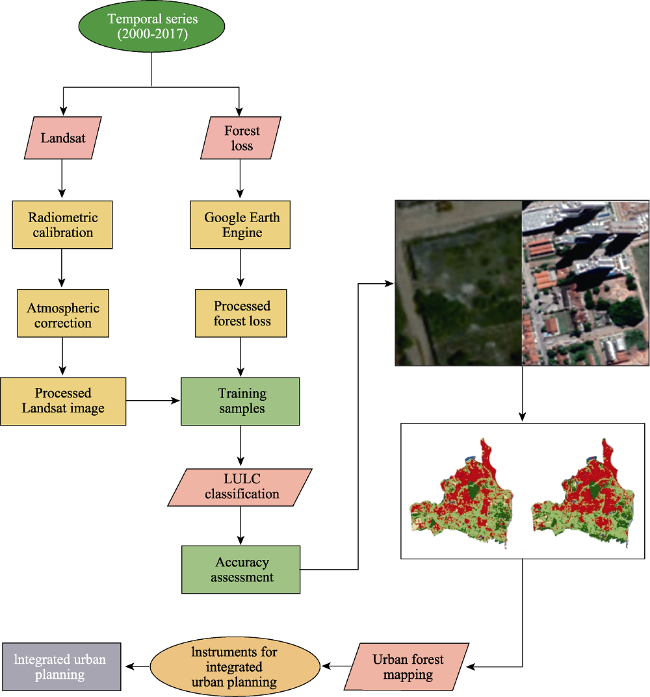
Figure 1 Data processing and classification methodology flowchart

2.1 Study site description

This study was carried out in João Pessoa County on the northeastern coast of Brazil between 7°03°00‒7°15°00S and 34°58°00‒34°47°30W (Figure 2). The study area has a population of approximately 900,000 (IBGE, 2020) and comprises a mosaic of native vegetation, most of which is Atlantic rainforest, sandbank forest and tabuleiro forest (Stevens, 2014).
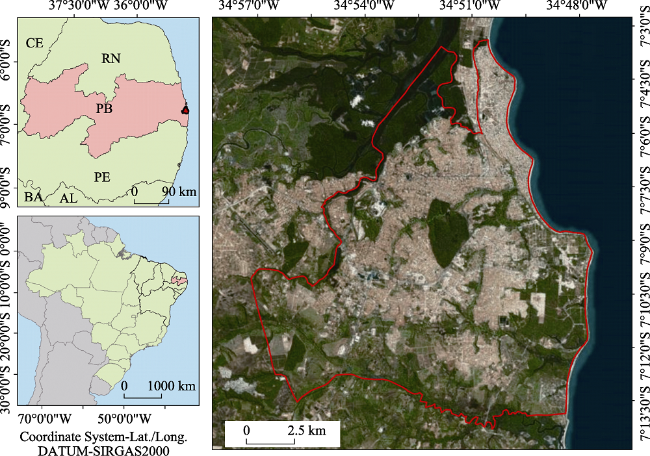
Figure 2 Location of (a) João Pessoa County in (b) Paraíba State, (c) Brazil
According to the Köppen-Geiger classification, the climate is included in the bioclimate 3dTh - northeastern sub-dry regime classification under climate type As, which is described as warm and humid (tropical wet - class A) (Salomão et al., 2019), with a mean annual rainfall of 2,000 mm yr‒1 and a mean temperature of 26°C (SUDEMA, 2018). Most of the rainfall occurs between May and July, with a mean rainfall of 1900 mm yr‒1 (IBGE, 2019). The daily minimum and maximum temperatures are 21°C and 30°C, respectively, and the relative humidity ranges from 73% to 82% (Santos et al., 2019). The county is influenced by humid southeasterly winds (trade winds), as it is located in the easternmost part of Brazil; the rainfall frequency is affected by winds from the east and northeast and the intertropical convergence zone (Souza et al., 2016).

2.2 Image processing and definition of LULC classes

Three scenes from Landsat 5/TM and one scene from Landsat 8/OLI (L8) were acquired from the National Institute for Space Research (Instituto Nacional de Pesquisas Espaciais), available at http://www.dgi.inpe.br. The images were obtained in geotiff format with the universal transverse mercator (UTM) projection and World Geodetic System (WGS) 84 datum. The TM sensor images have seven spectral bands with spatial resolutions from 30 to 120 m. In turn, the OLI sensor images have nine spectral bands with resolutions from 15 to 30 m varying according to the wavelength range. The selected scenes, corresponding to 11/05/1991, 08/26/2006, 10/08/2010 and 09/28/2018, orbit 214 and point 65, were selected because they comprise the greatest time intervals and because there was a lack of clouds over the study site on these dates. Table 1 shows the characteristics of the selected images.
Table 1 Characteristics of the images used in this study
Satellite Dates Sun elevation (°) Sun azimuth (°) Cloud cover (%)
Quadrants
Q1 Q2 Q3 Q4
Landsat 5 11/05/1991 57.2287 107.413 80 40 80 80
Landsat 5 08/26/2006 55.6194 59.2117 70 80 70 70
Landsat 5 10/08/2010 63.2127 88.4564 90 30 80 40
Landsat 8 09/28/2018 62.2825 78.4343 30 40 35 30
Imagery data must undergo radiometric correction to convert each basic dataset to equivalent radiometric units. In this paper, all spectral bands of Landsat 5/TM, excluding those of the thermal infrared region, were radiometrically corrected according to Chander and Markham (2003). This procedure is not necessary for OLI level 2 sensor images. These images already underwent an atmospheric correction process, thus, to calculate reflectance, it was only necessary to use the multiplier factor 0.0001. Then, the images were processed for atmospheric correction using Eq. (1), proposed by Markham and Baker (1987). The objective of the atmospheric correction was to convert remotely sensed digital numbers (DNs) to ground surface reflectance to make the data spectrally comparable.
$L_{\lambda i}=a_{i}+\left(\frac{b_{i}-a_{i}}{255}\right) N D$
where a and b are the minimum and maximum spectral radiances (W m‒2 sr‒1 µm‒1), ND is the pixel intensity, which ranges from 0-255, and i corresponds to spectral bands 1, 2, 3, 4, 5, 6 and 7. The values for the maximum calibration coefficient (b) valid for the images obtained between 1984 and 1991 for bands 1 and 2 correspond to 169 and 333, respectively, as suggested in Chander et al. (2009). For the other images, the coefficients used for bands 1 and 2 were 193 and 365, respectively.
To correct atmospheric effects, the reflectance calculation was performed to eliminate possible interference in the images, allowing quantification of the solar radiation reflected by each pixel. This step helped in the identification of objects in different bands of the spectrum. This step represents the computation of the monochromatic reflectance of each band (ρλi), defined as the ratio between the reflected solar radiation and the incident global solar radiation, which is obtained by:
$\rho_{\lambda i}=\frac{\pi \times L_{\lambda i}}{k_{\lambda i} \times \cos Z \times d_{r}}$
where Lλi is the apparent at-satellite radiance (W m² sr‒1 µm‒1), kλi is the solar spectral irradiance (W m² µm‒1), Z is the solar zenith angle, and dr, which is obtained by Eq. (3), is the square of the ratio of the average Earth-Sun distance ro to the Earth-Sun distance on that Julian day (JD).
dr = 1 + 0.033 × cos(JD × 2π/365)
The images used for LULC classification were obtained from a natural color composite of bands 4, 3 and 2, which are associated with the red, green and blue filters, respectively (4R3G2B). For the OLI sensor images, bands 5, 4 and 3 were used with the same assignment as the filters. The mapping was performed using ArcGIS 10.1® (ESRI, 2010) with the UTM projection system and SAD-69 datum.

2.3 LULC classification and assessment accuracy

The maximum likelihood classification method was applied to map LULC classes. This classifier is a supervised statistical classification approach in which class signatures are assumed to have normal distributions. This method is pixel based and works on the basis of the multivariate probability density function of classes (Ali et al., 2018), where the pixels are assigned to the class that has the maximum likelihood, so it is important to select a significant number of samples in the classification training stage. The maximum likelihood method was used because it provides estimators that have a reasonable intuitive basis and many desirable statistical properties and has been widely used for the study area with good results (Souza et al., 2016; Santos et al., 2019).
In the study site, the following five land use and cover classes were identified: (a) exposed soil: unoccupied area without considering coverage of vacant land; (b) built-up area: area occupied by buildings and their surroundings; (c) arboreal/shrub vegetation: trees with a dense canopy; (d) herbaceous vegetation: grassland and trees with a low canopy density; and (e) water: water bodies. The built-up areas included buildings and other construction types. Validation of the LULC classes was carried out based on an independent collection of points of each LULC class that remained unchanged during the analyzed period. The set of points was determined using samples that were classified by visual interpretation and field checked using field trips. To rigorously assess the accuracy of the LULC classifications, we prepared a multitemporal reference dataset based on a stratified random sampling design (Olofsson et al., 2014; Liu et al., 2018). Thus, 565 training samples were collected at different points as follows: water bodies = 10, exposed soil = 115, shrub vegetation = 157, built-up area = 170, and arboreal/shrub vegetation = 113. The representativeness of these points for the entire classified image represents a good percentage of the study area.
An image segmentation technique using eCogniton 8.0 software was applied for LULC classification, as used by Cunha et al. (2020) and Cunha et al. (2021). This methodology was used to split an image into spectrally homogeneous areas to facilitate the determination of classes and the set of sampling regions. Evaluation of the assessment accuracy of the LULC classification was performed considering the omission, commission, global accuracy, user accuracy, producer accuracy, overall accuracy, and kappa coefficient, as proposed by Cunha et al. (2020). After obtaining the LULC maps, an error matrix was obtained to validate the classification maps using a confusion matrix with omission and commission errors. The use of medium spatial resolution images can considerably increase the incidence of errors in the classification process when applied in urban environments; for this reason, the abovementioned accuracy verification process was vitally important.

2.4 Urban forest loss

To map the urban forest loss on an annual scale, data on the global forest change based on a time-series analysis of Landsat images available in Hansen et al. (2013) were used. Quantification of tree loss has been lacking despite the recognized importance of ecosystem services in urban areas. In this study, Earth observation satellite data, which are also based on Landsat data, were used to map urban forest loss from 2000 to 2012 at a spatial resolution of 30 m. Thus, these data were used to analyze both the LULC changes and forest loss in João Pessoa County. Urban forest loss data were obtained from the Google Earth Engine, and overlay and layout processing were performed in ArcGIS 10.1®. In this study, the following layers were used: (a) forest cover: the tree canopy cover for only the year 2000, defined as the canopy for all vegetation taller than 5 m and encoded as a percentage in the range of 0-100 for each output grid cell; (b) forest loss: defined as a stand-replacement disturbance or the complete removal of tree cover canopy at the Landsat pixel scale; and (c) forest gain: defined as the inverse of loss or the establishment of a tree canopy from a nonforest state. These datasets were divided into 10×10 degree tiles, consisting of seven files per tile. All files contained unsigned 8-bit values and had a spatial resolution of 1 arc-second per pixel or approximately 30 m per pixel at the equator.

2.5 Instruments for integrated urban planning considering urban forests

Urban afforestation is one of many pillars of good city functionality and quality of urban spaces, and urban planning depends entirely on understanding the complex dynamics between vegetation and the other elements of the city. Thus, to study/understand the processes that occur in urban areas that influence tree loss, various instruments should be discussed because they are the basis for the discussion of urban planning and tree loss. Figure 3 shows a scheme that presents all the instruments that control tree loss in urban areas. Therefore, evaluations of urban vegetation using a method that encompasses the many interfaces of such dynamics and the complexity of the topic in a harmonious and integrated fashion are critical. Thus, the analysis proposed in this study consists of deconstructing a multifaceted topic (urban afforestation) into many individual components that relate to urban afforestation, which were identified through an extensive literature review, as well as environmental modeling.
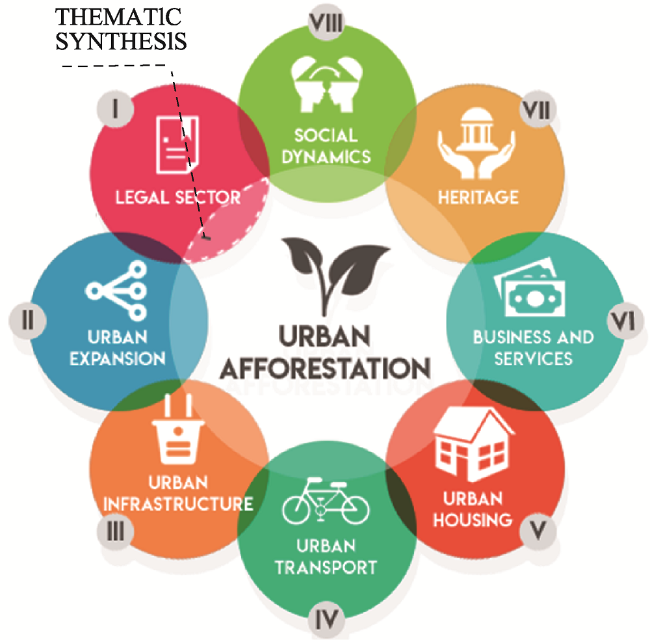
Figure 3 Infographic showing the applied method (thematic and dimensional synthesis)

3 Results

3.1 Classification statistics and accuracy

The classified maps were statistically validated with random validation samples collected from classified images and samples verified in the field. Accuracy statistics for the classification results are shown in Table 2. The classification user’s accuracy for classified orbital imagery ranged between 74% and 90%, the producer’s accuracy ranged from 79% to 86%, the kappa coefficient ranged between 77% and 86%, and the global accuracy was 77%. Table 2 also shows the commission and omission results obtained in this study. In all classified maps, water bodies were classified correctly, and vegetation was classified correctly in many of the areas, while the exposed soil class presented a low accuracy. The results show that the 2018 image had the worst kappa statistics values, but the values were very close for all images used. As previously mentioned, some areas were incorrectly classified due to the spectral confusion caused by the heterogeneity of the surface of urban environments as well as the effects of spatial resolution. However, these results indicate that our urban land classifications in most of the urban area have fairly good agreement with the reference data according to the guidelines suggested by Viera and Garrett (2005) and are better than those obtained by Liu et al. (2018). The confusion matrices for both Landsat images show that most of the misclassification occurs between settlements and exposed soil, while some misclassification also occurs among the vegetation classes. The analysis of the differences between the multitemporal satellite data of the period from 1991 to 2018 helps to understand urban sprawl detection. This analysis is useful in analyzing the various changes occurring in the study area and is similar to that used in Silva et al. (2018) and Souza et al. (2016).
Table 2 Average accuracy obtained for the classifications
LULC User’s accuracy Producer’s accuracy Kappa Commission Omission
%
1991 2006 2010 2018 1991 2006 2010 2018 1991 2006 2010 2018 1991 2006 2010 2018 1991 2006 2010 2018
WB 82 81 80 80 83 81 84 82 83 85 86 85 87 88 88 89 82 84 83 85
ES 72 74 75 76 84 86 85 83 77 79 79 84 87 89 88 90 80 81 80 80
BA 90 91 90 90 83 82 82 82 82 82 82 82 89 88 87 88 83 81 85 85
ASB 85 86 90 89 85 85 86 84 78 79 78 77 87 87 89 89 71 69 72 72
HV 86 87 87 87 82 79 83 82 82 81 82 83 89 87 89 88 80 82 80 79

WB=water bodies, ES=exposed soil, BA=built-up area, ASB=arboreal/shrub vegetation, HV=herbaceous vegetation.

3.2 Recent changes in LULC in João Pessoa

Table 3 shows the areas (km²) and percentages of LULC in João Pessoa for four different years (1991, 2006, 2010 and 2018). Figures 4a-4c show the LULC spatial distribution on these dates. The image from 11/5/1991 (Figure 4a) shows that the ‘built-up area’ and ‘herbaceous vegetation’ categories accounted for the main type of land cover in the study area, while the ‘water bodies’, ‘exposed soil’ and ‘arboreal/shrub vegetation’ categories accounted for small areas on this date. Figure 4b shows the LULC in the 08/26/2006 image. The replacement of exposed soil and herbaceous vegetation by built-up areas is observed, as is a visible shift in the local landscape that represents the growth of built-up areas, mainly in the southeastern region of the city. However, the growth of the urban area observed between 1991 and 2006 was not significant (Figures 4a-4b) despite the long interval between the two images (16 years). Figures 4a-4b show that the built-up areas became denser in 2006. These results reflect a decline in the urban area growth rate between 1991 and 2006 (0.66% per year), which was lower than that between 2006 and 2010. An increase was detected in the arboreal/shrub vegetation class in the 2006 image compared to that in 1991, especially in the south. The 1960s marked the period of urban expansion in the city due to the opening of important avenues in the city (Perez et al., 2020); however, since 1990, the city of João Pessoa experienced its greatest urban growth fostered by private initiative, with the consonance and intervention of public power with the creation of housing estates and urban sprawl (Ribeiro et al., 2020). According to the trends in other Brazilian cities, João Pessoa exhibited rapid linear growth, characterized by planning oriented mainly to the construction of residential areas and vehicles without proper planning and formed by an urban network with discontinuous areas (Maropo et al., 2020). In addition, the development of motorized and private transportation allowed access to more distant locations from the central area, which added to the opening of important avenues in the city, in addition to the crossing of river courses and small tributaries in the city, which enabled the growth of the urban structure to the north and northeast portions (Lira et al., 2017).
Table 3 Area in km² and percentage of LULC in João Pessoa
LULC 1991 2006 2010 2018
km² % km² % km² % km² %
Water bodies 2.6 1.3 2.8 1.4 3.0 1.5 2.0 1
Exposed soil 8.8 4.4 5.3 2.6 7.0 3.5 1.0 0.5
Built-up area 80.1 40.0 82.6 41.3 90.0 45.0 96.0 48
Arboreal/shrub vegetation 24.4 12.2 33.9 16.9 35.0 17.5 50.0 25
Herbaceous vegetation 84.1 42.1 75.4 37.8 65.0 32.5 52.0 26
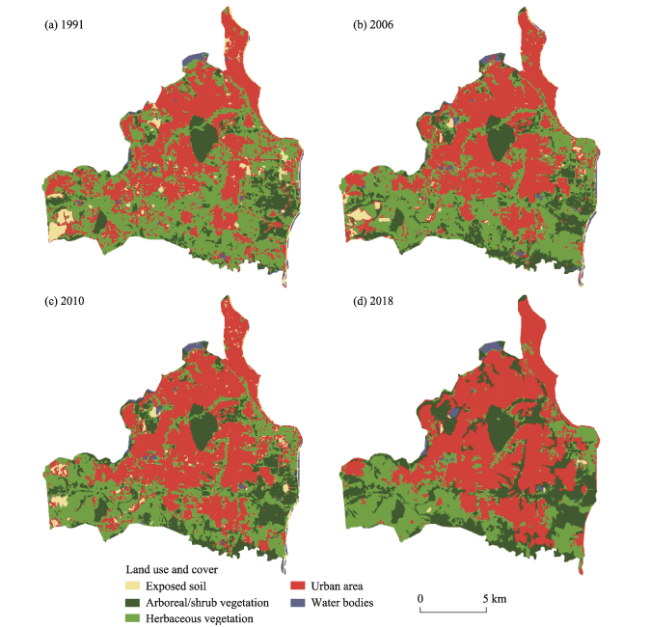
Figure 4 LULC in João Pessoa on (a) 11/5/1991, (b) 8/26/2006, (c) 10/8/2010, and (d) 9/28/2018
Additionally, the concentration of urbanization was greater in the northern, northwestern and western regions than in other regions, presenting the characteristics of sprawl (Souza et al., 2016). Similarly, Santos et al. (2019) reported an urban growth rate of 1.85% per year between 1990 and 2001, which occurred in a sprawled fashion, with intensified occupation of empty spaces in the city and a tendency of growth towards the southern side. The results show that the largest increase in built-up area occurred between 2006 and 2010. According to Sousa et al. (2016), the increase in urban expansion in this period may be related to the increase in the tendency to replace horizontal expansion (houses) with verticalization (high-rise buildings), particularly on the eastern (coast) and southern sides of João Pessoa. The results show that forest losses occurred mainly in the southeastern portion along the littoral coast in João Pessoa County over the last 20 years because this area has the most concentrated economic power (Santos et al., 2019). The region in the south has created a natural area of urban growth. In this context, coastal regions have become areas that have been invaded, on a global scale, by rapidly increasing populations, which is one of the straightforward consequences of economic development (Furrier et al., 2017).
Figure 4c shows the LULC in João Pessoa in 2010, with a continuous expansion of the built-up area in the north, west and central areas of the city at the expense of herbaceous vegetation areas. Despite the small urban growth in these areas, the built-up area in 2010 became denser than that in 1991 and 2006. Currently, these are the only possible areas for expansion in the city. Figure 4d shows the LULC in 2018, where a trend of increasing built-up area and decreasing vegetation was observed. The present spatial configuration indicates a shift from unoccupied areas or areas classified as exposed soil to built-up areas, mainly in the south, east and southeast regions of the city.
The results also show that urban sprawl was more pronounced after 2006, which had severe impacts on the reduction in vegetation cover in the study area. The investigation of the image sequence with regard to vegetation reveals a surprising consistency in vegetation cover loss. The entire area shown here was covered by dense rainforests in the past, while today, only a few isolated areas with urban forests remain, as shown in the results of this study. As noted by Lima et al. (2017), an increase in the pressure to occupy urban forests (environmental preservation zones) can be highlighted. Areas with a high urban density can also be seen as a result of the displacement of the population to the suburbs of the city. Thus, to avoid the loss of green areas, the city of João Pessoa must invest in public policies to protect these areas while maintaining the existing environmental quality.

3.3 Urban forest loss in João Pessoa

Based on recent changes in LULC, the present study provides an understanding of urban growth and its effects on forest loss in João Pessoa using urban forest loss data. Figure 5 shows the total urban forest cover loss within João Pessoa County between 2001 and 2018. The results also show that 2008 and 2010 presented the highest losses (0.88 km² and 0.57 km², respectively). From 2013 to 2015, forest loss declined; however, from 2016 onwards, forest loss increased in João Pessoa until 2018, when it began to decrease again. This study revealed that the great forest loss was due to the expansion of urban areas and significant changes in land cover with the construction of housing and horizontal residential condominiums (Lima, 2020). The population of João Pessoa has more than doubled within the last 30 years (1988-2018) according to IBGE (2020). Urban areas experienced similar increases during the same period, i.e., a rapid increase in population, and urban growth has increased the pressure on the natural environment (Pereira et al., 2019). These results have a direct correlation with the decrease in forest loss in João Pessoa. The urban forest loss was high between 2007 and 2008, and forest area losses were still identified in the region, even though the results showed a slight decrease after 2010. This continuous loss of forest areas led to the fragmentation of forest areas in João Pessoa. This fragmentation increased between 2001 and 2018, with only 12% of the original area remaining (Dantas et al., 2017). These remaining forest fragments do not have the minimum area required for the survival of animal species (Feng et al., 2020; Borges et al., 2020) and have an important role in the thermal comfort and overall life of local populations (Marçal et al., 2019). The results are consistent with those of previous LULC studies on the effects of the quantity and structure of green areas on thermal comfort and air quality in urban-like residential district modeling developed by Rui et al. (2019) and Pyles et al. (2020), who analyzed the functional diversity and stability of remnant urban forests in highly degraded and fragmented landscapes for 12 Atlantic Forest fragments in Brazil. Habitat fragmentation has direct effects on ecological relationships and the local microclimate. In João Pessoa city and other cities, this phenomenon can be caused by natural causes; however, in recent decades, the fragmentation of anthropogenic origin has been the most influential in the transformation of the landscape (Silva et al., 2015; Donegan et al., 2019).
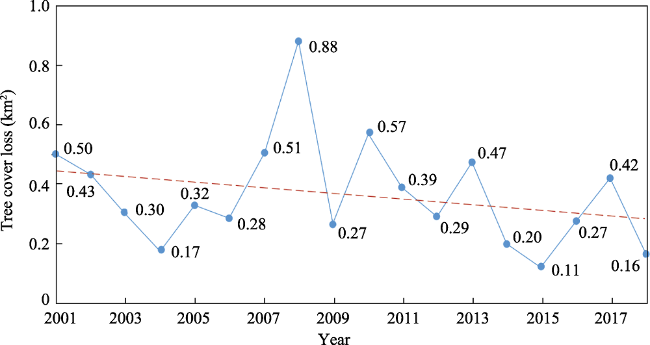
Figure 5 Forest cover loss in João Pessoa (2001-2018)
Figure 6 shows the spatial distribution of accumulated tree cover loss in João Pessoa from 2001 to 2018, and Figure 7 illustrates the spatial distribution of the total gain, gain-loss and loss in 2012. The forest cover gain and loss from 2000 to 2012 were computed using the temporal series of Hansen et al. (2013) with the forest gain layer, which provides images with bands representing gain and loss. Then, the process for calculating the area is simply to calculate the pixel area and add the pixels where there is loss or gain. Fire and built-up area growth are the most significant causes of forest loss in urban areas and occur across a range of tree canopy densities. Currently, the logic of urban space production in João Pessoa is guided by the logic of the real estate market, which directs the growth of the urban structure towards the southern part of the city. According to Perez et al. (2020), Atlantic Forest fragments are systematically suppressed by the municipal and state governments to allocate mainly tourist enterprises and vertical residential real estate products, with low-income products in the south-southwest portion and high-income products in the south-southeast portion in João Pessoa city.
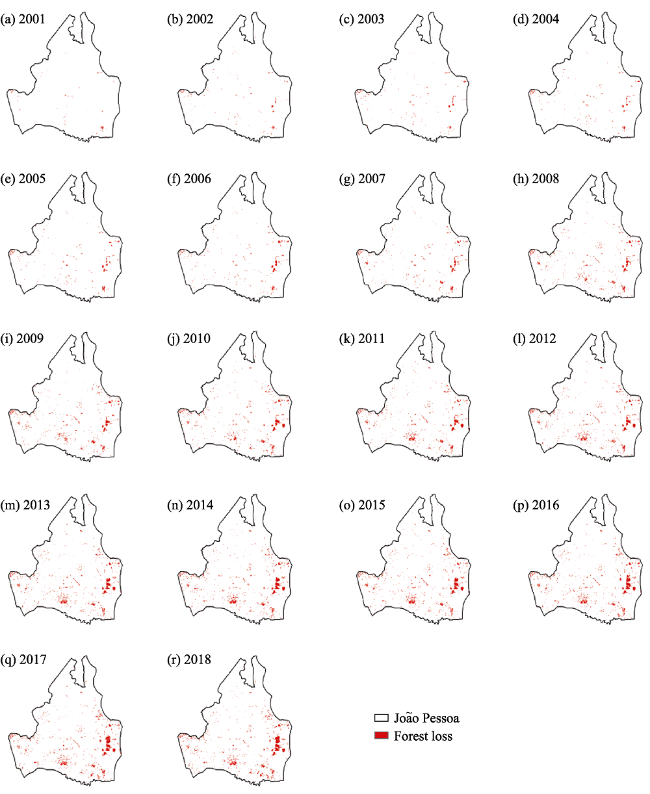
Figure 6 Accumulated tree cover loss maps (2001-2018) for João Pessoa city
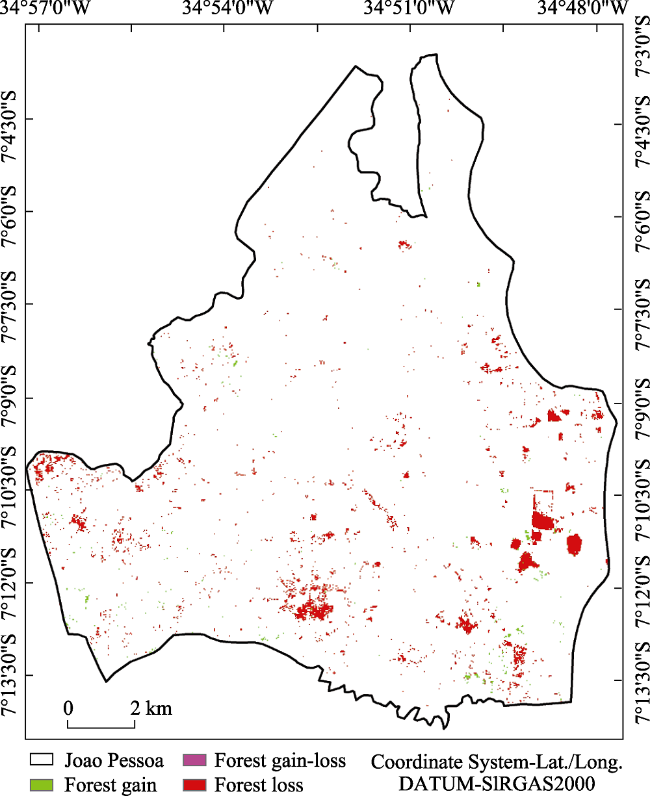
Figure 7 Total loss, gain, and gain-loss of tree cover between 2000 and 2012

3.4 Instruments for integrated urban planning considering urban forests

This study identifies and analyzes integrated planning tools aimed at finding solutions to the problem of urban afforestation loss. For this purpose, (a) thematic syntheses; (b) individualized analyses in which afforestation is opposed to several other urban themes; and (c) dimensional synthesis, which condenses the identified problems in urban areas, were carried out. Thus, based on a literature review, a thematic synthesis in terms of analytical schematics showing, on the one hand, scenarios and conflicts and, on the other hand, potential solutions are presented for the following themes: (a) Theme I - Legal sector, responsibility and nature, (b) Theme II - Urban expansion process, and (c) Theme III - Elements of urban infrastructure.

3.4.1 Legal sector, responsibility and nature

As summarized in Figure 8, in a legal context, conflicts, including the transfer of responsibility (C2) defined in legal terms and fundamentally conflicting regulations (C1), and potential solutions for such conflicts, including the uniformization of legal terms (S1), the transformation of the entire process into a collaborative effort of maintenance and conservation and the clarification of the attributions and competencies (S2) of each involved party, are exposed. Thus, the public administration is responsible for the execution of what is essentially its responsibility, and civil society is responsible for continuous preservation on a day-to-day basis. Through this collaborative effort, a well-functioning urban setting will be achieved through continuous care from the civil sphere and planning and quality control from the government.
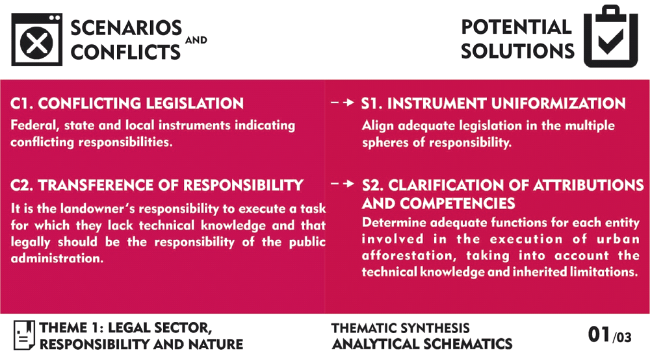
Figure 8 Analytical summary of thematic synthesis: Theme I - Legal sector, responsibility and nature (scenarios and conflicts vs. potential solutions)

3.4.2 Urban expansion process

The urban forest benefits do not depend on an isolated and well-delimited configuration in a city space but come from the essence of the integration of these areas within the urban dynamics, which requires an analysis of each location and methods that are not based solely on quantification but also include an interdisciplinary, complex and integrated approach to the urban context.
In summary, as depicted in Figure 9, the analysis from the urban expansion and occupation dynamics perspective reflects the following important points for understanding the issue of urban afforestation: the mismatch (C2) between the applied method (quantitative analysis) and the resulting data (quantitative data that are interpreted as the quality of the vegetated area) and the interpretation (C1) conferred upon this afforestation, that is, of isolated urban vegetation without direct integration with the local reality, which responds to an imposed need to preserve it. In other words, afforestation becomes obsolete when not subjected to market logic and everyday use and is seen as an environmental barrier to the development and expansion of cities.
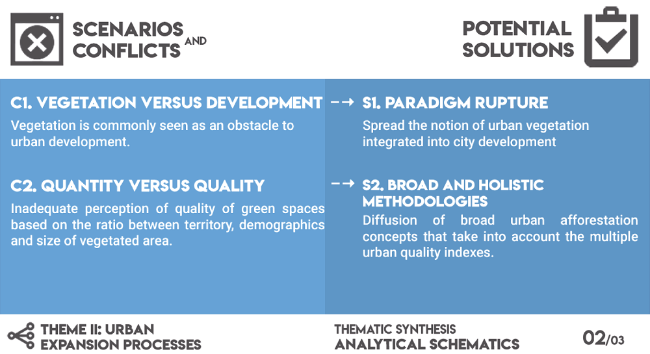
Figure 9 Analytical summary of thematic synthesis: Theme II - Urban expansion process (scenarios and conflicts vs. potential solutions)
Similarly, this scenario shows the paths through which these notions can be corrected, i.e., through the rupture of paradigms (S1) about development and the natural environment through the dissemination of broad, holistic methods and concepts (S2) that value urban vegetation as more than just an area occupied by groups of plants. Rather, the paradigm must focus on these areas as a resource that is needed in urban settings, beyond real estate market rules. Thus, expansion and development can be ensured, not with a clash between the natural environment and the agents that seek city expansion but through the progress achieved in harmony with and with respect to the process of urban dynamics.

3.4.3 Elements of urban infrastructure

Figure 10 shows the thematic synthesis framework for the analysis of urban infrastructure and urban forests. As depicted in Figure 10, the interface between vegetation and urban infrastructure exposes issues pertaining to urban planning as follows: the possibility of damage to urban structures by vegetation (C1) and to the vegetation itself (C2) due to extensive trimming and other containment procedures. However, damage does not occur because the space is inadequate for afforestation but because the vegetation selected is unsuitable for the specific urban space. The resolution of such a conflict, including the increased cost of repair and the maintenance of damaged structures and trees, does not depend on the adaptation of a given species to the infrastructure but on the correct selection (S1) of species that are truly suitable for a given urban context.
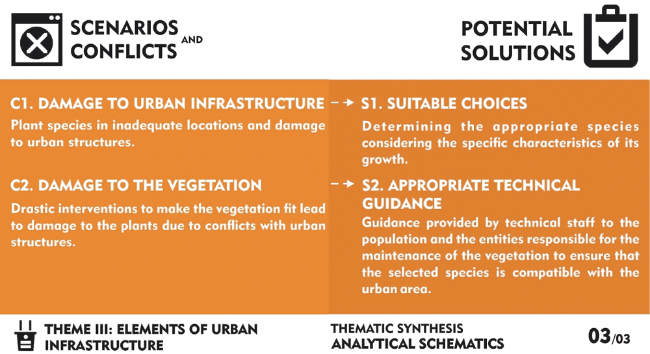
Figure 10 Analytical summary of thematic synthesis: Theme III - Elements of urban infrastructure (scenarios and conflicts vs. potential solutions)
Thus, in addition to considerations of esthetics, the speed of growth and the extent of shading, factors such as root and canopy growth patterns, the size and type of leaves and flowers and climate requirements must be considered to determine suitable species. Beyond environmental characteristics, the presence of urban day-to-day elements, particularly those pertaining to urban infrastructure, also directly affects species development. Even though vegetation improves the quality of life for the community, elements such as sidewalk pavement, road surfaces, electricity towers, drainage and sewage lines, and other urban structures can be obstacles for vegetation and lead to damage to the plants as they develop, whether aboveground structures that can be damaged via interactions with the canopy or belowground structures that can be damaged through root growth and expansion.
Among the listed problems, the deterioration of road surfaces and drainage and sewage lines due to root overgrowth; damage to the electrical system due to growing branches; and the impact, odor and debris from flowers and fruits are highlighted. As a means of constraining or resolving these conflicts, drastic procedures are used to contain the growth of trees, such as scraping and cutting of roots and radical trimming of canopies and even trunks.
Even if conflicts are mitigated a priori, such interventions significantly affect the plant’s metabolism, constraining its growth, reproduction and nutrient absorption or even preventing its existence. Consequently, the urban environment suffers from a decrease in the benefits of vegetation, particularly those pertaining to pedestrians.

4 Discussion

4.1 LULC change and urban forest loss

In this study, a set of training samples was used for supervised maximum likelihood classification of Landsat images, and the classification results were analyzed to study LULC changes in João Pessoa County between 1991 and 2018. The main changes in landscape characteristics between 1991 and 2018 were increases in herbaceous vegetation (+13%) and built-up areas (+8%), while the greatest loss was in arboreal/shrub vegetation (-17%). The results showed that the net decrease in forested area in João Pessoa County corresponded to approximately 6.4 km² between 1991 and 2018. Thus, an increase in the pressure to occupy zones intended for environmental preservation can be estimated. The findings of this review showed that the amount of scientific literature related to remote sensing-assisted analysis of urban forest loss has been increasing rapidly since 2000 (Shahtahmassebi et al., 2021). High resolutions, such as ~30 m, for LULC characterization and monitoring enables the recognition of LULC change at the scale of most human activities and offers increased flexibility of environmental model parameterization needed for global change studies. The results of this study indicated the feasibility and reliability of urban forest loss and LULC mapping based on GEE applications with acceptable accuracies of the resultant products. The results obtained in this study are similar to those obtained by Patel et al. (2015), who reported a method to detect urban extents and multitemporal settlement population mapping from Landsat using the GEE. In addition, Liu et al. (2018) analyzed the use of the GEE platform for high-resolution multitemporal mapping of global urban land using Landsat images, and the resulting global urban land has an overall accuracy of 0.81-0.84. Liu et al. (2020) analyzed annual large-scale urban land mapping based on Landsat time series in the GEE and OpenStreetMap data for the Yangtze River Basin. Baines et al. (2020) used the GEE platform to quantify the urban forest structure with open-access RS datasets. Our results indicate that urban forest structure can be modeled accurately from RS datasets, and maps that have uses beyond the scope of urban forest inventories can be produced. Moreover, this approach can be relatively easily and inexpensively adopted by city planners, urban forest managers and greenspace advocates to ensure the future prosperity of urban forests globally.

4.2 Analysis of urban forest planning instruments: social and urban dynamics

Taking the aforementioned reasons into account, urban vegetation is incorporated into discussions about public spaces beyond the landscape and esthetic aspects as a means of ensuring the use of these spaces by the populations attracted to the benefits and emotions that green areas provide. However, green urban spaces have not consistently been included in public area planning. Public spaces have been defined as artificial systems with purposes that are disconnected from the place and people (Benchimol et al., 2017). In João Pessoa, this configuration has become more important in urban areas due to tree cover loss and an increase in built-up areas without proper urban planning. The complex nature of the relationships between vegetation and urban areas is demonstrated above. These analyses show that urban vegetation influences not only the environmental component but also several other aspects of urban life, confirming the premise of this study. Thus, selecting an integrated and multifaceted approach to better understand the extent of such a complex issue is critical. The aforementioned conflicts indicate issues related to not only the planning policies and practices adopted in environmental projects but also the urban afforestation concept itself. Thus, the considerations regarding the selection of appropriate instruments must be based on theoretical and practical aspects to ensure a complete resolution of urban afforestation issues.

4.3 Analysis of urban forest planning instruments

Thus, having managers who will consider these plant traits and technical guidance (S2) from knowledgeable staff about these traits is the only way to ensure that vegetation will benefit the community without causing damage (Franco and Macdonald, 2017). As noted by Muñoz (1985) and Belmeziti et al. (2017), to ensure the appropriate development of a species, its biological (texture, fertility, nutrients, and soil type) and climate (temperature, light, solar incidence, and relative humidity) requirements must be met, which directly affect the species’ growth dynamics, morphology, types of roots and leaves, and symbiotic relationships with the ecosystem.
As vegetation expands out of its designated spaces, such as squares, parks and public gardens, and more intensely and broadly integrates into urban areas, including circulation areas, transitional areas or buildings, its interaction with the social and physical elements in the space appears or intensifies. In this regard, the interface between the vegetation and the structures and aspects of the urban infrastructure is one of the main practical dilemmas in the planning of urban afforestation. As noted in the study, the interface between vegetation and urban infrastructure exposes a pressing issue in urban planning: the possibility of damage to the urban environment by the plant species (C1) and to the plant species itself (C2) through drastic pruning or other harmful containment procedures. However, this damage arises not because the space is inadequate for receiving vegetation but because of the inadequacy of the plant species for the specific urban context in which it was planted. Therefore, the resolution to conflicts and constant repair and maintenance costs does not depend on the adaptation of the natural characteristics of the species to the infrastructure but on the conscious selection (S1) of plant species truly adequate for the urban context.
In addition, the root and crown growth pattern, size, type of foliage, flowering characteristics, climatic suitability and other innate characteristics must be considered when determining the species to be planted, as these characteristics are much more important than just the esthetics, growth time and shading provided. In view of this, there is a clear need for managers who respect these characteristics, as well as for the technical assistance (S2) of those who truly have knowledge of these particularities, because only then will the benefits of vegetation be guaranteed to the whole society without, for example, damage to the very nature of the plant species being necessary.
Considering the scenarios discussed above, this study identified the primary roles of the parties responsible for the instrumentalization of environmental management of urban areas as follows: (I) technicians and professionals working in the urban field with technical knowledge who are responsible for the design of urban intervention projects; (II) managers responsible for designing, monitoring and executing urban policies; and (III) civil society, whose members directly coexist with green urban spaces in both private and public spaces. The integrated actions of these parties require the selection of practical management instruments that directly impact these areas to mitigate environmental quality issues in urban areas through an urban afforestation policy that integrates all the issues associated with the actors involved in maintaining/increasing urban afforestation in João Pessoa. Thus, the considerations regarding resources and management initiatives for each of the following aspects will be presented next: (a) technical resources available to city planning staff; (b) political-administrative resources available to urban policy managers; and (c) educational and civil resources for the community, which play a fundamental role in the urban space depending on the development of local urban afforestation concepts and the discussion of practical measures on the theme.
From the technical aspect, an emphasis on vegetation as an urban element that deserves attention (whether existing or to be implemented) must predominate since vegetation ensures the maintenance of the local identity of a place and the efficacy of solutions and urban space use. Additionally, vegetation must be understood as part of the urban infrastructure, including the history and space appropriations that are compatible with a given space, through a detailed planning process (Deng et al., 2017). Urban forests are a component that ensures the quality of a space regarding both the architectural aspects, which affect the living, circulation and cohabitation characteristics of each type of space, and the urban aspects, which halt the disorganized occupation and expansion dynamics imposed by the real estate market through green belts, corridors and reserve areas (Jones and McDermott et al., 2018). Thus, vegetation represents city life in public spaces, either in large neighborhood squares and parks or in small or residual green spaces such as pocket parks (NYCDPR, 2010). The preservation of urban forests requires the effective participation of the population in the decision-making process and incentivization of its inclusion by the responsible planning entities.
Administrative strategies used in other parts of the country should be applied to engage the community in environmental preservation, such as fiscal incentives and tax breaks, as described in the Green Credit program created by the municipal government of the city of Curitiba and regulated by the city’s Forestry Code (law n. 9806 of July 4, 1994) (João Pessoa, 1995). This initiative grants property tax breaks for urban properties associated with the percentage of green area within a given property, ensuring that vegetation is maintained not only in general urban areas but also in private lots. Additionally, indices, methods and concepts to evaluate green spaces should be defined and enforced, and requirements for urban projects should be inserted into the local legislation, such as minimal qualifications for approval, to legally ensure the implementation of strategic instruments and the consolidation of integrated urban improvements guided by sustainability principles. One example of such an implementation is the Better Streets project, a plan for the city of San Francisco, USA, which was proposed in 2011 (San Francisco, 2014).
Through public enforcement, the function of the state is ensured beyond the institutionalization of guidelines; additionally, the primary maintenance of the communities’ well-being, including environmental and urban afforestation standards, is also ensured. It is essential for civil society to understand vegetation as an integrated element of daily city life, whose presence directly affects the daily flow of activities and the use of space. A collective effort is needed to achieve the purpose of preservation since environmental settings are a reflection of socioeconomic and spatial structures in urban areas (Gerrish & Watkins, 2018). In practice, the consolidation of this concept requires conscientious efforts regarding environmental education, which can be achieved by civil organizations with social movements and nonprofit organizations in partnership with planning and preservation entities through campaigns, booklets and theoretical and practical activities, such as lectures, tree plantings and the recovery of degraded ecosystems. These activities can be developed in collaboration with teaching institutions from elementary schools to universities, all including raising awareness of vegetation preservation in urban areas.
In many discussions, urban environmental education can be highlighted as a possible solution for the challenge of establishing a harmonious relationship among the city, society and nature, seeking the construction of a city from a socioenvironmental perspective (Hutcheson et al., 2018). This strategy is particularly successful when focused on a young audience, as reported by psychology and education studies (Mages, 2018), which show that an early introduction to such concepts implies that in the near future, these children will be able to spread these concepts and become conscientious adults who are able to seek methods and choose lifestyles that ensure the sustainability of their homes and cities, influencing the decision-making process of businesses and the societies where they belong (Garcia et al., 2018). By valuing urban vegetation and the active participation of society in its maintenance, a city that is inclusive of a variety of individuals and thus allows for plentiful and harmonious human coexistence with the natural environment will be created.

5 Conclusions

This study identified and analyzed integrated planning instruments designed to mitigate the loss of urban forests in João Pessoa (Brazil) between 1991 and 2018. The main changes in the landscape were losses in the arboreal/shrub vegetation class (-17%) and increases in the herbaceous vegetation (+13%) and built-up area (+8%) classes. This study also provides an overview of urban afforestation, including the challenges and complexity of the topic and of urban issues in general, traces several paths for thinking and explores ways of resolving the current conflicts. In the first step of this analysis, the thematic synthesis procedure was efficient in exposing the interfaces between vegetation and several areas of the urban environment, indicating that the problems that exist in urban afforestation practices do not stem exclusively from environmental issues but also have socioeconomic roots.
Additionally, the identified scenarios reveal that the issues do not reside solely in the design and implementation of planning policies but have a much deeper core, that is, the understanding of what urban afforestation is and what it represents in the urban context. As an example, the coastal city of João Pessoa, in Latin America, is known for its large number of green spaces and the good relationship between the community and urban afforestation. However, in recent years, the city has experienced significant urban tree cover loss due mainly to the lack of understanding of the issues of responsibility and suitability, as reported and discussed in this study. The second step in this approach sought to define instruments and actions, both theoretical and practical, to resolve these conflicts, aiming for harmonious and sustainable urban development through a collaborative process among the planning staff, public managers and civil society.
In summary, urban forests provide invaluable benefits to the urban environment, and thus, extensive studies are required, as is the selection of holistic planning methodologies. Only through this approach will the issue be addressed as a whole, and the participation and inclusion of key actors be combined into a single objective, i.e., to ensure urban quality through a harmonious environment for all those who comprise a city. The analysis of urban and environmental planning instruments showed urban forests to be a pillar of good city functionality and urban space quality. This study showed that urban planning depends entirely on understanding the dynamics between natural vegetation and the socioeconomic activities that occur in the city.
This study was also financed in part by the Brazilian Agency for the Improvement of Higher Education (Coordenação de Aperfeiçoamento de Pessoal de Nível Superior ‒ CAPES) - Fund Code 001, the National Council for Scientific and Technological Development, Brazil - CNPq (Grant Nos.304213/2017-9 and 304540/2017-0), and the Federal University of Paraíba.

6 Acknowledgments

[1]
Ali M Z, Qazi W, Aslam N, 2018. A comparative study of ALOS-2 PALSAR and landsat-8 imagery for land cover classification using maximum likelihood classifier. The Egyptian Journal of Remote Sensing and Space Sciences, 21: S29-S35. https://doi.org/10.1016/j.ejrs.2018.03.003

[2]
Allen R G, Tasumi M, Trezza R, 2002. SEBAL (Surface Energy Balance Algorithms for Land) - Advanced Training and User Manual - Idaho Implementation, version 1.0

[3]
Baines O, Wilkes P,Mathias Disney M, 2020. Quantifying urban forest structure with open-access remote sensing data sets. Urban Forestry & Urban Greening, 50: 126653. https://doi.org/10.1016/j.ufug.2020.126653

[4]
Belmeziti A, Cherqui F, Bernard Kaufmann B, 2018. Improving the multi-functionality of urban green spaces: Relations between components of green spaces and urban services. Sustainable Cities and Society, 43(1): 1-10. https://doi.org/10.1016/j.scs.2018.07.014

DOI

[5]
Benchimol J F, Lamano-Ferreira A P N, Lamano-Ferreira M et al., 2017. Decentralized management of public squares in the city of São Paulo, Brazil: Implications for urban green spaces. Land Use Policy, 63: 418-427. https://doi.org/10.1016/j.landusepol.2017.02.004.

DOI

[6]
Borges E R, Dexter K G, Bueno M L et al., 2020. The evolutionary diversity of urban forests depends on their land-use history. Urban Ecosystems, 23: 631-643. https://doi.org/10.1007/s11252-020-00938-y.

DOI

[7]
Brasil. Lei nº 9.503, de 23 de setembro de 1997. Código de Trânsito do Brasil. 1997.

[8]
Chander G, Markham B, 2003. Revised Landsat-5 TM radiometric calibration procedures and postcalibration dynamic ranges. IEEE Trans. Geosci.Remote Sens., 41(11): 2674-2677. https://doi.org/10.1109/TGRS.2003.818464.

[9]
Chander G, Markham B L, Helder D L, 2009. Summary of current radiometric calibration coefficients for Landsat MSS, TM, ETM+, and EO-1 ALI sensors. Remote Sensing of Environment, 113: 893-903. https://doi.org/10. 1016/j.rse.2009.01.007.

DOI

[10]
Cunha E R, Santos C A G, Silva R M et al., 2021. Future scenarios based on a CA-Markov land use and land cover simulation model for a tropical humid basin in the Cerrado/Atlantic forest ecotone of Brazil. Land Use Policy, 101: 105141. http://dx.doi.org/10.1016/j.landusepol.2020.105141.

DOI

[11]
Cunha E R, Santos C A G, Silva R M et al., 2020. Mapping LULC types in the Cerrado-Atlantic Forest ecotone region using a Landsat time series and object-based image approach: A case study of the Prata River Basin, Mato Grosso do Sul, Brazil. Environmental Monitoring and Assessment, 192: 547-567. http://dx.doi.org/10. 1007/s10661-020-8093-9.

DOI

[12]
Dantas M S, Almeida N V, Medeiros I S et al., 2017. Vegetation diagnosis of remaining Atlantic Forest and associated ecosystems in urban spaces. Journal of Environmental Analysis and Progress, 2(1): 87-97. http://dx.doi.org/10.24221/jeap.2.1.2017.1128.87-97.

DOI

[13]
Deng J, Andrada II R, Pierskalla C, 2017. Visitors’ and residents’ perceptions of urban forests for leisure in Washington D.C. Urban Forestry & Urban Greening, 28(1): 1-11. https://doi.org/10.1016/j.ufug.2017.09.007.

[14]
Dilek E F, Şahin S, Yılmazer I, 2008. Afforestation areas defined by GIS in Gölbaşı specially protected area Ankara/Turkey. Environmental Monitoring and Assessment, 144(1-3): 251-259. https://doi.org/10.1007/s10661- 007-9985-7.

DOI

[15]
ESRI - Environmental Systems Research Institute Inc. ArcGIS Desktop 10.1. New York, 2010. 1 CD-ROM.

[16]
Fan C, Johnston M, Darling L et al., 2019. Land use and socio-economic determinants of urban forest structure and diversity. Landscape and Urban Planning, 181: 10-21. https://doi.org/10.1016/j.landurbplan.2018.09.012.

DOI

[17]
Feng L, Zhao M, Zhou Y et al., 2020. The seasonal and annual impacts of landscape patterns on the urban thermal comfort using Landsat. Ecological Indicators, 110: 105798. https://doi.org/10.1016/j.ecolind.2019.105798.

DOI

[18]
Franco S F, Macdonald J L, 2017. Measurement and valuation of urban greenness: Remote sensing and hedonic applications to Lisbon, Portugal. Regional Science and Urban Economics, 73. https://doi.org/10.1016/j.regsciurbeco.2017.03.002.

[19]
Furrier M, Souza A S, de Lavour L F 2017. Environmental analysis and legal bases for coastal area evaluation: The Seixas beach sample-PB. Journal of Urban and Environmental Engineering, 11(2): 226-234. https://doi.org/10.4090/juee.2017.v11n2.226234.

[20]
Gerrish E, Watkins S L, 2018. The relationship between urban forests and income: A meta-analysis. Landscape and Urban Planning, 170: 293-308. https://doi.org/10.1016/j.landurbplan.2017.09.005.

DOI PMID

[21]
Hansen M C, Potapov P V, Moore R et al., 2013. High-resolution global maps of 21st-century forest cover change. Science, 342(6160): 850-853. https://doi.org/10.1126/science.1244693.

DOI PMID

[22]
Hutcheson W, Hoagland P, Jin D, 2018. Valuing environmental education as a cultural ecosystem service at Hudson River Park. Ecosystem Services, 31: Part C, 387-394. https://doi.org/10.1016/j.ecoser.2018.03.005

DOI

[23]
IBGE-Instituto Brasileiro de Geografia e Estatística (2019). Geociências. Available in:https://downloads.ibge.gov.br/downloads_geociencias.htm. Accessed 10 January 2020.

[24]
IBGE - Instituto Brasileiro de Geografia e Estatística, 2020. Estimates of the resident population in Brazilian municipalities in 2018. Available in: ftp.ibge.gov.br/Estimativas_de_Populacao/Estimativas_2017/estimativa_tcu_2017_20180207.pdf. Accessed 14 January 2020.

[25]
João Pessoa, 1995. Lei complementar nº 7, de agosto de 1995. Institui o código de posturas do Município de João Pessoa.

[26]
Jones B A, McDermott S M, 2018. The economics of urban afforestation: Insights from an integrated bioeconomic-health model. Journal of Environmental Economics and Management, 89: 116-135. https://doi.org/10.1016/j.jeem.2018.03.007.

DOI

[27]
Le Coz J, Patalano A, Collins D et al., 2016. Crowdsourced data for flood hydrology: Feedback from recent citizen science projects in Argentina, France and New Zealand. Journal of Hydrology, 541: 766-777. https://doi.org/10.1016/j.jhydrol.2016.07.036.

DOI

[28]
Lima M A S, 2020. Estudo comparativo em habitação de interesse social: O caso do Conjunto Habitacional Gervásio Maia (CHGM) - João Pessoa. Arquitextos, 10: 112.02. Available in:

[29]
Lima P P S, Pinho B R, Rodrigues E et al., 2017. Análise do uso do solo em João Pessoa-PB e as zonas de restrição de ocupação previstas no plano diretor. Proceedings of the XXVII Congresso Brasileiro de Cartografia, November 2017, Rio de Janeiro, 1532-1536.

[30]
Lira A H C, Silveira J A R, Ribeiro E L et al., 2020. Avaliação da qualidade de vida urbana nos condomínios horizontais da cidade de João Pessoa, PB. Ambiente Construído, 17: 285-304. http://dx.doi.org/10.1590/s1678-86212017000400198.

DOI

[31]
Liu D, Chen N, Zhang X et al., 2020. Annual large-scale urban land mapping based on Landsat time series in Google Earth Engine and OpenStreetMap data: A case study in the middle Yangtze River basin. ISPRS Journal of Photogrammetry and Remote Sensing, 159: 337-351. https://doi.org/10.1016/j.isprsjprs.2019.11.021.

DOI

[32]
Liu X, Hu G, Chen Y et al., 2018. High-resolution multi-temporal mapping of global urban land using Landsat images based on the Google Earth Engine Platform. Remote Sensing of Environment, 209: 227-239. https://doi.org/10.1016/j.rse.2018.02.055.

DOI

[33]
Mages W K, 2018. Does theatre-in-education promote early childhood development? The effect of drama on language, perspective-taking, and imagination. Early Childhood Research Quarterly, 45: 224-237. https://doi.org/10.1016/j.ecresq.2017.12.006.

DOI

[34]
Marçal N A, Silva R M, Santos C A G et al., 2019. Analysis of the environmental thermal comfort conditions in public squares in the semiarid region of northeastern Brazil. Building and Environment, 152: 145-159. https://doi.org/10.1016/j.buildenv.2019.02.016.

DOI

[35]
Markham B L, Barker J L, 1987. Thematic mapper band pass solar exoatmospherical irradiances. International Journal of Remote Sensing, 8(3): 517-523. https://doi.org/10.1080/01431168708948658.

DOI

[36]
Maropo V L B, Silveira J A R, Negrao A G et al., 2020. Mobilidade nos centros urbanos: estudo para implantar ruas completas no centro de João Pessoa, Paraíba, Brasil. Urbe. Revista Brasileira de Gestão Urbana, 12: 1-28. http://dx.doi.org/10.1590/2175-3369.012.e20190145.

[37]
McGlinn K, Wagner A, Pauwels P et al., 2019. Interlinking geospatial and building geometry with existing and developing standards on the web. Automation in Construction, 103: 235-250. https://doi.org/10.1016/j.autcon.2018.12.026.

DOI

[38]
Muñoz J A, 1985. Los efectos del urbanismo sobre el desarrolo de los árboles. Revista Biocenosis, 2(2): 11-14.

[39]
New York City Department of Parks & Recreation NYCDPR, 2010. High performance landscape guidelines. New York, 273p.

[40]
Olofsson P, Foody G M, Herold M et al., 2014. Good practices for estimating area and assessing accuracy of land change. Remote Sensing of Environment, 148: 42-57. https://doi.org/10.1016/j.rse.2014.02.015.

DOI

[41]
Ordóñez C, Duinker P N, 2013. An analysis of urban forest management plans in Canada: Implications for urban forest management. Landscape and Urban Planning, 116: 36-47. https://doi.org/10.1016/j.landurbplan.2013.04.007.

DOI

[42]
Ostoić S K, Salbitano F, Borelli S et al., 2018. Urban forest research in the Mediterranean: A systematic review. Urban Forestry & Urban Greening, 31: 185-196. https://doi.org/10.1016/j.ufug.2018.03.005.

[43]
Patel N N, Angiuli E, Gamba P et al., 2015. Multitemporal settlement and population mapping from Landsat using Google Earth Engine. International Journal of Applied Earth Observation and Geoinformation, 35, Part B, 199-208. https://doi.org/10.1016/j.jag.2014.09.005.

DOI

[44]
Pereira L S, de Carvalho D M, da Cunha L S 2019. Methodology for the semi-quantitative evaluation of geoheritage applied to coastal geotourism in João Pessoa (Paraíba, Northest Brazil). Geoheritage, 11: 1941-1953. https://doi.org/10.1007/s12371-019-00417-7.

DOI

[45]
Perez L P, Sales A L P, Silveira J A R, 2020. Climate change and the unsustainable urbanism in the municipality of João Pessoa, PB, Brazil. Sustainability in Debate, 11(2): 304-321. http://dx.doi.org/10.18472/SustDeb.v11n2.2020.32330.

[46]
Pyles M V, Magnago L F S, Borges E V et al., 2020. Land use history drives differences in functional composition and losses in functional diversity and stability of Neotropical urban forests. Urban Forestry & Urban Greening, 49: 126608. https://doi.org/10.1016/j.ufug.2020.126608.

[47]
Reba M, Seto K C, 2020. A systematic review and assessment of algorithms to detect, characterize, and monitor urban land change. Remote Sensing of Environment, 242: 111739. https://doi.org/10.1016/j.rse.2020.111739.

DOI

[48]
Ribeiro E L, Silveira J A R, 2020. A produção habitacional do programa MCMV no município de São Paulo: critérios de localização adotados pelos produtores e impactos na estrutura urbana e na qualidade de vida dos moradores. Journal of Urban Technology and Sustainability, 3(1): 78-88. http://dx.doi.org/10.47842/ juts.v3i1.25.

DOI

[49]
Romagosa F, 2018. Physical health in green spaces: Visitors’ perceptions and activities in protected areas around Barcelona. Journal of Outdoor Recreation and Tourism, 23(1): 26-32. https://doi.org/10.1016/j.jort.2018.07.002.

DOI

[50]
Rui L, Buccolieri R, Gao Z et al., 2019. Study of the effect of green quantity and structure on thermal comfort and air quality in an urban-like residential district by ENVI-met modelling. Building Simulation, 12(2): 183-194. https://doi.org/10.1007/s12273-018-0498-9.

DOI

[51]
Salomão R P, Alvarado F, Baena-Díaz F et al., 2019. Urbanization effects on dung beetle assemblages in a tropical city. Ecological Indicators, 103: 665-675. https://doi.org/10.1016/j.ecolind.2019.04.045.

DOI

[52]
San Francisco, 2014. San Francisco Planning Department. Urban Forest Plan. San Francisco, United States. Retrieved September 21st, 2016 from: http://default.sfplanning.org/plans-and-programs/planning-for-the-city/urban-forest-plan/Urban_Forest_Plan_Final-092314WEB.pdf.

[53]
Santos C A G, Guerra-Gomes I C, Gois B M, 2019. Correlation of dengue incidence and rainfall occurrence using wavelet transform for João Pessoa City. Science of the Total Environment, 647: 794-805. https://doi.org/10.1016/j.scitotenv.2018.08.019.

DOI

[54]
Santos C A G, Nascimento T V M, Mishra M et al., 2021. Analysis of long- and short-term shoreline change dynamics: A study case of João Pessoa city in Brazil. Science of the Total Environment, 769: 144889. http://dx.doi.org/10.1016/j.scitotenv.2018.08.019.

DOI

[55]
Sartori A R, Martins G A C, Scarambone Z A et al., 2018. Urban afforestation and favela: A study in a community of Rio de Janeiro, Brazil. Urban Forestry & Urban Greening. https://doi.org/10.1016/j.ufug.2018.10.004.

[56]
Shahtahmassebi A R, Li C, Fan Y et al., 2021. Remote sensing of urban green spaces: A review. Urban Forestry & Urban Greening, 57: 126946. https://doi.org/10.1016/j.ufug.2020.126946.

[57]
Sharvelle S, Dozier A, Arabi M et al., 2017. A geospatially-enabled web tool for urban water demand forecasting and assessment of alternative urban water management strategies. Environmental Modelling & Software, 97: 213-228. https://doi.org/10.1016/j.envsoft.2017.08.009.

[58]
Shojaei P, Gheysari M, Myers B et al., 2017. Effect of different land cover/use types on canopy layer air temperature in an urban area with a dry climate. Building and Environment, 125: 451-463. https://doi.org/10.1016/j.buildenv.2017.09.010.

DOI

[59]
Silva B N, Khan M, Han K, 2018a. Towards sustainable smart cities: A review of trends, architectures, components, and open challenges in smart cities. Sustainable Cities and Society, 38: 697-713. https://doi.org/10.1016/j.scs.2018.01.053.

DOI

[60]
Silva J S, Silva R M, Santos C A G, 2018b. Spatiotemporal impact of land use/land cover changes on urban heat islands: A case study of Paço do Lumiar, Brazil. Building and Environment, 136: 279-292. http://dx.doi.org/10.1016/j.buildenv.2018.03.041.

DOI

[61]
Sobreira L C, Leder S M, da Silva F A G et al., 2011. Urban sprawl and mesoclimatic variations in João Pessoa-PB. Ambiente Construído, 11(2): 125-138. http://dx.doi.org/10.1590/S1678-86212011000200009.

DOI

[62]
Souza J F, Silva R M, Silva A M, 2016. Influence of land use on surface temperature: A case study in João Pessoa - PB. Ambiente Construído, 16(1): 21-37. http://dx.doi.org/10.1590/s1678-86212016000100058.

[63]
Stevens P O, 2014. Dinâmica da paisagem no geossistema do estuário do rio Paraíba - extremo oriental das Américas: Estimativas de perdas de habitat e cenários de recuperação da biodiversidade. Ph.D. Dissertation, Universidade Federal da Paraíba, João Pessoa.

[64]
SUDEMA - Superintendência de Administração do Meio Ambiente, 2018. Caracterização climatológica na região do município de Santa Rita - PB. (URL: http://sudema.pb.gov.br/consultas/downloads/arquivos-eia-rima/termopower-vi/anexos/9-caract-climat.pdf. Accessed January 2020).

[65]
Ulbricht K A, Heckendorff W D, 1998. Satellite images for recognition of landscape and landuse changes. ISPRS Journal of Photogrammetry and Remote Sensing, 53(4): 235-243. https://doi.org/10.1016/S0924-2716(98)00006-9.

DOI

[66]
Vecchiato D, Tempesta T, 2013. Valuing the benefits of an afforestation project in a peri-urban area with choice experiments. Forest Policy and Economics, 26: 111-120. https://doi.org/10.1016/j.forpol.2012.10.001.

DOI

[67]
Viera A J, Garrett J M, 2005. Understanding interobserver agreement: The kappa statistic. Family Medicine, 37: 360-363.

[68]
Wang J, Li Y P, Sun J et al., 2019. Analyzing urban forest coverage variation in Guangzhou-Foshan region using factorial analysis based multivariate statistical prediction models. Forest Ecology and Management, 432: 121-131. https://doi.org/10.1016/j.foreco.2018.09.010.

DOI

[69]
Zeng Z, Lan J, Hamidi A R et al., 2020. Integrating Internet media into urban flooding susceptibility assessment: A case study in China. Cities, 101, 102697. https://doi.org/10.1016/j.cities.2020.102697.

[70]
Zurqani H A, Post C J, Mikhailova E A et al., 2019. Mapping urbanization trends in a forested landscape using Google Earth Engine. Remote Sensing in Earth Systems Sciences, 2: 173-182. https://doi.org/10.1007/s41976-019-00020-y.

DOI

Outlines

/