Research Articles

Rural vulnerability in China: Evaluation theory and spatial patterns

  • YANG Ren , 1, 2 ,
  • PAN Yuxin 1
Expand
  • 1. School of Geography and Planning, Sun Yat-sen University, Guangzhou 510275, China
  • 2. China Regional Coordinated Development and Rural Construction Institute, Sun Yat-sen University, Guangzhou 510275, China

Yang Ren (1984‒), PhD and Associate Professor, specialized in rural geography and land use. E-mail:

Received date: 2021-02-27

  Accepted date: 2021-07-02

  Online published: 2021-12-25

Supported by

National Natural Science Foundation of China(41871177)

National Natural Science Foundation of China(41801088)

Natural Science Foundation of Guangdong Province(2018A0303130097)

Abstract

An indicator system is constructed and applied for comprehensive measurement of rural vulnerability in China’s counties. Through the selection of five representative transects we explore regional differences in, and driving forces of, China’s rural vulnerability. The results show that (1) The rural vulnerability of counties in China is generally within the threshold range of low to medium, and exhibits obvious spatial differences. Along the “Bole-Taipei Line”, there is a spatial pattern of north-south differentiation. Villages in the northeast part of the counties have low vulnerability, while those in the southwest are relatively vulnerable (2) External environmental phenomena are the leading factors that induce rural vulnerability. Specifically, the rural ecological subsystem composed of ecological exposure, ecological sensitivity, and ecological adaptation is the principal determinant of rural vulnerability. The rural economic subsystem composed of economic exposure, economic sensitivity, and economic adaptation is also a core determinant of rural vulnerability. The social subsystem composed of social exposure, social sensitivity, and social adaptation is also an important determinant of rural vulnerability. (3) According to the principle of adapting measures to local conditions, different regions should seek to reduce regional embeddedness and path dependence. We should strengthen the prediction and monitoring of sources of disturbance in rural areas, and scientifically control the sensitivity of the system itself. Then the adaptive capacity of the rural system can be improved pursuant of promoting sustainable development.

Cite this article

YANG Ren , PAN Yuxin . Rural vulnerability in China: Evaluation theory and spatial patterns[J]. Journal of Geographical Sciences, 2021 , 31(10) : 1507 -1528 . DOI: 10.1007/s11442-021-1909-x

1 Introduction

With globalization, urbanization, industrialization, informatization, and marketization spreading to the countryside (Woods, 2007; Liu et al., 2017), the spatial patterns, economic forms, and environmental states of rural areas have undergone fundamental changes. All kinds of capital, technology, and consciousness are transferred from the city to the rural market (Akira, 2010; Yang et al., 2020b). The elements and functions of the rural regional system have experienced rapid restructuring and transformation. At the same time, the stability of the system has been impacted and disturbed, which makes the rural regional system vulnerable. In 2018, the Organization for Economic Cooperation and Development released its Global Vulnerability report which emphasized that vulnerability is still an issue and driven by multi-dimensional factors. It is not limited to the ecological environment, but is widespread in economic and social domains as well. Vulnerability has long been one of the core areas of global environmental change and sustainability science. In recent years, many disciplines, organizations, and major scientific research projects have paid close attention to the issue of vulnerability, e.g., the International Human Dimensions Programme on Global Environmental Change, the International Geosphere-Biosphere Programme, Future Earth, the United Nations Sustainable Development Goals, and the Intergovernmental Panel on Climate Change (IPCC, 2014; O’Neill et al., 2017). Globalization, industrialization, and urbanization accelerate the process of spatial reorganization and reallocation of various resources, which has an important impact on the process of regional economic and social development. It also accelerates the rapid reconstruction and decline of the fragile rural spatial system. The sustainable development of the rural regional system is facing substantial challenges (Kates et al., 2001). Comprehensive research on coping strategies needs to be pursued to facilitate adaptation to local conditions. It is necessary to reduce the vulnerability of rural areas in different regions and realize the sustainable development of rural areas (Li et al., 2008; Wang et al., 2020).
The concept of vulnerability, rooted in the study of natural disasters and poverty, has different definitions but usually includes the attributes of individuals or groups dealing with the effects of disturbances such as natural disasters (Janssen et al., 2006). Research and applications of vulnerability involve a wide range of fields. In the early stage, vulnerability was mainly explored in the context of floods, droughts, and other disasters (Birkmann et al., 2013; De Silva et al., 2018; Ncube et al., 2018), as well as forests, coastal areas, and other ecosystems (Bevacqua et al., 2018). With the gradual integration and penetration of the natural science system and socio-economic system (Yang et al., 2020a), the impact of human activities on the natural environment and the interactions between them are becoming increasingly significant. Research on vulnerability extends to the territorial system of human-environment interactions and the socio-economic-ecological coupling system. The resilience alliance, represented by Holling (1973), was the first to use adaptive cycle theory to comprehensively analyze the resilience of socio-ecological systems. The most common vulnerability assessment frameworks are the vulnerability scoring diagram (VSD), agents’ differential vulnerability, and pressure-state-response (Polsky, 2007). On the basis of clarifying the connotation of vulnerability, the vulnerability evaluation index system was established, and the vulnerability research framework is integrated. Vulnerability is divided into three levels: exposure, sensitivity, and adaptability. Based on the VSD, a Social Vulnerability Assessment Framework was established (Huang, 2018). In addition, from a system perspective, some scholars have described and evaluated vulnerability with respect to four dimensions: resource, ecological environment, economic, and social vulnerability (Wang et al., 2014). In terms of research content, domestic and foreign research results on vulnerability mainly focus on the connotation of the concept, assessment frameworks, spatial and temporal characteristics, determinants, and governance under the background of climate change, natural disasters, and environmental change (Khajehei et al., 2020). In terms of research methods, principal component analysis (Huai, 2016), the analytic hierarchy process (Wang et al., 2014), and the comprehensive index method (Zhao et al., 2014) have been used for quantitative analysis of vulnerability. In addition, function modeling (He et al., 2016), gray relation analysis (Yang et al., 2015), and black propagation neural network training (Chen et al., 2014) have been employed to conduct comprehensive evaluations of vulnerability. With the application and development of GIS and remote sensing technology, the selection of evaluation indicators is more objective, and the visual expression is clearer and intuitive (Zou et al., 2014). Vulnerability research areas are mainly in resource-based cities (Cheng et al., 2015), coastal areas (Li, 2014), and tourism cities (Su et al., 2013). At the same time, there is an increasing amount of research being conducted on rural vulnerability at various scales involving counties, villages, and farmers, among others (Huang et al., 2014; Wu et al., 2014; Wang et al., 2020).
On the one hand, the VSD model with strong operability and standardization, the interactive vulnerability assessment model, and the PSR model are often used to evaluate rural vulnerability. However, there is still room for further exploration in the framework of evaluating rural vulnerability in different geographical types. On the other hand, existing research focuses more on the construction of vulnerability evaluation index systems and the measurement of vulnerability. It is mainly concentrated in urban areas or some specific regional areas. There is limited research on the determinants and driving forces of rural vulnerability. With the continuous advancement of China’s urbanization and industrialization, policies to promote rural development and revitalization appear frequently, and spatial imbalance problems are common. Coupled with the prevalence of natural disasters, rural vulnerability problems occur frequently and rural sustainable development is thus jeopardized. Therefore, it is pertinent to discuss the issue of rural vulnerability (Yang et al., 2019b). In the new era, China implemented Rural Revitalization as a major national strategy. It is an urgent scientific proposition to accurately identify and quantify the determinants of rural development and the vulnerability of rural systems in the domain of rural geography. Rural vulnerability research is an important part of rural sustainable development research (Keeble, 1987; Kemp et al., 2007; Griggs et al., 2013). Rural vulnerability is derived from vulnerability, which refers to the rural regional system exposed to the interaction between natural activities and human activities. Due to differences in the sensitivity and adaptability of the system, the state and degree of system vulnerability are presented. By constructing an analytical framework and conceptual model of rural vulnerability and establishing an evaluation index system of county-level rural vulnerability, this paper comprehensively measures and explores the rural vulnerability of China’s counties. On this basis, five representative transects are selected to analyze spatial differences in rural vulnerability in China’s counties, and analyze the coupling transmission and interconnection formation mechanism of its influencing factors. This paper puts forward a series of coping strategies to solve the problem of rural vulnerability, so as to provide basic research support for the revitalization and prosperity of China’s rural areas, and make a preliminary attempt to explore the scientific path to reduce rural vulnerability and promote rural sustainable development.

2 The concept and connotation of rural vulnerability

Rural vulnerability refers to the state and degree of damage that the rural regional system is exposed to because of external disturbance under the influence of natural environmental change and human activities. According to their own structural characteristics and functional attributes, each system will undertake passive adaptation, gradual adaptation, or transformation adaptation in response to adverse disturbance (Huang, 2018). Based on the previous studies on the connotation of vulnerability (Turner et al., 2003; Huang et al., 2014; Wen et al., 2016), this paper further explains the connotation of rural vulnerability from the following perspectives (Figure 1):
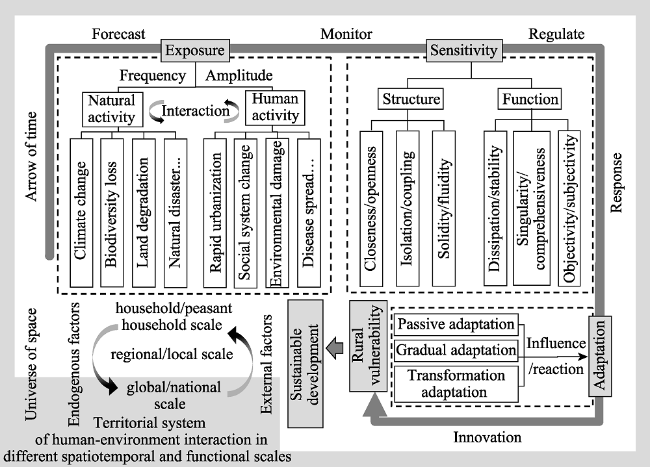
Figure 1 Concept and connotation of rural vulnerability
(1) Rural vulnerability is the characteristic of a rural regional system suffering damage when it is exposed to comprehensive disturbances from natural and human activities due to the difference of sensitivity and adaptation of the system in actual or expected disturbance and its influence. Therefore, rural vulnerability is a function of exposure, sensitivity, and adaptation (Turner et al., 2003; Huang, 2018). Exposure refers to the strength of the system subjected to external disturbances. Sources of disturbance include natural disasters, climate change, land degradation, ecological security, and biodiversity loss, as well as human activities such as rapid urbanization and industrialization, rural development transformation, social system and policy change, land use change, eco-environment destruction, and pathogens. The frequency and amplitude of disturbance sources affect the degree of exposure, and the system may suffer from multiple disturbance sources at the same time. Sensitivity refers to the ability of a system to sense quickly when it is subjected to external disturbances. It depends on the internal structural attributes and characteristic functions of the system structure, such as the closeness or openness, isolation or coupling, objectivity or subjectivity, singularity or comprehensiveness, solidity or fluidity, and dissipation or stability. The sensitivity is a closed interval between 0 and 1. For example, the more closed the system is, the more sensitive it tends to be i.e., closer to 1. By contrast, the more open the system is, the more it tends towards 0 in terms of sensitivity. Adaptation refers to the ability of the system to adapt to passively, adjust gradually, or transform and being adapted by engineering and technical means when external disturbance is applied to the system. The degree of adaptability will slow down or deepen the vulnerability of the system to a certain extent.
(2) The rural regional system is a dynamic system moving in different spatial scales. The arrow of time and the universe of space interweave, and there are obvious differences in the elements of different scales. On the spatial scale, the rural regional system includes the household/peasant household scale, regional/local scale, and global/national scale from micro to macro to form an understanding of the interaction between environment and society based on place (NRC, 1999). In addition, some scholars believe that spatial scale can also be understood as social scale, constituted by three levels: family, group, and social organization (Huang, 2018). The micro scale elements are endogenous factors in the macro scale system, and the elements in the macro scale are the external factors in the micro scale. The factors interact with each other. In the vector of time, the system will constantly experience external disturbances, and constantly make positive responses and adjustments. Moreover, the impact of disturbance and system adjustment and adaptation may have a lag, so the time dimension cannot be ignored in research on rural vulnerability.
(3) In the early stage, rural vulnerability research was mostly undertaken in the context of natural disasters. Latterly, it has been extended to many fields, such as land use, climate change, energy decarbonization, disease spread, sustainable science, and so on. The system has gone through five stages: Forecasting disturbance source → monitoring system dynamics → regulating its own structure and function → responding → innovating path (Future Earth Transition Team, 2012). The rural regional system is continuously evolving in the process of external disturbance and internal adjustment. Scientific understanding of the evolution stage of the rural regional system is the basis for avoiding harm and regulating the rural regional system, and is also the premise of proposing measures and strategies to reduce rural vulnerability.
(4) Based on the understanding of the connotation of the concept of rural vulnerability, a conceptual model for measuring rural vulnerability in an ideal state is constructed (Figure 2). In the ideal model, the horizontal axis from left to right represents the transition from vulnerable state to sustainable state. The left and right axis solid lines represent the degree of the original exposure curve E0 and the original adaptation curve A0 respectively. The dotted lines show the degree of exposure curve E and adaptation curve A under the influence of sensitivity S. When any point y is in a different position, the system will be in a different vulnerable or sustainable state. It is a state driven by exposure, sensitivity, and adaptation, or a combination of multiple factors.
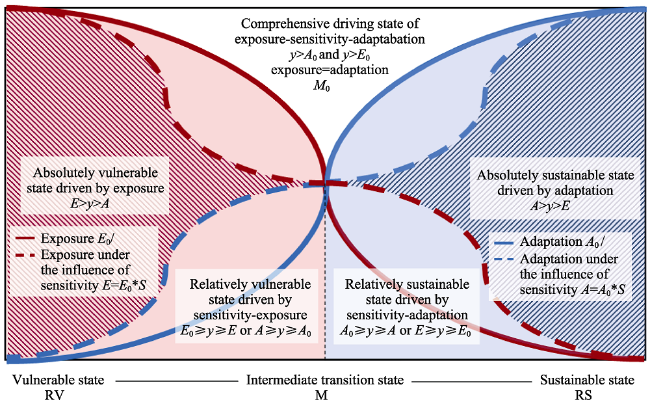
Figure 2 Ideal model for measuring rural vulnerability
① When A=A0=y=E0=E, the rural exposure equals the adaptation, the system is at the tipping point. The village is in an intermediate transition state M0.
② When E0>E>A>A0, the rural exposure is greater than the adaptation, and rural vulnerability is positive. The village is in a vulnerable state:
When E>y>A, the village is in an absolutely vulnerable state driven by exposure.
When E0yE or AyA0, the village is in a relatively vulnerable state driven by sensitivity-exposure.
③ When A0>A>E>E0, the rural adaptation is greater than the exposure, and rural vulnerability is negative. The village is in a sustainable state:
When A>y>E, the village is in an absolutely sustainable state driven by exposure.
When A0yA or EyE0, the village is in a relatively sustainable state driven by sensitivity-exposure.
④ When y>A0 and y>E0, rural vulnerability is comprehensively affected by exposure, sensitivity, and adaptation.

3 Data and methods

3.1 Comprehensive index system for rural vulnerability measurement

3.1.1 Index system construction

Based on the research of relevant scholars at home and abroad and the understanding of rural vulnerability (Meng et al., 2013; Wen et al., 2016), we take 2013 counties in China as the research objects (due to limitations in terms of data acquisition in Hong Kong, Macao, and Taiwan and the lack of data in some counties (districts), these regions are not included in the sample). An evaluation system with 21 indicators is constructed from three perspectives, i.e., exposure, sensitivity, and adaptation (Table 1). The rural vulnerability index (RVI) is used to characterize rural vulnerability at the county level. Positive and negative directions of the indicators suggest, respectively, that they can enhance or diminish rural vulnerability.
Table 1 Evaluation system of the rural vulnerability index
Criterion layer Index layer Element content Weight Index nature
Exposure
(+)
0.3020
Vegetation degradation Mean value of NDVI decline slope/GDP growth 0.0517 +
Soil erosion Soil erosion intensity/GDP growth 0.0517 +
Climatic factors Mean annual precipitation * Population size 0.0467 +
Accumulated temperature ≥10℃* Population size 0.0472 +
Industrial gas Industrial SO2 emissions per unit of GDP 0.0321 +
Air pollution PM2.5 concentrations per unit of GDP 0.0370 +
Intensity of economic activity Nighttime light intensity/Population size 0.0356 +
Sensitivity
(+)
0.3882
Topographic relief Mean gradients 0.0480 +
Mean elevation 0.0446 +
Land cover Mean NDVI 0.0474 -
Population density Population density 0.0468 +
Economic strength Per capita GDP 0.0516 -
Financial capacity Financial contribution 0.0516 -
Agricultural development Added value of primary industry 0.0482 +
Industrial structure Output value of secondary and tertiary industries/GDP 0.0499 -
Adaptation
(-)
0.3098
Food security Per capita grain possession 0.0516 +
Educational level Number of primary and secondary school students per 10000 students 0.0517 +
Health care Number of beds in medical and health institutions per 10000 people 0.0516 +
Social welfare Number of beds in social welfare institutions per 10000 people 0.0517 +
Savings level Balance of urban and rural residents’ savings deposits 0.0516 +
Agricultural mechanization level Total power of agricultural machinery 0.0515 +
(1) The degree of exposure reflects the extent of disturbance of the rural regional system. Vegetation degradation, soil erosion, mean annual precipitation, accumulated temperature ≥10℃, industrial waste gas, air pollution, and economic activity intensity are selected as positive indicators. Vegetation erosion, soil erosion, mean annual precipitation, and accumulated temperature ≥10℃ reflect the disturbance of natural environmental changes on the system whilst the other three indicators reflect the impact of human activities on the system. Natural environment changes and human activities interact to interfere and disturb the rural regional system. At the same time, regional economic vitality and population size will aggravate or diminish the disturbance to a certain extent. In the evaluation process, considering the impact of population and socio-economic development on the rural regional system, the population size, GDP, and GDP growth are taken as the exposure. Among them, the degree of vegetation degradation is characterized by the ratio of average NDVI decline slope to GDP growth. NDVI can reflect the vegetation coverage and growth status. Soil erosion is characterized by the ratio of soil erosion intensity to GDP growth. Soil erosion intensity refers to the erosion degree of the surface soil in unit area and period due to the interaction of natural forces and human activities. The climate environment is mainly affected by regional hydrothermal conditions. Excessive precipitation and temperature will increase the degree of system exposure. Industrial gas is characterized by industrial SO2 emissions per unit GDP. SO2 is one of the main air pollutants. The greater the SO2 emissions, the higher the system exposure. Air pollution is characterized by the concentration of fine particulate matter (PM2.5) per unit GDP. PM2.5 is the main factor causing haze weather and affects traffic flow and human health. The higher the PM2.5 concentration, the greater the system exposure. The intensity of economic activity is characterized by the ratio of nighttime light intensity to population growth. The greater the nighttime light intensity, the greater the intensity of human economic activity, and the corresponding increase in exposure.
(2) The sensitivity reflects the degree to which the rural regional system is vulnerable to external disturbances. The lower the sensitivity of the system, the more stable it is in response to external disturbances. Sensitivity is constituted by eight indexes: falling gradient, elevation, land cover, population density, economic strength, financial capacity, agricultural development, and industrial structure. The natural background conditions of the system’s topographic relief and vegetation coverage are the basis of system sensitivity. For example, excessive slope and elevation, and low vegetation coverage are all important factors that increase the sensitivity of the system. However, with socio-economic development, population and industrial factors have become the main indicators that affect system sensitivity. Among them, population density and agricultural development are positive indicators, and excessive population density or a high proportion of primary industry in the industrial structure will increase the sensitivity of the system. In addition, the region’s economic strength, financial capacity, and industrial structure are negative indicators. Superior economic strength, strong financial capacity, and reasonable industrial structure can effectively resist external disturbances.
(3) Adaptability reflects the ability of the system to passively adapt, gradually adapt, and directly adapt to external disturbances. The stronger the adaptability of the system, the faster it can adjust and adapt when the system is responding to external disturbances. Six indicators of adaptability are selected from food security, education level, health care, social welfare, savings level, and agricultural mechanization level, all of which are negative indicators. The increase in per capita grain possession, the smooth flow of mail and telecommunications, and improvements in medical and health infrastructure will increase the system’s ability to respond to external disturbances to a certain extent, thereby increasing the sustainability of the system’s future development.

3.1.2 Data normalization and index weight determination

To eliminate the influence of the dimensions, the nature of the indicators, and the magnitude of the indicators, the Min-Max normalization method is used to standardize the original data. The equation for normalization of positive indicators is as follows:
$x_{i j}=\left(X_{i j}-X_{j \min }\right) /\left(X_{j \max }-X_{j \min }\right)$
The equation for normalization of negative indicators is as follows:
$x_{i j}=\left(X_{j \max }-X_{i j}\right) /\left(X_{j \max }-X_{j \min }\right)$
where Xij, Xjmin, Xjmax, and xij are respectively the original value, minimum value, maximum value, and standardized value of the jth index of the ith county area.
There are many traditional methods for determining index weights, including the Expert Grading Method, Principal Component Analysis, the Analytic Hierarchy Process, the entropy method, and so on. The calculation result of the entropy method is characterized by the degree of dispersion of an index. The greater the degree of dispersion, the greater the influence of the index on the comprehensive evaluation. This paper uses the entropy method to determine the weight coefficients of each indicator because it is more objective and accurate compared to the other methods (Table 1).

3.1.3 Comprehensive measurement model of rural vulnerability

Rural exposure and rural vulnerability show a positive correlation, that is, the greater the exposure, the more vulnerable the village. There is a negative correlation between rural adaptation and rural vulnerability, that is, the weaker the adaptation, the more vulnerable the village. Sensitivity reflects the characteristics of villages or farmers, so it has a multiplier relationship with rural vulnerability, which can aggravate or alleviate rural vulnerability to a certain extent. Accordingly, the rural vulnerability assessment model is as follows:
$R V I=f\{E I, S I, A I\}=(E I-A I)^{*} S I$
where RVI represents the rural vulnerability index; EI, SI, and AI represent the rural exposure index, the rural sensitivity index, and the rural adaptation index, respectively. Each dimension index in equation (3) is obtained by a weighted sum method:
$E I / S I / A I=\sum_{j=1}^{n} w_{j} x_{i j}$
where wj is the weight of each dimension index; xij is the standardized value of each dimension index; n is the number of each dimension index.

3.2 Assessment and classification of rural vulnerability

The rural exposure index EI, the rural sensitivity index SI, and the rural adaptation AI are obtained by calculation. According to the natural breakpoint method, the rural EI, SI, and AI are divided into five levels: low value areas, lower value areas, medium value areas, higher value areas, and high value areas. Then the rural vulnerability index (RVI) can be calculated by equation (3). According to the natural breakpoint method, it can be divided into five levels, namely, low vulnerability, lower vulnerability, medium vulnerability, higher vulnerability, and high vulnerability (Table 2).
Table 2 Grading criteria for the comprehensive assessment of rural vulnerability in China
Classification Rural vulnerability Exposure Sensitivity Adaptation
Grade 1 Low vulnerability/low value areas <0.445 <0.309 <0.429 <0.093
Grade 2 Lower vulnerability/lower value areas 0.446-0.512 0.310-0.374 0.430-0.522 0.094-0.154
Grade 3 Medium vulnerability/medium value areas 0.513-0.573 0.375-0.463 0.523-0.616 0.155-0.230
Grade 4 Higher vulnerability/higher value areas 0.574-0.698 0.464-0.622 0.617-0.748 0.231-0.346
Grade 5 High vulnerability/high value areas ≥0.699 ≥0.623 ≥0.749 ≥0.347

3.3 Transect and trend analysis

A transect represents a series of continuous linear research sites that change regularly or show significant differences in geographic gradients driven by dominant factors (GCTE Report 36, 1995; Zhang et al., 1997; Long et al., 2001; Liu et al., 2012). To reveal the spatial pattern and driving forces of rural vulnerability in China’s counties, we continue our previous research and the five transects of the northern border, the Longhai-Lanxin railway line, the Yangtze River, the G106 national highway and the county within 100 km of the eastern coast are selected (Liu et al., 2012). Trend analysis uses GIS as an analytical platform and draws data in x, y, and z three-dimensional perspective diagrams through projection (Egenhofer et al., 1998). The trend analysis method projects the scatter plot on the (x, y) plane onto the (x, z) north-south orthogonal plane and the (y, z) east-west orthogonal plane. The study is based on the transect, combined with trend analysis, to reveal the geographical gradient characteristics of rural vulnerability (Liu et al., 2012), and seeks to summarize its attribution.

3.4 Data sources

The socioeconomic indicator data in the evaluation system of the rural vulnerability index mainly emanate from the “China Statistical Yearbook (County-Level) 2016”. Supplements are made based on the statistical yearbooks of different cities, statistical yearbooks of different counties, and some statistical bulletins below the county level in 2016. Data on exposure indicators such as mean elevation, mean annual NDVI, soil erosion intensity, mean annual precipitation, and accumulated temperature ≥10℃ are taken from the website of the Resource and Environmental Science and Data Center (http://www.resdc.cn). Industrial SO2 emissions per unit of GDP and PM2.5 concentrations are sourced from the MEIC Model website (http://meicmodel.org) of China’s multi-scale emission inventory model. By stacking the four emission source data maps of power, industry, residential, and transportation, using zonal statistics in ArcGIS 10.2, the average PM2.5 concentration data of each county is obtained. This paper selects the industrial emission source layer, and obtains SO2 emissions data in each county through zonal statistics. Since the website only provides data for even-numbered years from 2008 to 2016, this paper selects 2016 grid emission data for analysis. The annual nighttime light data come from NOAA/NCEI National Centers for Environmental Information (https://ngdc.noaa.gov). China’s annual nighttime light data of 2015 selects “vcm-orm” data with outliers removed. From the “SRTMSLOPE 90 m resolution slope data product”, the gradient data of each county is obtained through splicing and zonal statistics. Comprehensive analysis and processing proceeds based on the following considerations (Yang et al., 2019a):
·Due to limitations in terms of data acquisition in Hong Kong, Macao, and Taiwan regions and the lack of data in some counties (districts), these regions are not covered in the study. The number of county units studied is 2013.
·Considering that economic and social conditions have an important impact on rural vulnerability, the urbanization level of China’s municipal districts is generally high, and the degree of rural vulnerability is low, so the municipal districts are not included in the research category.
·The names of county-level units adjusted by administrative divisions are unified and revised based on the county administrative units in China in 2010.

4 Results

4.1 Spatial characteristics of rural vulnerability in China at the county level

Taking the completeness of administrative divisions, natural conditions, resource endowments, and the socio-economic development level into account, and referring to the division method of the predecessors, China’s 2013 county units are divided into eight major types of regions: the great northwest region, the middle reaches of Yellow River region, the southern coastal region, the middle reaches of Yangtze River region, the eastern coastal region, the northern coastal region, the southwest region, and the northeast region (Table 3). In addition, the Hu Line and the Bole-Taipei (Bo-Tai) Line divide China into four quadrants (Fang, 2020). The east, south, west, and north are quadrants 1, 2, 3, and 4 respectively. There are significant regional differences in rural vulnerability in China’s counties. How to identify the determinants of rural vulnerability in different types of regions and formulate countermeasures based on local conditions are key issues that need to be resolved to achieve sustainable rural development.
Table 3 Mathematical characteristics of territorial types of rural vulnerability
Territorial types Vulnerability index Exposure index Sensitivity index Adaptation index
Grade Mean Grade Mean Grade Mean Grade Mean
Great northwest region Medium 0.543 Low 0.285 Higher 0.711 Lower 0.105
Middle reaches of Yellow River region Lower 0.499 Lower 0.316 Lower 0.512 Lower 0.141
Southern coastal region Higher 0.595 Medium 0.434 Medium 0.529 Lower 0.099
Middle reaches of Yangtze River region Medium 0.534 Medium 0.391 Lower 0.499 Lower 0.147
Eastern coastal region Medium 0.517 Medium 0.416 Lower 0.441 Medium 0.204
Northern coastal region Lower 0.463 Lower 0.335 Lower 0.473 Medium 0.213
Southwest region Medium 0.560 Lower 0.355 Medium 0.598 Lower 0.106
Northeast region Lower 0.450 Low 0.302 Lower 0.486 Medium 0.205

Note: The Great Northwest region comprises Gansu Province, Qinghai Province, Ningxia Hui Autonomous Region, Tibet Autonomous Region, and Xinjiang Uygur Autonomous Region. The middle reaches of Yellow River region comprises Shaanxi Province, Shanxi Province, Henan Province, and Inner Mongolia Autonomous Region. The southern coastal region comprises provinces of Fujian, Guangdong, and Hainan. The middle reaches of Yangtze River region comprises provinces of Hubei, Hunan, Jiangxi, and Anhui. The eastern coastal region comprises Shanghai Municipality, Jiangsu Province, and Zhejiang Province. The northern coastal region comprises Beijing Municipality, Tianjin Municipality, Hebei Province, and Shandong Province. The southwest region comprises Yunnan Province, Guizhou Province, Sichuan Province, Chongqing Municipality, and Guangxi Zhuang Autonomous Region. The northeast region comprises provinces of Liaoning, Jilin, and Heilongjiang.

(1) Rural vulnerability: The average RVI of China’s counties in 2013 was 0.522, and counties (districts) with lower and medium vulnerability were dominant, accounting for 32.34% and 39.84% of the total respectively, and the sum of the two accounted for 72.18% of the total counties. The number of counties (districts) with higher and low degrees of vulnerability was second, with 312 and 218, respectively, accounting for 15.50% and 10.83% of the total number of counties (districts). High vulnerability counties (districts) were the least, accounting for only 1.49% of the total. The level of rural vulnerability in China at the county level presented an “off-peak inverted U-shaped” distribution. In terms of the spatial pattern, along the “Bo-Tai Line” (Fang, 2020), the development trend was “polarized”. The level of rural vulnerability in China’s counties broadly showed low and high spatial differentiation in the northeast and southwest, respectively (Figure 3a). The RVI of the first and second quadrants is higher than that of the third and fourth quadrants. The RVI of the northeast, northern coastal, middle reaches of the Yellow River, eastern coastal, middle reaches of the Yangtze River, the great northwest, southwest, and southern coastal regions increased in sequence.
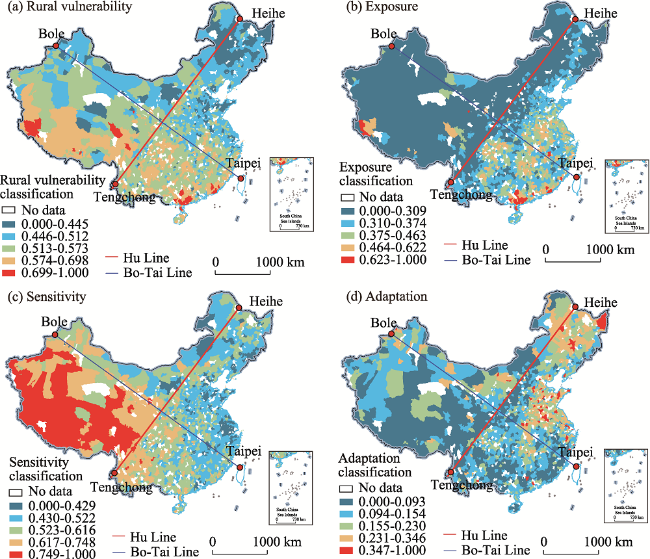
Figure 3 Spatial distribution of rural vulnerability in China in 2015

Note: Based on the standard map [approval number GS(2019)1698] downloaded from the website of the National Bureau of Surveying, Mapping, and Geoinformation; the base map has not been modified.

(2) Exposure: The average EI was 0.522, and the exposure levels of most counties (districts) are in the lower and medium value areas. The low-value areas, lower-value areas, medium-value areas, higher-value areas, and high-value areas accounted for 10.83%, 32.34%, 39.84%, 15.50%, and 1.49% of the total respectively. In terms of spatial pattern, along the “Hu Line”, there is a characteristic of “polarization”. The EI of the first and fourth quadrants was significantly higher than that of the second and third quadrants. The low exposure areas were mainly concentrated in the great northwest, northeast, and middle reaches of the Yellow River regions. The EI was higher in areas with fragile ecological environments and poor natural environmental conditions such as the southwest region and the great northwest region. The area was mainly restricted by natural environmental factors and affected by the temperate monsoon climate, with little and concentrated precipitation, poor matching of water and heat conditions, and multiple habitat problems such as land vegetation degradation and soil erosion (Figure 3b). The EI in coastal areas such as the northern, eastern, and southern coastal regions has increased. These areas have high intensities of human economic activities, substantial industrial waste gas emissions and air pollution problems, and have suffered greater external disturbances than other areas.
(3) Sensitivity: From the perspective of SI, the distribution of counties (districts) at different sensitivity levels was relatively even. Among them, the lower-value and the medium-value areas had the most counties, accounting for 36.21% and 31.35% of the total respectively. The number of counties (districts) in high-value areas was the least, accounting for 5.76% of the total. In terms of spatial pattern, the spatial differentiation characteristic of sensitivity was significant (Figure 3c), which is reasonably consistent with the spatial pattern of rural vulnerability. The third quadrant had the highest SI, followed by the fourth quadrant. The SI of the eastern region (0.487) was slightly lower than that of the central region (0.496) and significantly lower than that of the western region (0.641). The central and eastern regions have better endowments of water and soil resources, better natural environmental conditions than the western regions, and relatively high levels of economic and social development. When the system is disturbed by external factors, it has a certain ability to self-organize and mitigate disturbances. By contrast, in the vast western regions, factors such as fragile eco-environment, high system sensitivity, and irrational industrial structure have exacerbated rural vulnerability to a certain extent.
(4) Adaptation: The AI is generally low. The number of counties (districts) in low-value, lower-value, medium, higher-value, and high-value areas decreased as the level increased, and their county units accounted for 32.84%, 31.20%, 21.26%, 11.72%, and 2.98% of the total respectively. Shanghai had the strongest rural adaptation, with an average AI value of 0.388. This was followed by Shandong Province, Heilongjiang Province, Tianjin City, and Jiangsu Province. The Tibet Autonomous Region had the weakest adaptation, with an average AI of 0.068. From the perspective of spatial distribution, the AI in the southeast of the “Hu Line” was higher than that in the northwest, and the AI in the first quadrant was the highest. The spatial distribution of rural adaptation showed a certain spatial directionality of river systems (Figure 3d). The adaptation of coastal and riverside areas was generally strong, and the spatial differences were relatively balanced. The rural adaptation of coastal areas was to a certain extent higher than that of inland areas such as the great northwest region, southwest region, and the middle reaches of the Yellow River region (Table 3). The adaptation of rural areas was generally stronger in areas with better provisions and infrastructure in terms of transportation, education, medicine and health, and social welfare.

4.2 Rural vulnerability characteristics of typical transects

As a follow-up of the authors’ previous research, five transects traversing east-west and north-south were identified: along the northern border, the Longhai-Lanxin railway line, the Yangtze River, the G106 national highway, and the counties within 100 km of the eastern coast. This paper drew the trend lines of the rural vulnerability index, exposure index, sensitivity index, and adaptation index of each transect (Figure 4). From the perspective of the spatial gradient of geographic factors, we comprehensively analyzed the regional differences and attributions of rural vulnerability in China at the county level.
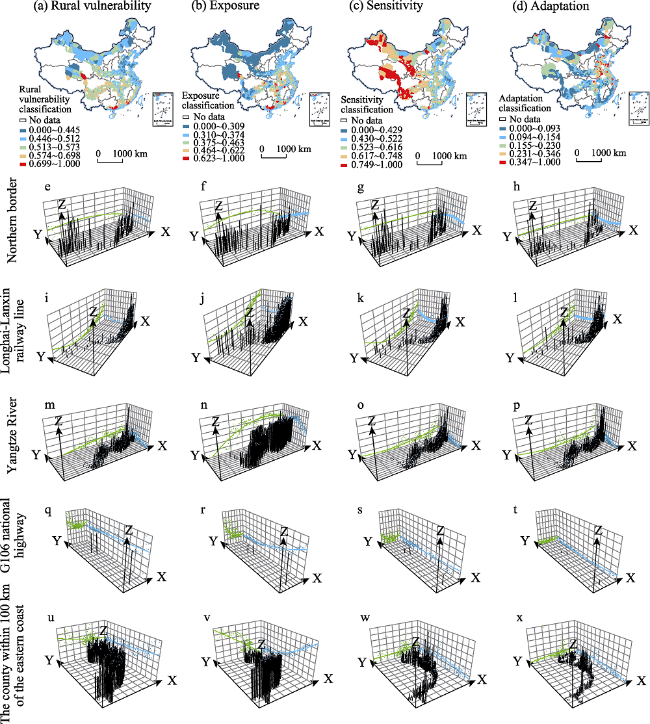
Figure 4 Rural vulnerability trend line of transect in 2015

Note: Based on the standard map [approval number GS(2019)1698] downloaded from the website of the National Bureau of Surveying, Mapping, and Geoinformation; the base map has not been modified.

(1) The northern border transect has a higher RVI index and is mainly composed of the northern border regions of Xinjiang Uygur Autonomous Region, Inner Mongolia, and Gansu Province. The difference between east and west was not significant. The RVI trend line basically presented a straight line, roughly showing a gentle trend of low in the east, high in the middle, and lower in the west. The transect is constrained by the background conditions of the natural environment, spanning arid and semi-arid, and humid and semi-humid regions, passing through land types such as forests, grasslands, and deserts. The light and heat conditions are generally good, and precipitation is scarce and concentrated. Mineral resources such as coal, rare earths, and petroleum are abundant. Agricultural development is dominated by animal husbandry and irrigated lands, accompanied by mineral resource extraction and petrochemical industries. Affected by excessive reclamation and grazing, and wanton mining of ore and raw materials, various problems have arisen such as degradation of vegetation coverage, fragile eco-environment, and land desertification. This has led to frequent occurrences of natural disasters, impeded infrastructure construction, low overall economic development, insufficient adaptability, prominent contradictions in human-environment relationships, and high RVI in the rural region system.
(2) The Longhai-Lanxin Railway transect traverses six provinces (autonomous regions): Jiangsu Province, Anhui Province, Henan Province, Shaanxi Province, Gansu Province, and Xinjiang Uygur Autonomous Region. It is a railway artery that runs through the east, middle, and west of China. The RVI along the Longhai-Lanxin Railway presents a roughly U-shaped pattern, and the east and west are higher than the central areas. Affected by urbanization and the level of regional economic development, villages in the eastern region have generally experienced the stages of rural industrialization and development of township and village enterprises driven by the rapid development of the regional economy, location, and market advantages. This process stimulates the vitality of the rural economy and improves the rural living environment, but also increases the rural EI and AI. As a traditional agricultural area, the central region has good basic conditions for agricultural production. At the same time, the rural areas have long been a labor export region. The industrial development of the central region is restricted relative to the eastern region, and the rural EI is relatively low. In the process of urban and rural development and transformation, the rural population structure, land use structure, and industrial structure have gradually transformed, and the AI for rural development has gradually increased. The western rural areas are subject to the influence of topography and landforms, and the agricultural natural climate conditions are relatively poor. Long-term population outflows, underdeveloped infrastructure, and non-viable villages are common, and problems such as the marginalization of cultivated land use and the hollowing of the economy and society are serious. The instability of farmers’ income has led to high EI and SI in rural areas, and low AI (Liu et al., 2019).
(3) The transect along the Yangtze River, from Shanghai to Panzhihua in Sichuan Province, stretches for 3000 km from east to west. It includes four megacities: Shanghai, Nanjing, Wuhan, and Chongqing. The RVI of the Yangtze River transect increases from west to east, showing a trend of lowest upstream, lower midstream, and highest downstream. The Yangtze River flows through topographic terrains high in the northwest and low in the southeast. It is distributed in three steps under the barrier of mountains. The terrain is expansive and hydropower resources are abundant. Most areas fall within the subtropical monsoon climate zone with good hydrothermal conditions. The land is fertile, arable land resources are abundant, and per capita grain possession is high. It is an important commodity grain base in China. However, urbanization and industrialization have led to a large amount of diffused pollution and waste industrial gas emissions, and the deterioration of the rural water and soil environment has increased the rural EI in the middle and lower reaches. In addition, the superior geographical location, suitable weather conditions, and convenient transportation conditions have attracted a large number of people to settle, and the population density is high. The increase in SI and AI has brought many great tests to the carrying capacity of the land.
(4) The G106 national highway transect runs through North China, Central China, and South China. It starts from Xicheng District of Beijing in the north, to Liwan District of Guangzhou City in the south, and passes through seven provinces (municipalities): Beijing, Hebei, Shandong, Henan, Hubei, Hunan, and Guangdong. The north-south trend line of the RVI of this transect is stable, but the central and southern regions are slightly higher than those in the northern regions. The terrain of North China is flat, agricultural production conditions are superior, arable land resources are abundant but water resources are relatively scarce, and rural EI is low. Problems such as aging and weakening of rural inhabitants, hollowing of rural areas, and environmental pollution are prominent in Central China, restricting the sustainable development of rural areas and leading to high levels of SI. South China is dominated by low mountains and hills. The location advantage of the sea and the policy advantages of economic zones and free trade zones have reduced the SI. With the influx of a large amount of capital and labor, urban and rural factors flow rapidly, and AI is enhanced while the overall rural development environment is getting better.
(5) The eastern coastal transect includes most counties in southern Shandong Province, Hebei Province, Tianjin City, Liaoning Province, Jiangsu Province, Zhejiang Province, Fujian Province, Shanghai City, Guangdong Province, and Hainan Province. Affected by coastal location advantages and regional development policies, SI is low and AI is high. The extensive industrialization development model of the southern coastal area has caused serious pollution. The RVI of the Pearl River Delta is higher than that of the Yangtze River Delta and the northern Beijing-Tianjin-Hebei Urban Agglomeration. The terrain of this transect is dominated by plains and hills, with densely intertwined river networks. Affected by the subtropical monsoon climate, the water and heat conditions are superior, and the climate is warm and humid. However, in the three major urban agglomerations on the transect, the urban space has continued to expand, resulting in a higher scale and rate of non-agricultural conversion of cultivated land, and higher EI. Affected by the geographical advantages of the coastal area, the eastern coastal area has a relatively high degree of openness, close economic ties with foreign countries, and a rapid marketization process, which has promoted the rapid flow of people, logistics, funds, and information to the region along with industrial transformation and upgrading. Thus the regional SI is low. Combined with the promotion of policy dividends such as the construction of the Guangdong-Hong Kong-Macao Greater Bay Area and the Free Trade Zone, regional AI has been greatly enhanced.

5 Discussion

5.1 Limitations of driving factor analysis

In response to the country’s major strategic needs for rural revitalization, research on the impact of social and cultural changes, policy systems, and social subjects on rural vulnerability should be further strengthened. Limited by the availability of data, measurements of rural vulnerability at the county scale mainly select indicators that are biased towards nature and economic society. In the future, typical villages will be selected to conduct in-depth analyses of the driving forces of rural vulnerability. Due to the plain terrain in the middle reaches of the Yellow River, there are some hills in the middle reaches of the Yangtze River such as Hunan Province and Jiangxi Province, which increase its SI. Additionally, the intensity of economic activity in the middle reaches of the Yangtze River is greater than that in the middle reaches of the Yellow River, and EI is higher. Under the comprehensive influence of topography and the intensity of economic activities, the RVI of the middle reaches of the Yellow River is slightly higher than that of the middle reaches of the Yellow River. The Hu Line is the dividing line between population distribution and natural geographical environment in China. There are significant differences in natural and cultural aspects between the northwest and southeast parts of the Hu Line, showing the characteristics of lower EI, higher SI, and lower AI in the northwest half of the line, and the unbalanced and insufficient development of higher EI, lower SI and higher AI in the southeast half of the line (Hu, 1935). The Bo-Tai Line, which is perpendicular to the Hu Line, connects the underdeveloped areas in northern China and the developed areas in southern China, and will play a leading role in narrowing regional development differences in the future. Taking the Bo-Tai line as the boundary, SI is lower, AI is higher and RVI is higher in the northeast half part, and the southwest half is opposite. Taking the Hu Line and Bo-Tai Line as the dividing line, China’s regional development territory is divided into four quadrants, and the characteristics of exposure, sensitivity, and adaptation in the four quadrants are significantly different.
The essential connotation of rural development is the positive process and phase result presented in the evolution of the rural regional system. The rural region system is extremely complex with uncertain characteristics in terms of form and structure. Accurately identifying the element associations and structural characteristics of the system, and the dynamic mechanisms of system evolution are the basic prerequisites for cognizing rural regional systems. It is necessary to use complexity science, system theory, and power laws for quantitative scaling. Research on rural vulnerability is only based on the disturbance source, self-organization, and self-adaptation mechanism of the rural region system. The analysis of rural vulnerability at the county level focuses on the “background value” related to regional and rural development, which is slightly different from micro-level understanding and cognition at the village level. In the entire rural scientific research process, accurately identifying and clarifying the relationship and mutual feedback mechanism between rural vulnerability, rural resilience, and rural sustainability will be an important extension and direction of rural vulnerability research.

5.2 Analysis of the driving forces of rural vulnerability

(1) External environmental changes are the leading factors that induce rural vulnerability and can be divided into man-made and natural disturbances. In the context of globalization, urbanization, and industrialization, the flow of capital, technology, population, and other factors is passed to rural areas. While achieving urban-rural linkage and bringing opportunities for rural development, the ecological, economic, and social subsystems of rural areas are also facing huge disturbances and shocks. Natural disasters, climate change, environmental pollution, and other natural disturbances are important factors that induce rural vulnerability. Extreme weather caused by abnormal climate changes directly affects agricultural production and freshwater supply. Frequent earthquakes, landslides, mudslides, and other natural disasters pose a significant threat to agricultural production and the safety and property of farmers, especially the poor (Rajesh et al., 2018). At the same time, industrialization has brought about a large amount of “three wastes” emissions. From the perspective of the urban and rural development system, rural environmental exposure has increased, which induces rural vulnerability.
(2) The exposure of the system is a fundamental factor affecting the vulnerability of villages. Affected by various man-made and natural disturbances, the rural region system faces the “triple” pressure of ecological, economic, and social exposure. Ecological aspects include inefficient use of rural land resources, degradation of the ecological environment, and pollution of the rural environment. The exposure pressure on the economic subsystem is mainly concentrated in the industry. The rural industry is single, the primary, secondary, and tertiary industrial linkage mechanism has not yet formed, the competitiveness of agricultural products is weak, the industrial value is too short and discrete, and the agricultural total factor value chain needs to be constructed urgently. In addition, social exposure is mainly reflected in a series of “rural diseases” such as the aging and weakening of the rural population, the “hollowing” of social organizations and structures, and the “hollowing” of social governance.
(3) The sensitivity of the system is the core driving factor affecting the vulnerability of villages. Sensitivity has a multiplier effect on the exposure and adaptation of the system, and can expand or shrink the impact to the extreme within the threshold range. Rural location conditions, topography and landforms, soil physical and chemical conditions, and water-heat matching conditions are the basic conditions for agricultural production, which affect the sensitivity of the rural system. Improving the level of rural economic development is the core support for the village to enhance its own development power and vitality. Farmers are the mainstay of rural and agricultural production. Factors such as the degree of industrial structure integration, the diversity of farmers’ livelihoods, and the degree of specialization of products are the main factors that affect farmers’ livelihoods (Huynh et al., 2018). It also drives the economic sensitivity of the countryside. In terms of social sensitivity, the “dual” hukou system has always been the main reason for restraining the integration of urban and rural areas. There are deep-rooted differences in the concepts of clan blood relationships and cultural customs in rural areas. Ecological, economic, and social sensitivity jointly affect the sensitivity of rural regional systems.
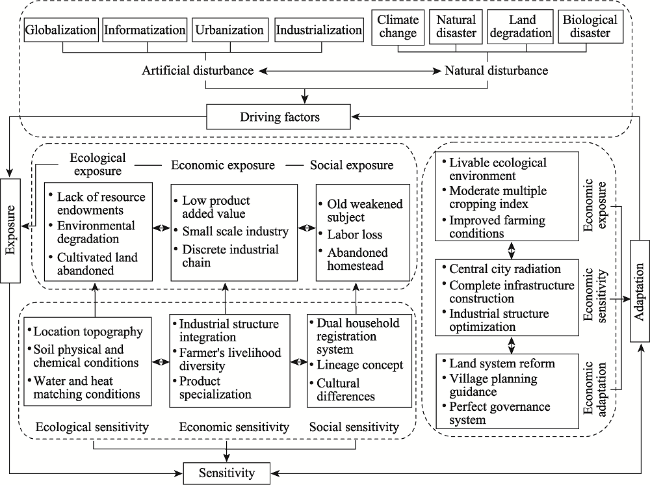
Figure 5 Driving forces of rural vulnerability
(4) The adaptation of the system is a driving factor of foreign aid that affects rural vulnerability. Improving the adaptation of the system could not only reduce the impact of external driving factors of the system, but also help reduce its sensitivity. Improving the rural living environment is a practical embodiment of constructing an ecologically livable countryside in the rural revitalization strategy. Appropriately increasing the multiple-crop index is a manifestation of the value of increasing land production efficiency. Increasing the intensive utilization of cultivated land and enhancing farmers’ income will increase their ability to adapt to disturbances. Economic adaptation is the most direct manifestation of rural adaptability. Villages adjacent to cities can benefit from those cities by virtue of trickle-down economics. Convenient traffic conditions and well-developed infrastructure are conducive to improving the level of high-quality rural development. The optimization and adjustment of the tertiary industrial structure will activate the endogenous power of village development and realize a qualitative change in rural development from passive “blood transfusion” to active “hematopoiesis”. Social adaptation is comprehensively reflected in the reform of the land system, the guidance of rural planning, and the improvement of the rural governance system. Rural planning and governance are the most direct way to connect rural development. The bottom-up governance system can objectively reflect the problems and needs of farmers (Tu et al., 2019).

5.3 Coping strategies

From a system perspective, to reduce rural vulnerability and achieve sustainable rural development, the following considerations are important:
(1) To begin with, the prediction and monitoring of disturbance sources should be strengthened to reduce the impact of exposure. In recent years, the occurrence of climate change and extreme weather events in China has increased the exposure and vulnerability of rural areas (Ortiz-Bobea et al., 2018). Villages in different locations also have significant differences in exposure conditions. For areas with frequent geological disasters, village safety and disaster prevention and mitigation projects should be coordinated, natural disasters should be predicted, and the damage caused by geological disasters should be minimized. Secondly, village environments should be improved, e.g., river improvement, regular and comprehensive garbage collection, sewage treatment, and the “China toilet revolution” so that countryside areas are livable and attractive places. Thirdly, mobile phone signaling data, POI data, and other shared big data should be used to dynamically monitor rural activities. Once the intensity of the disturbance exceeds the appropriate range of the rural natural carrying capacity, the higher-level government will issue a warning signal to intervene in time (Long et al., 2012).
(2) Additionally, control over the sensitivity of the system itself should be strengthened. The rapid development of globalization and informatization has accelerated the mobility of factors such as the flow of people, capital, technology, and information between regions and between urban and rural areas. With the support of information technology, the rural area system has gradually shifted from a relatively closed, single, and solid state to an open, fluid, and integrated system space. Firstly, it is necessary to promote the rational allocation of urban and rural elements, speed up the circulation of elements, give play to the radiating and leading role of cities, and allow rural areas to share urban resources. The key is to break through the shackles of the household registration system, break the barriers of the urban-rural dual system, promote the urbanization of farmers, and appropriately relax the policy requirements for migrant workers to settle in cities. Secondly, the obstacles of “identity differentiation” need to be removed, urban talents should be actively encouraged to return to their hometowns, industrial and commercial capital needs to be guided to the countryside, and the rural financial service system should be improved. At the same time, it would be prudent to encourage farmers to diversify their income base.
(3) Ultimately, disturbances need to be responded to in a timely manner, and then innovative and improved strategies for system adaptation should be explored. In the context of the two-wheel drive of the country’s new-type urbanization and rural revitalization strategy, it is urgent to establish a new urban-rural relationship and promote high-quality, coordinated development of urban and rural areas. The inequality between urban and rural public services is a shortcoming restricting the healthy development of rural areas. To achieve the integrated development of urban and rural areas and improve the adaptation of villages in dealing with risks, the following objectives must be achieved. Firstly, it is necessary to improve the urban-rural integrated public service system to achieve full coverage of rural public services and social undertakings. The balanced configuration of rural education, medical care, public culture, social security, social assistance, and rural governance are included. Secondly, the key to strengthening rural infrastructure construction is to promote the interconnection of urban and rural transportation and other infrastructure. In addition, improving the level of rural economic development is the most direct and effective way to improve the adaptation of rural areas. We should promote the integrated development of primary, secondary, and tertiary industries pursuant of optimizing and upgrading the industrial structure. Further, new types of agriculture should be developed such as urban agriculture, leisure agriculture, and sightseeing agriculture.

6 Conclusions

There are obvious regional differences in rural vulnerability at the county level in China, with a spatial polarization along the “Bo-Tai Line”: low in the northeast and high in the southwest. The rural vulnerability of the northeast, northern coastal, middle reaches of the Yellow River, eastern coastal, middle reaches of the Yangtze River, the great northwest, southwest, and southern coastal regions increases in sequence. The low-exposure areas are mainly concentrated in the great northwest, northeast, and the middle reaches of the Yellow River regions where the intensity of economic activity is relatively low. The southeast coastal region has been more disturbed. Sensitivity has obvious spatial differentiation characteristics, and the sensitivity of the eastern rural areas is slightly lower than that of the central region and significantly lower than that of the western region. The adaptation presents a certain spatial directionality of the river system, and the adaptation of riversides and coastal areas is generally strong.
Second, the rural ecological subsystem composed of ecological exposure, ecological sensitivity, and ecological adaptation is the fundamental determinant of rural vulnerability. The rural economic subsystem composed of economic exposure, economic sensitivity, and economic adaptation is the core determinant of rural vulnerability. The rural social subsystem composed of social exposure, social sensitivity, and social adaptation is also an important determinant of rural vulnerability.
Third, factors such as resource endowments, social culture, economic development, and policy systems in different rural areas jointly affect the degree of rural vulnerability. It is necessary to break regional roots and path dependence, scientifically develop and protect to reduce rural vulnerability, and promote sustainable rural development. We need to strengthen the prediction and monitoring of disturbance sources in the rural area system. At the same time, it is necessary to comprehensively integrate methods and technologies such as big data analysis and the Internet of Things to monitor rural activities, and use reasonable thresholds as a significant basis for government and rural development entities to intervene. In addition, it is urgent to strengthen the control of system sensitivity, promote the interactive circulation of factors such as population, land, funds, and information between urban and rural areas, villages and towns. The aim is to share the public resources of cities and towns, realize the joint development of towns and villages, and promote the comprehensive revitalization of villages. Ultimately, disturbances require timely responses and scientific strategies should be explored to improve the adaptation of rural systems.
[1]
Akira T, 2010. Regional development owing to the commodification of rural spaces in Japan. Geographical Review of Japan Serious B, 82(2): 103-125.

[2]
Bevacqua A, Yu Danlin, Zhang Yaojun, 2018. Coastal vulnerability: Evolving concepts in understanding vulnerable people and places. Environmental Science and Policy, 82: 19-29.

DOI

[3]
Birkmann J, Cardona O D, Carreno M L et al., 2013. Framing vulnerability, risk and societal responses: The MOVE framework. Natural Hazards, 67(2): 193-211.

DOI

[4]
Chen X H, Wu G B, Wan L H, 2014. Dynamic simulation of vulnerability and coordination of the coupling of urban and ecological environment based on BP: A case of the coal-electricity base in the eastern Heilongjiang Province. Scientia Geographica Sinica, 34(11): 1337-1343. (in Chinese)

[5]
Cheng Y, Ren J L, Xu C L, 2015. The vulnerability assessment and obstacles about man-land system of resources-recession city: A case study of Zaozhuang City in Shandong Province. Economic Geography, 35(3): 87-93. (in Chinese)

[6]
De Silva M M G T, Kawasaki A, 2018. Socioeconomic vulnerability to disaster risk: A case study of flood and drought impact in a rural Sri Lankan Community. Ecological Economics, 152: 131-140.

DOI

[7]
Egenhofer M J, Golledge R G, 1998. Spatial and Temporal Reasoning in Geographic Information Systems. Oxford: Oxford University Press.

[8]
Fang C L, 2020. Bole-Taipei Line: The important function and basic conception as a line for regional balanced development. Acta Geographica Sinica, 75(2): 211-225. (in Chinese)

[9]
GCTE Report 36: The terrestrial transects: Science Plan. IGBP of ICSU, Stockholm, 1995.

[10]
Griggs D, Stafford-Smith M, Gaffney O et al., 2013. Sustainable development goals for people and planet. Nature, 495(7441): 305-307.

DOI

[11]
He Y B, Huang X J, Zhai L X et al., 2016. Assessment and influencing factors of social vulnerability to rapid urbanization in urban fringe: A case study of Xi’an. Acta Geographica Sinica, 71(8): 1315-1328. (in Chinese)

[12]
Holling C S, 1973. Resilience and stability of ecological systems. Annual Review of Ecological Systems, 4: 1-23.

DOI

[13]
Hu H Y, 1935. Population distribution in China: Statistical tables and density maps are attached. Acta Geographica Sinica, 2(2): 33-74. (in Chinese)

[14]
Huai J J, 2016. Integration and typologies of vulnerability to climate change: A case study from Australian wheat sheep zones. Scientific Reports, 6(1): 1-13.

DOI

[15]
Huang X J, Huang X, Cui C L et al., 2014. The concept, analytical framework and assessment method of social vulnerability. Progress in Geography, 33(11): 1512-1525. (in Chinese)

[16]
Huang X J, Wang C, Hu K L, 2018. Multi-scale assessment of social vulnerability to rapid urban expansion in urban fringe: A case study of Xi’an. Acta Geographica Sinica, 73(6): 1002-1017. (in Chinese)

[17]
Huynh L T M, Stringer L C, 2018. Multi-scale assessment of social vulnerability to climate change: An empirical study in coastal Vietnam. Climate Risk Management, 20: 165-180.

DOI

[18]
IPCC, 2014. AClimate change 2014:Impacts, daptation and Vulnerability. Cambridge: Cambridge University Press.

[19]
Janssen M A, Ostrom E, 2006. Resilience, vulnerability and adaptation: A cross-cutting theme of the International Human Dimensions Programme on global environmental change. Global Environmental Change, 16(3): 235-236.

DOI

[20]
Kates R W, Clark W C, Corell R et al., 2001. Environment and development. Sustainability science. Science, 292: 641-642.

PMID

[21]
Keeble B R, 1987. The Brundtland commission: Environment and development to the year 2000. Medicine and War, 3(4): 207-210.

PMID

[22]
Kemp R, Martens P, 2007. Sustainable development: How to manage something that is subjective and never can be achieved? Sustainability: Science, Practice and Policy, 3(2): 5-14.

DOI

[23]
Khajehei S, Ahmadalipour A, Shao Wanyun et al., 2020. A place-based assessment of flash flood hazard and vulnerability in the Contiguous United States. Scientific Reports, 10(1): 1-12.

DOI

[24]
Li B, 2014. Vulnerability in human-sea economic system of Liaoning coastal area in China. Scientia Geographica Sinica, 34(6): 711-716. (in Chinese)

[25]
Li H, Zhang P Y, Cheng Y Q, 2008. Concepts and assessment methods of vulnerability. Progress in Geography, 2008, 27(2): 18-25. (in Chinese)

[26]
Liu Y S, Li Y H, 2017. Revitalize the world’s countryside. Nature, 548(7667): 275-277.

DOI

[27]
Liu Y S, Yang R, 2012. The spatial characteristics and formation mechanism of the county urbanization in China. Acta Geographica Sinica, 67(8): 1011-1020. (in Chinese)

[28]
Liu Y S, Zhou Y, Li Y H, 2019. Rural regional system and rural revitalization strategy in China. Acta Geographica Sinica, 74(12): 2511-2528. (in Chinese)

[29]
Long H L, Li X B, 2001. Land use pattern in transect of the Yangtze River and its influential factors. Acta Geographica Sinica, 56(4): 417-425. (in Chinese)

[30]
Long H L, Zou J, Li T T et al., 2012. Study on the characteristics and territorial types of rural transformation development: The case of “Southern Jiangsu-Northern Shaanxi” transect. Geographical Reasearch, 31(3): 495-506. (in Chinese)

[31]
Meng H H, Li T S, Yu Z S et al., 2013. Rurality and acorrelation analysis of the cuunty economy in Anhui Province. Economic Geography, 33(4): 144-148, 185. (in Chinese)

[32]
National Research Council NRC, 1999. Our Common Journey:A Transition toward Sustainability. Washington, DC: The National Academies Press.

[33]
Ncube A, Mangwaya P T, Ogundeji A A, 2018. Assessing vulnerability and coping capacities of rural women to drought: A case study of Zvishavane district, Zimbabwe. International Journal of Disaster Risk Reduction, 28: 69-79.

DOI

[34]
O’Neill B C, Oppenheimer M, Warren R, et al., 2017. IPCC reasons for concern regarding climate change risks. Nature Climate Change, 7(1): 28-37.

DOI

[35]
Ortiz-Bobea A, Knippenberg E, Chambers R G, 2018. Growing climatic sensitivity of U.S. agriculture linked to technological change and regional specialization. Science Advances, 4(12): 1-9.

[36]
Polsky C, Neff R, Yarnal B, 2007. Building comparable global change vulnerability assessments: The vulnerability scoping diagram. Global Environmental Change, 17(3/4): 472-485.

DOI

[37]
Rajesh S, Jain S, Sharma P, 2018. Inherent vulnerability assessment of rural households based on socio-economic indicators using categorical principal component analysis: A case study of Kimsar region. Uttarakhand. Ecological Indicators, 85: 93-104.

[38]
Su F, Chu Y T, Zhang P Y, 2013. Analysis of economic vulnerability and obstacle factors of typical tourism cities in China. Economic Geography, 33(12): 189-194. (in Chinese)

DOI

[39]
Tu S S, Long H L, Zhang Y N et al., 2019. Process and driving factors of rural restructuring in typical villages. Acta Geographica Sinica, 74(2): 323-339. (in Chinese)

[40]
Turner B L, Kasperson R E, Matson P A et al., 2003. A framework for vulnerability analysis in sustainability science. PNAS, 100(14): 8074-8079.

PMID

[41]
Wang C, He Y Z, 2020. Spatio-temporal differentiation and differentiated regulation of the vulnerability of rural production space system in Chongqing. Acta Geographica Sinica, 75(8): 1680-1698. (in Chinese)

[42]
Wang Y, Fang C L, 2014. Comprehensive evaluation and dynamic evolution analysis of Daqing’s urban vulnerability. Scientia Geographica Sinica, 34(5): 547-555. (in Chinese)

[43]
Wen X J, Yang X J, Wang Z Q, 2016. Assessment on the vulnerability of social-ecological systems in a mountainous city depending on multi-targets adaption. Geographical Research, 35(2): 299-312. (in Chinese)

[44]
Woods M, 2007. Engaging the global countryside: Globalization, hybridity and the reconstitution of rural place. Progress in Human Geography, 31(4): 485-507.

DOI

[45]
Wu J L, Liu S, Liu S L et al., 2020. Vulnerability assessment and influencing factors of farmers towards rural tourism in Zhangjiajie. Scientia Geographica Sinica, 40(8): 1336-1344. (in Chinese)

[46]
Yang R, Chen Y C, Zhang J et al., 2020a. The main theoretical evolution and enlightenment of western rural geography since 1990s. Scientia Geographica Sinica, 40(4): 544-555. (in Chinese)

[47]
Yang R, Luo X L, Chen Y C, 2019a. Spatial pattern and influencing factors of rural multifunctionality at county level in China. Progress in Geography, 38(9): 1316-1328. (in Chinese)

[48]
Yang R, Pan Y X, Xu Q, 2020b. Space diversification process and evolution mechanism of typical village in the suburbs of Guangzhou: A case study of Beicun. Journal of Geographical Sciences, 30(7): 1155-1178.

DOI

[49]
Yang R, Wen Q, Wang C et al., 2019b. Discussions and thoughts of the path to China’s rural revitalization in the new era: Notes of the young rural geography scholars. Journal of Nature Resources, 34(4): 890-910. (in Chinese)

[50]
Yang Y R, Wang S J, Chen X H, 2015. Dynamic evolution and control approaches of petroleum city’s economic system vulnerability: A case study of Daqing City. Scientia Geographica Sinica, 35(4): 456-463. (in Chinese)

DOI

[51]
Zhang X S, Zhou G S, Gao Q et al., 1997. Northeast China transect (NECT) for global change studies. Earth Science Frontiers, (Suppl.1): 149-155. (in Chinese)

[52]
Zhao L, Wang W, Zhang Y S et al., 2014. The spatio-temporal evolution about urban vulnerability on the northeast region since Northeast Revitalization. Economic Geography, 34(12): 69-77. (in Chinese)

[53]
Zou J, Zheng W W, Yang Y R, 2014. Evaluation of water resources system vulnerability in southern hilly rural region based on the GIS/RS: Take Hengyang Basin as an example. Scientia Geographica Sinica, 34(8): 1010-1017. (in Chinese)

Outlines

/