Research Articles

Impact of changes in precipitation pattern on food supply in a monsoon interlacing area and its mechanism: A case study of Yunnan Province

  • LIU Zhilin ,
  • DING Yinping ,
  • JIAO Yuanmei , *
Expand
  • Faculty of Geography, Yunnan Normal University, Kunming 650500, China
*Jiao Yuanmei (1972-), PhD and Professor, E-mail:

Liu Zhilin (1990-), PhD Candidate, specialized in the natural element, farmland, settlement landscape changes and their effects. E-mail:

Received date: 2021-01-18

  Accepted date: 2021-08-28

  Online published: 2021-12-25

Supported by

National Key Research and Development Program of China(2018YFE0184300)

National Natural Science Foundation of China(41761115)

National Natural Science Foundation of China(41271203)

Key Research Projects of Graduate Students in Yunnan Normal University(ysdyjs2019166)

Abstract

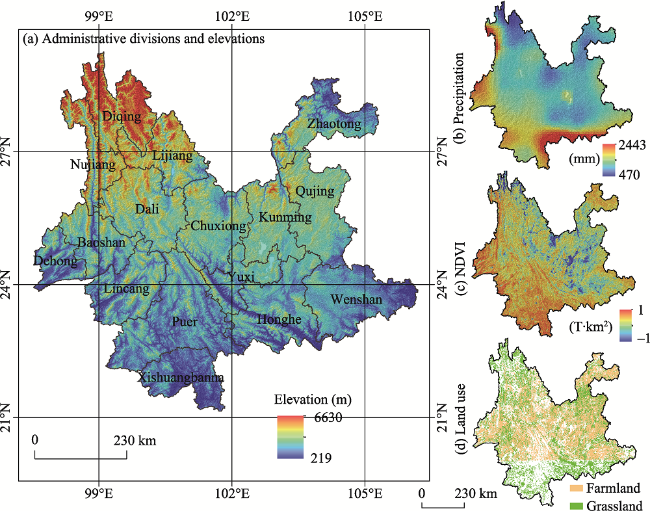
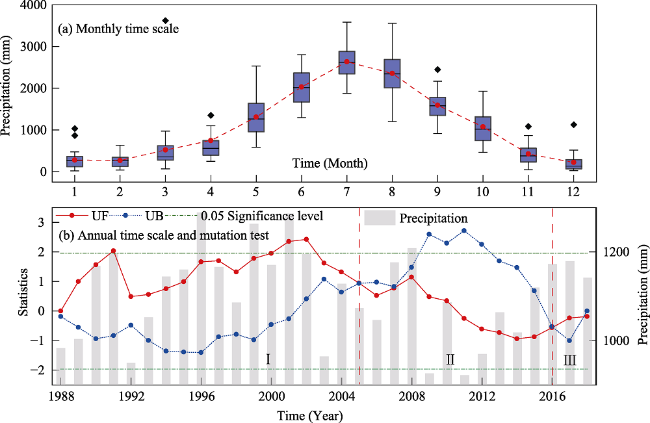
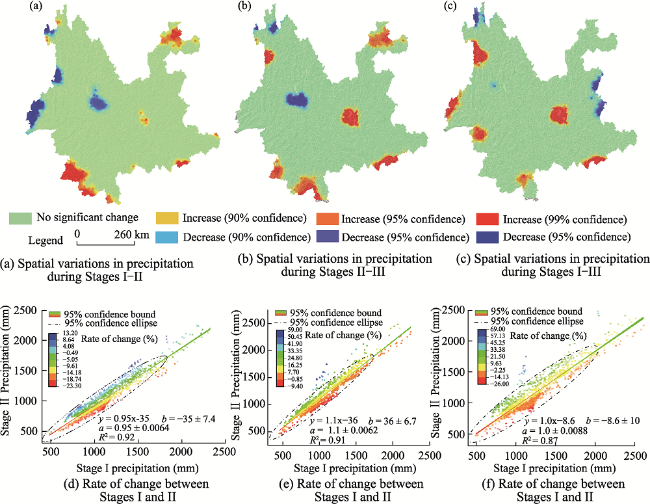
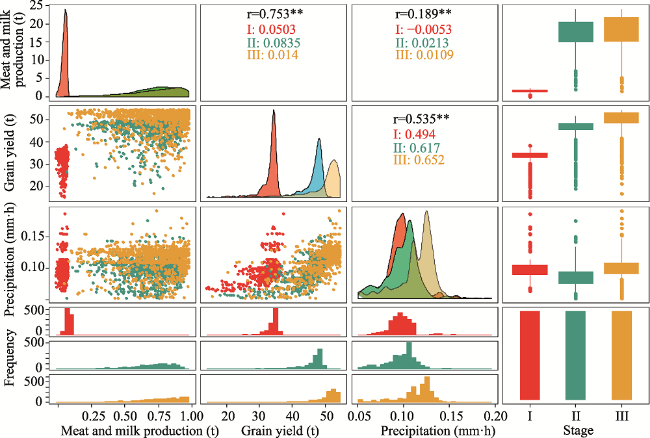
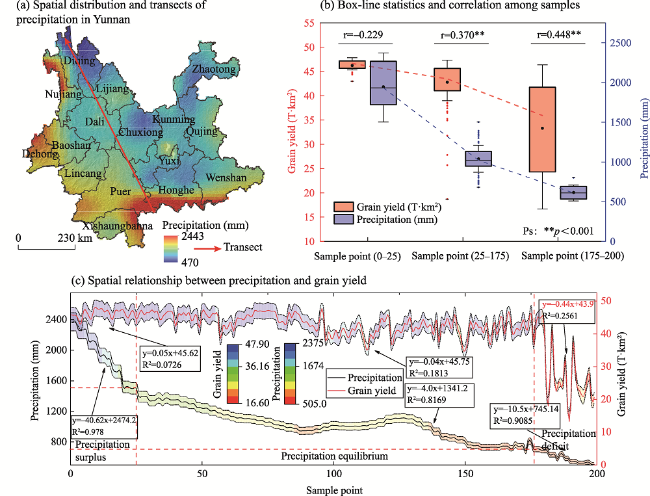
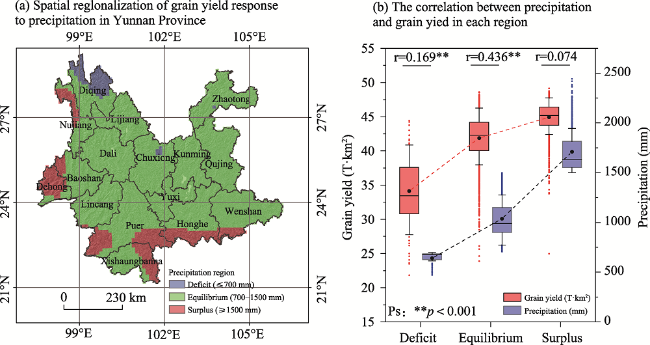
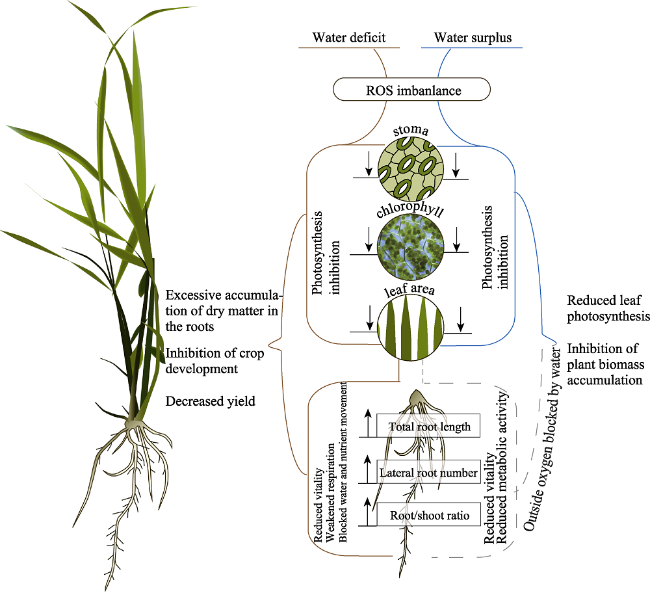
Following climate change, changes in precipitation patterns and food security are major challenges faced by humans. However, research on how these changes in precipitation pattern impacts food supply is limited. This study aims to elucidate this impact and response mechanisms using precipitation data of a climate change-sensitive confluence zone of the southwest and southeast monsoons in Yunnan Province from 1988 to 2018. The results revealed that the precipitation pattern could be divided into three periods: abundant precipitation (Stage I, from 1988 to 2004), decreased precipitation (Stage II, from 2005 to 2015), and drought recovery (Stage III, from 2016 to 2018). Following the transition from Stage I to Stage II and from Stage II to Stage III, the area of precipitation changed significantly, accounting for 15.07%, 13.87%, and 16.53% of Yunnan’s total area, for Stages I, II, and III, respectively. At the provincial level, a significant positive correlation was observed between precipitation and food production (r = 0.535, P < 0.01), and the correlation coefficient between precipitation and grain yield was higher than that between precipitation and meat and milk production. Based on a precipitation-grain yield transect and breakpoint detection method, key precipitation thresholds affecting grain yield were estimated as 700 and 1500 mm, respectively; when precipitation was < 700, 700-1500, and ≥1500 mm, the correlation coefficients between precipitation and grain yield were 0.448 (P < 0.01), 0.370 (P < 0.01), and -0.229 (P > 0.05), respectively. Based on the precipitation thresholds, Yunnan Province can be divided into precipitation surplus, precipitation equilibrium, and precipitation deficit regions, corresponding countermeasures to stabilize grain yield were proposed for each of these regions. The threshold effect of precipitation on grain yield is controlled by molecular-level water-crop mechanisms, in which reactive oxygen species, a by-product of plant aerobic metabolism, plays a key regulatory role.

Cite this article

LIU Zhilin , DING Yinping , JIAO Yuanmei . Impact of changes in precipitation pattern on food supply in a monsoon interlacing area and its mechanism: A case study of Yunnan Province[J]. Journal of Geographical Sciences, 2021 , 31(10) : 1490 -1506 . DOI: 10.1007/s11442-021-1908-y

1 Introduction

Climate change, water shortage, and food insecurity are major challenges faced by humans (IPCC, 2014), and various studies have revealed that these challenges are closely related (Zampieri et al., 2019; Miralles et al., 2019; Kahiluoto et al., 2019). In many regions, the changes in precipitation patterns brought about by climate change have profoundly affected various aspects of water cycle related factors, including drought-occurrence (Ault, 2020; Hu et al., 2020), surface water runoff (Chen et al., 2019; Konapala et al., 2020; Valmassoi et al., 2020), and river recharge (Valmassoi, 2020; Blöschl et al., 2019), thereby indirectly impacting the resilience and security of ecosystems and food supply systems (Nyström et al., 2019; Zampieri et al, 2019; Sadri et al., 2020). Evidently, the changes in precipitation patterns have a critical impact on food supply, and a few studies have elucidated the dynamic relationship between food production and precipitation patterns (Kahiluoto et al, 2020).
Precipitation patterns are the focus of climate change research (Pendergrass, 2018). Many studies in this field have primarily focused on the analysis of precipitation trends in terms of inter-annual (Knutti et al., 2013; Chadwick et al., 2013) and seasonal changes (Kumar et al., 2014; Polade et al., 2014) and on the spatio-temporal distribution of extreme precipitation (Kharin et al., 2013; Sillmann et al., 2013). Some studies have revealed that precipitation patterns have conspicuous spatio-temporal response characteristics pertaining to global climate change; for example, in the past 30 years, the precipitation pattern in northern China has exhibited a downward trend, whereas that in southern China has exhibited a significant upward trend (Zhang et al., 2018; Li et al., 2020); however, China’s northwestern region has exhibited a trend of dry-wet transition (Shi et al., 2003). Additionally, global warming has caused significant changes in centennial-scale precipitation patterns in arid and semi-arid regions of China (Hulme, 1996). Furthermore, monsoons exhibit a strong effect on precipitation patterns (Wang et al., 2017). To date, researchers have established the precipitation trends of the East Asian monsoon (Lu et al., 2019) and Indian monsoon (Cai et al., 2015), revealing the inter-annual and inter-decadal variations of monsoon precipitation patterns in Asia since 1870 (Krishnamurthy et al., 2014). However, the evolution of the precipitation pattern in the confluence area of the southeast monsoon (SEM) and the southwest monsoon (SWM) has not been elucidated.
Food production is a large-scale process that involves natural, social, and economic factors. Precipitation is established to have a decisive effect on food production (Knapp, 2002; Gornall et al., 2010; Challinor et al., 2014), because precipitation and its spatio-temporal pattern is more likely to change than other factors. Numerous studies have revealed that wheat, corn, rice, and other crops under water stress exhibit inhibited development and reduced grain yield (Chao et al., 2020; Lv et al., 2020; Li et al., 2020; Yang et al., 2020). The mechanisms of water stress which influence crop development have also been studied (Wang et al., 2019). However, most of these studies involved field and control experiments at the micro or macro scale, implying that long-term research on the relationship between precipitation pattern and crop yield is insufficient (Konapala et al., 2020).
Yunnan Province is located in southwest China, and its precipitation pattern is controlled by SEM and SWM. Recently, a series of extreme precipitation events have successively occurred here, including the 2011 drought during the wet season; 2012 drought during the dry season; 2013 winter-spring drought; 2016 heavy rains and flooding in Qujing, Qiubei, and other places; and the 2018 flooding in Kunming and Qujing (Cao et al., 2017). However, the long-term trends and spatio-temporal patterns of precipitation in Yunnan are not clarified. In 2018, 90% of the arable land in Yunnan was rain-fed agriculture (YPBS, 2019), and therefore, assessing the impact of precipitation pattern of Yunnan on food production is of critical importance to ensure food security. The aims of this study are (1) to reveal the spatio-temporal pattern of precipitation changes in Yunnan Province from 1988 to 2018; (2) to elucidate long-term dynamic relationship between precipitation and food supply in Yunnan; (3) to identify the impact and influencing mechanisms of precipitation on food supply at critical thresholds and analyse the response characteristics of Yunnan’s food production to precipitation on a regional scale. The results can provide a theoretical reference for the implementation of food security measures in Yunnan Province, thereby ensuring the stability of China’s southwest border and promoting national unity. This research represents a regional-scale case study of the response mechanism of food supply to global changes.

2 Study area and methods

2.1 Study area

Yunnan Province, southwest China, is located between 21°08′32″-29°15′8″N and 97°31′39″- 106°11′47″E, as shown in Figure 1. It covers an area of 394,000 km2, accounting for 4.1% of China’s total land area. It has a jurisdiction over 16 prefecture-level administrative divisions and 129 county- level administrative units. The elevation of Yunnan gradually increases from southeast to northwest, with a maximum elevation of 6,630 m and a minimum of 219 m below the sea level. Its landscape is dominated by mountains and plateaus, accounting for 94% of the total. Due to its location on the Eurasian continent and northern edge of the Indochinese Peninsula, precipitation pattern and moisture sources of Yunnan are affected by the SEM and SWM; the amount of precipitation gradually decreases from south to north, with small inter-annual changes and considerable intra-annual variations. In 2019, the total sown area in Yunnan Province was 18,605,400 ha, and the total irrigated area was 1,898,100 ha, which is 10.2%. The total agricultural output value was 493.5754 billion yuan; the total production of pork, beef, and mutton meat was 4.0443 tonnes, and the total milk output was 598,700 tonnes.
Figure 1 Location and main variables of Yunnan Province in Southwest China

2.2 Data sources and processing

The precipitation data were obtained from the Institute of Tibetan Plateau Research, Chinese Academy of Sciences. The dataset consists of the reanalysis data of the Princeton Global Meteorological Forcing Dataset (PGMFD), Global Land Data Assimilation System (GLDAS) data, Global Energy and Water Cycle Experiment Surface Radiation Budget (GEWEX-SRB) radiation data, and Tropical Rainfall Measuring Mission (TRMM) precipitation data as the background field, combined with conventional meteorological data of the China Meteorological Administration (CMA), with a temporal and spatial resolution of 3 h and 0.1°, respectively (He et al., 2020). In addition, geodata (1.6.7 Luc Anselin UK) was used to extract the annual and monthly precipitation raster data of Yunnan Province from 1988 to 2018, and normalised difference vegetation index (NDVI) data were derived from SPOT and Landsat imagery. In this study, ENVI (5.3 USA) was used for radiometric calibration and atmospheric correction of the downloaded monthly images of the 30-year study period; the band function (B1-B2)/(B1+B2) was used to obtain the NDVI; subsequently, the monthly precipitation data were converted to annual-scale data and then resampled to 1000-m resolution grid data. The food supply data, such as the annual output of grain, meat, and milk, were obtained from the Statistical Bureau of Yunnan Province. The land-use data were obtained from the Resource and Environment Data Center of the Chinese Academy of Sciences. Finally, ArcGIS (10.3 USA) was used for the extraction of arable land and grassland (land-use code of 1 and 3, respectively) and raster-to-vector data conversion.

2.3 Research methods

2.3.1 Breakpoint detection

The Mann-Kendall (M-K) test, a nonparametric test recommended by the World Meteorological Organisation, is an effective tool for detecting trends in time series and has been widely used in various disciplines. It has certain advantages, such as it does not require analysed data to follow a certain distribution and is not affected by a small number of outliers. The M-K algorithm is simple and is suitable for type and sequence variables.
For a time series x with n number of samples, the following formula is used to construct a sequence:
$S_{k}=\sum_{i=2}^{k} \sum_{j=1}^{i-1} a_{i j}, k=2,3, \cdots n$
where aij can be expressed as follows:
$a_{i j}=\left\{\begin{array}{ll}1, x_{i}>x_{j} \quad j=1,2, \cdots i \\0, \text { else }\end{array}\right.$
The sequence Sk is the sum of the number of times, the value at time i is greater than the value at time j, so that when k = 1, S1 = 0.
Assuming that the time-series data are random and independent, the statistical variables are given as follows:
$U F_{k}=\frac{S_{k}-E\left(S_{K}\right)}{\sqrt{\operatorname{Var}\left(S_{K}\right)}}, k=1,2,3, \cdots n$
where UFK is the defined statistic, and UF1 = 0; E(SK) and Var(SK)are the mean and variance of the cumulative number Sk, respectively. When x1, x2, L, Xn are mutually independent and have similar continuous distribution, the following formula can be used to calculate the mean and variance of Sk:
$\left\{\begin{array}{l}E\left(S_{k}\right)=\frac{n(n-1)}{4} \\\operatorname{Var}\left(S_{k}\right)=\frac{n(n-1)(2 n+5)}{72}\end{array}\right.$
The M-K test calculates the UF (forward trend) statistic in the order of time series x, which is x1, x2, L, Xn, and the UB (backward trend) statistic in the reverse order of time series x.
Considering a significance level α = 0.05, the corresponding critical value is 1.96. Therefore, when |UF| > 1.96, the sequence has a significant trend; when UF > 0, the sequence has an upward trend; when UF < 0, the sequence has a downward trend. UF > 1.96 indicates a significant upward trend, and UF < -1.96 indicates a significant downward trend. UF and UB intersect in the critical value range when sudden change occurs.

2.3.2 Estimation of food production

Previous studies have shown that there is a strong linear relationship between the crop yield and livestock production and the NDVI (Zhao et al., 2012). Therefore, grid-scale inversion can be used to analyse food production. Based on land-use classification, the grain yield per unit area and meat and milk output per unit area are calculated based on the area of farmland and grassland, respectively (Wu et al., 2017; Peng et al., 2019), using the following formula:
$Y_{i}=\frac{N D V I_{i}}{N D V I_{s u m}} \times Y_{s u m}$
where Yi is the grain yield and the meat and milk output allocated to the i-th grid; Ysum is the total output of food, meat, and milk; NDVIi is the NDVI of the i-th grid; and NDVIsum is the sum of the farmland and grassland NDVI values in the study area.

3 Results and analysis

3.1 Spatio-temporal patterns of precipitation changes in Yunnan from 1988 to 2018

3.1.1 Precipitation time series

The historical precipitation data show that dry and wet seasons of Yunnan are distinguishable at a monthly scale (Figure 2a); the wet season occurs from May to October and is characterised by scattered heavy precipitation events, and the dry season occurs from November to April of the following year and is characterised by concentrated small precipitation events. Based on the historical data over the past 30 years, extreme precipitation events, that is, sudden extreme rainfall events, tend to occur in Yunnan in March and April. In the dry season, precipitation events are concentrated and relatively stable, with small inter-annual variations, whereas in wet season, precipitation events are more scattered, indicating a high degree of uncertainty and large inter-annual variations.
Figure 2 Monthly precipitation and M-K test of annual precipitation data in Yunnan from 1988 to 2018
The M-K statistic curves (UF and UB) of precipitation in Yunnan from 1988 to 2018 were drawn at an annual scale (Figure 2b). Figure 2b shows that the precipitation data from 1988 to 2018 have two breakpoints, occurring in 2005 and 2016, and thus, the 30-year pre cipitation in Yunnan can be divided into the following three stages: Stage I, from 1988 to 2004; Stage II, from 2005 to 2015; and Stage III, from 2016 to 2018. Table 1 shows that in Stage I, the mean precipitation is 1129.88 mm, and the UF values are >0, implying that the precipitation has an increasing trend; during this stage, the UF values in 1990, 2001, and 2001 exceed 1.96, which indicates that the upward trend is significant. In Stage II, the mean precipitation is 1055.51 mm, and the UF values exhibit a downward trend throughout, indicating that the precipitation in Yunnan had a decreasing trend from 2005 to 2015; in addition, from 2011 to 2015, the UF values are <0, implying that during this period that coincides with a 3-year drought, the downward trend is evident. In Stage III, the mean precipitation is 1164.57 mm, and the UF values are ≤0, indicating an increasing precipitation trend. The precipitation data for Stage I typically exhibit a steady increasing trend with abundant precipitation, and therefore, it can be characterised as a period of abundant precipitation. The precipitation for Stage II decreases and exhibits a downward trend, and therefore, it can be characterised as a period of reduced precipitation. Stage III is a period of normal annual precipitation with a steady increasing trend, and therefore, it can be characterised as the drought (3-year drought) recovery period.
Table 1 Precipitation stages in Yunnan from 1988 to 2018
Stage Time (years) Annual precipitation (mm) UF values Precipitation characteristics
Stage I - abundant
precipitation
1988-2004 1129.88 Continuous increase≥0 Precipitation increase
Stage II - reduced
precipitation
2005-2015 1055.51 Continuous decrease, 2011-2015<0 Precipitation decrease
Stage III - recovery
period
2016-2018 1164.57 Approaching from≤0 Precipitation recovery

3.1.2 Spatial distribution of precipitation changes

The mean precipitations of Yunnan in Stages I, II, and III were used to calculate the difference in precipitation and the rate of change in precipitation between the three periods, as shown in Figure 3 and Table 2. Figure 3 shows that during the transition of Stage I to Stage II (I vs. II), precipitation significantly decreased in northwest Yunnan and significantly increased in the north-east and south-west. This shows that the SWM and SEM were weak during Stage II, and therefore, the moisture carried by them formed precipitation over the northeast and southwest and could not reach northwest Yunnan; during this period, the precipitation significantly decreased in northwest Yunnan. Following the transition from Stage II to Stage III (II vs. III), the precipitation increased and returned to its normal level; thus, in central, northeast, southeast, and southwest Yunnan, the precipitation significantly increased, whereas in Dali and Lijiang in northeast Yunnan, the precipitation significantly decreased. This indicates that in Stage III, the SEM and SWM intensified, and the moisture-laden SEM entered central Yunnan, causing a significant increase in precipitation in the northeastern and southwestern parts of Yunnan. Simultaneously, SWM entered the Nujiang River Basin in the northwest Yunnan, causing increased precipitation in southwest and northwest Yunnan (Nujiang River). Contrastingly, the precipitation rate in Dali and Lijiang significantly decreased, primarily because moisture carried by inland SEM did not reach this area, and the SWM was prevented from entering this area by the Hengduan Mountains. Compared with Stage I, the spatial distribution of precipitation in Stage III exhibited a significant increase in central, southwest, and northwest Yunnan and a significant decrease in the east. This shows that after 2016, the SEM and SWM strengthened and were able to enter far inland areas, thereby leading to increased precipitation in central, southwest, and northwest Yunnan. The primary reason for the precipitation decrease in east Yunnan is the strengthening of the SEM, which allowed it to carry a vast amount of moisture to far inland toward the northwestern part of Yunnan. In addition, as the elevation increases toward the west, the amount of precipitation also increases; however, in the east, most of the moisture is transported further inland and very little is precipitated.
Figure 3 Spatial and temporal distribution of precipitation in Yunnan from 1988 to 2018
Table 2 Precipitation change characteristics from 1988 to 2018
Time period Change area (%) Change region Fit relationship
y = ax+b
Rate of
change (%)
Increase Decrease
Ⅰ vs. Ⅱ 15.07 Pu’er City, Xishuangbanna,
Zhaotong City
Nujiang and Dehong prefectures y = 0.95x-35 -(82.5)+(17.5)
Ⅱ vs. Ⅲ 13.87 Pu’er City, Xishuangbanna,
Zhaotong City, Kunming,
Yuxi City
Small parts of Dali and Diqing prefectures y = 1.1x+36 -(6.3)+(93.7)
Ⅰ vs. Ⅲ 16.53 Pu’er City, Xishuangbanna,
Kunming, Yuxi City, Nujiang
Prefecture, Baoshan City, Dehong Prefecture, Lincang City
Diqing Prefecture and Qujing City y = 1.0x-8.6 -(49.2)+(50.8)
Table 2 shows that when the value of a of the linear function approaches 1, its corresponding b value approaches 0, making x- and y-values more consistent, indicating that the difference in precipitation values is also smaller. When b > 0, the precipitation in the y-period exceeds the precipitation in the x-period; when b < 0, the precipitation in the y-period is lower than that in the x-period. The change in the precipitation pattern is smaller between Stage I and Stage III than that between Stage II and Stage III. The precipitation in Stage I exceeds that in Stage II and Stage III, and the precipitation in Stage III is greater than that in Stage II.

3.2 Correlation analysis of changes in precipitation pattern and food production

3.2.1 Correlation between the changes in mean precipitation and food production

The food supply and yield estimation formula was used to calculate the average grain yield and average meat and milk production in Yunnan Province in Stages I, II, and III. Subsequently, the corresponding precipitation data in each stage were extracted for the correlation between these two datasets, as shown in Figure 4.
Figure 4 Correlation between precipitation and food supply in Yunnan
The results show that the correlation coefficient r between precipitation and meat and milk production and that between precipitation and grain yield are 0.189 and 0.535, respectively, with p < 0.01. These results indicate a significant positive correlation, implying that the precipitation in Yunnan has a significant impact on its food supply. Consequently, when precipitation increases, food production also increases, and reduced precipitation causes a decrease in food production. Notably, the correlation coefficient of grain yield is higher than that of meat and milk production, indicating that grain yield is more susceptible to the changes in precipitation. In each stage, grain yield exhibits a good positive correlation with precipitation. In Stages I, II, and III, the correlation coefficients are 0.494, 0.671, and 0.652, respectively, indicating that precipitation significantly affects the grain yield in Yunnan Province, and therefore, it can be concluded that precipitation is the main factor controlling Yunnan’s grain yield. Moreover, the results reveal that the overall meat and milk production has a significant positive correlation with the precipitation. However, in all the three stages, the correlation is relatively low and not significant, indicating that precipitation has a relatively small impact on the meat and milk production in all stages. These findings confirm that in the process of urbanisation, animal husbandry in Yunnan has transitioned from free-range to captive breeding, gradually decoupling meat and milk production from grassland.

3.2.2 Correlation between the changes in precipitation gradient and food production and identification of precipitation thresholds

A north-south transect with 200 sample points was obtained for the maximum to the minimum precipitation value to include any major changes in the precipitation gradient of the entire province (as shown in Figure 5a). Considering the precipitation trend, the precipitation decreased rapidly at sample points 0-25, decreased gradually at points 25-175, and decreased rapidly after point 175. Based on the above findings, we divided the entire precipitation process into the following three sample point segments: segment 0-25, segment 25-175, and segment 175-200. Box plot and correlation analysis of the precipitation and grain yield data of each segment are shown in Figure 5b. Precipitation and grain yield data were collected from cultivated land plots along the transect at equal intervals to depict the data trends (Figure 5c).
Figure 5b Spatial relationship between precipitation and grain yield in Yunnan
shows that the smallest and the largest fluctuations in precipitation occurred in segments 175-200 and 0-25, respectively, implying that the precipitation gradually increased from the southeast to the northwest and became less stable. The reason for this is that the northwestern part of Yunnan is farther inland and is blocked by mountains, and therefore, the water-laden air masses of the SEM and SWM fail reaching there. The grain
yield in segment 0-25 is the most stable, whereas the grain yield in segment 175-200 fluc tuates the most, indicating a southeast-southwest spatial trend; the differences in the spatial distribution of the grain yield gradually increase, and its trend becomes more unstable, reflecting the high spatial consistency between the grain yield and precipitation.
The regression and correlation analyses of the grain yield and precipitation show that in segment 0-25, the precipitation is represented by a decreasing function, and the grain yield is represented by an increasing function; the precipitation and grain yield exhibit an insignificant negative correlation (r = -0.229), implying that the grain yield has an insignificant upward trend with the decrease in precipitation. The precipitation and grain yield in segment 25-175 are both represented by decreasing functions and exhibit a significant positive correlation (r = 0.370), indicating that as the precipitation decreases, the grain yield has a significant downward trend. In segment 175-200, the precipitation and grain yield are both represented by linearly decreasing functions and both exhibit a significant positive correlation (r = 0.448), implying that the decrease in precipitation resulted in a significant reduction in grain yield.
Crops require sufficient water for their growth. The relationship between water and grain yield can generally be divided into three states: 1) a state of equilibrium, in which the water supply meets the demands of crop growth and is one of the limiting factors for crop growth; thus, within a certain threshold, as the water supply increases, the crop yield also increases; 2) a state of deficit, in which the water supply cannot meet the demands of crop growth and is the sole limiting factor; thus, crop yield changes with the changes in precipitation, and both exhibit highly consistent trends; 3) a state of surplus, in which the water supply exceeds the demands of crop growth; thus, the amount of water is a non-limiting factor, and crop yield is not affected by precipitation. Figure 5 shows that when the precipitation exceeds 1500 mm, the grain yield exhibits a slight downward trend with the increase in precipitation, implying that precipitation is a non-limiting factor. This shows that 1500 mm is the precipitation surplus threshold, and therefore, when precipitation exceeds 1500 mm, the grain yield is no longer affected by the precipitation. When the precipitation is in the range of 700-1500 mm, the grain yield exhibits a downward trend with a decrease in the precipitation, indicating that the precipitation and grain yield trends are consistent, and thus, water is a limiting factor. The results also show that the precipitation range of 700-1500 mm is the equilibrium state threshold, and within this range, the water supply meets or slightly exceeds the water demand for crop growth. When the precipitation is <700 mm, the crop yield decreases rapidly with a decrease in precipitation, both exhibiting highly consistent trends; thus, water supply is the deciding factor of crop yield. Evidently, 700 mm is the precipitation deficit threshold, and therefore, when the precipitation falls below this value, the precipitation cannot provide a stable water supply to meet the basic demands for crop growth.

4 Discussion

4.1 Grain yield regionalisation in Yunnan based on the precipitation-grain yield relationship

Geographical regionalisation is conventionally used as a core tool in geographical research (Fang et al., 2017). Geographical regionalisation of China began with the publication of ‘Climatic Provinces of China’ by Zhu Kenzhen in 1929, and the publication of Huang Bingwei and corresponding study by Li Xudan on China’s vegetation zoning and geographical regionalisation in 1940 and 1947, respectively (Shen et al., 2016), prompted further development of China’s geographical regionalisation. China’s current national, departmental, and zonal regionalisation work is relatively complete and has produced remarkable results. It has supported major contributions in the field of geography, thereby promoting China’s socioeconomic development (Zheng et al., 2005). Due to global climate change, precipitation trends have changed drastically. Although identifying the regional characteristics of grain yield in response to precipitation is a critical issue to ensure regional food safety, there are very few reports on the regionalisation of precipitation and grain yield (Zheng et al., 2005; Shen et al., 2016; Fang et al., 2017). Therefore, in this study, the spatial regionalisation of grain yield response to precipitation in Yunnan is conducted based on scaled-up transect data. Our results are expected to provide support for future studies related to food security, agricultural development, staple grain production, stable agricultural production zoning, and drought relief.
Based on the response of grain yield to precipitation along the transect, the entire province can be divided into the following three regions: the precipitation deficit region (≤ 700 mm), precipitation equilibrium region (700-1500 mm), and precipitation surplus region (≥ 1500 mm), as shown in Figure 6a. Subsequently, to verify the reliability of the scaled-up results, we extracted and mapped a box plot of the grain yield of cultivated land plots in each region and the corresponding precipitation to analyse the correlation between the precipitation and grain yield in each region, as shown in Figure 6b. In the precipitation deficit and equilibrium regions, the grain yield and precipitation exhibit a significant positive correlation (0.169 and 0.436, respectively), and in the precipitation surplus region, the correlation is non-significant and weak. This shows that in the deficit and equilibrium regions, precipitation is the limiting factor to grain yield, whereas in the surplus region, precipitation is a non-limiting factor. Moreover, in the deficit region, precipitation data have the smallest fluctuations, whereas grain yield has the largest fluctuations, indicating that even small fluctuations in precipitation cause large fluctuations in grain yield; the converse holds in the surplus region, where precipitation exhibits large fluctuations and grain yield is relatively stable, implying that even drastic changes in precipitation will not significantly affect grain yield. In summary, the response correlations between grain yield and precipitation and the data fluctuations in each region were similar to those along the transect, indicating that the scale-up of the transect data to the province-wide scale produced consistent results.
Figure 6 Spatial regionalisation of food safety in Yunnan based on the grain yield response to precipitation thresholds
The precipitation deficit region covers an area of 10,834.83 km², accounting for 2.8% of the total area; in this region, water is a strict limiting factor, and thus, a decrease in precipitation leads to rapid and large fluctuations in crop production. This region is most susceptible to drought and is the main region where drought disasters occur. Therefore, the changes in the precipitation pattern in this region will have a significant impact on grain yield. Therefore, it is recommended that water storage and irrigation facilities should be built in this region to counteract the sensitivity of grain yield to precipitation and ensure sufficient grain output. Moreover, precipitation monitoring, early warning of drought, and early allocation of grain should be implemented to ensure the safety of the food supply in this region. The precipitation equilibrium region covers an area of 323,191.68 km², accounting for 84.3% of the total area. In this region, water is a limiting factor to grain yield, and the changes in the precipitation and grain yield are consistent and relatively stable with small fluctuations. Thus, grain yield increases in years of increased precipitation and decreases in those with reduced precipitation; however, the magnitude of change is small. The precipitation equilibrium region is the main grain producing area in Yunnan, and thus, in addition to cultivating drought-tolerant grain varieties, to reduce the effect of precipitation on grain yield, water conservancy facilities are recommended to be built to ensure sufficient irrigation for crops in arid years. The precipitation surplus region covers an area of 49,469.57 km², accounting for 12.9% of Yunnan’s total area. In this region, water is a non-limiting factor to crop yield, and precipitation and grain yield are not correlated; the precipitation fluctuates greatly, but the changes in grain yield are small. When precipitation exceeds 1500 mm, this region is prone to floods, and therefore, it is necessary to consider the impact of flood disasters on grain yield. The precipitation equilibrium region accounts for the vast majority of Yunnan’s area. Although its precipitation and grain yield are positively correlated, the response intensity of grain yield to precipitation is lower than that in the precipitation deficit region. This implies that fluctuations in precipitation will not cause sharp fluctuations in grain yield, and therefore, the precipitation equilibrium region is critical in ensuring the stability of grain production in Yunnan Province.

4.2 Relationship between precipitation and grain yield and its influencing mechanism

The present results show that the relationship between precipitation and grain yield in Yunnan Province has threshold characteristics, that is, when the precipitation exceeds the upper threshold of crop water demand (1500 mm), the precipitation and crop yield are not significantly correlated. This means that excessive precipitation practically causes a slight decrease in grain yield, which is consistent with the conclusions obtained from the field experiments (Wang et al., 2018; Zhu et al., 2019). When the precipitation is within the range of crop water demand (700 mm to 1500 mm), the precipitation and crop yield exhibit a significant positive correlation, which is consistent with the findings of Ru et al. (2019) and Zhang et al. (1999). Finally, when the precipitation is below the threshold of crop water demand (700 mm), the grain yield exhibits large fluctuations, resulting in decreased grain production, which is consistent with the conclusions of Qi et al. (2010) and Li et al. (2020).
Studies have shown that there is an inverted U-shaped relationship between precipitation and rice yield, and thus, as the precipitation increases, the rice yield first increases until it reaches a certain value and then begins to decline (Han et al., 2019). Precipitation surplus has also been found to decrease corn and wheat yields (Li et al., 2013; Ji et al., 2016). In a normal precipitation year, an increase of 45.26% precipitation can allow wheat crop to reach its highest potential yield (Ru et al., 2019).
Research on the molecular mechanisms of water-crop interaction shows that reactive oxygen species (ROS) are the by-products of aerobic metabolism in plants that play a dual regulatory role in plant growth and development (Wang et al., 2019). Under normal water conditions, ROS in crops are in a balanced state; however, when crops are under stress due to water deficit or surplus, the production and metabolism of ROS in plant tissues are disturbed. ROS-mediated oxidative stress can cause various adverse cytological effects, such as biomembrane peroxidation, cell nucleus damage, photosynthesis inhibition, and respiration abnormalities (Yan et al., 1995; Wang, 2019). Drought stress in crop plants is reported to reduce the degree of opening and closure of the plant’s respiratory organs such as stomatal pores, reduce their photosynthetic activity while enhancing antioxidant activity, and inhibit starch synthesis and accumulation, thereby affecting the process of grain setting and development and adversely affecting grain quality, ultimately leading to reduced crop yield (Chao et al., 2020; Li et al., 2020; Yang et al., 2020). Moreover, due to reduced soil moisture, the root system will extend further than under normal conditions to increase the plant’s water intake. This has an adverse impact of increasing the accumulation of dry matter, further reducing crop grain yield (Chen et al., 2003). Under water surplus conditions, the waterlogging of soil occurs, and thus, crop roots and leaves are prevented from getting sufficient oxygen; moreover, carbon dioxide concentration in the water decreases, thereby reducing the light transmittance of water. All these factors have an adverse effect on the photosynthetic rate of crops, thereby affecting the grain crop yield (Wang et al., 2019). The influencing mechanism of water on crop yield is shown in Figure 7.
Figure 7 Influencing mechanism of moisture conditions on crop plants

5 Conclusions

The study of the precipitation pattern in Yunnan Province, located in the confluence region of SEM and SWM, from 1988 to 2018, shows that the precipitation pattern changed abruptly in 2005 and again in 2016, and thus, the precipitation data can be divided into three distinctive periods: a period of abundant precipitation (Stage I, from 1988 to 2004), a period of decreased precipitation (Stage II, from 2005 to 2015), and a period of drought recovery (Stage III, from 2016 to 2018). Comparing Stage I with Stage II, significant changes in precipitation occurred in Stage II over an area of 57,938.69 km2, accounting for 15.07% of Yunnan’s total area; in north-west Yunnan, precipitation decreased significantly, whereas in southwest and northeast Yunnan, it increased significantly. Comparing Stage II and Stage III, significant changes in precipitation occurred in Stage III over an area of 53,190.84 km2, accounting for 13.87% of the total area; in Dali and a small portion of Diqing Prefecture in northwest Yunnan, the precipitation decreased significantly, whereas in the Fuxian Lake Basin in southwest and central Yunnan, the precipitation increased significantly. Comparing Stage I with Stage III, significant changes in precipitation occurred in Stage III, over an area of 63,401.72 km2, accounting for 16.53% of Yunnan’s total area; a significant increase in precipitation occurred in northeast, northwest, and central Yunnan, whereas significant decrease occurred in Diqing Prefecture in northwest Yunnan and Qujing City in the eastern part of Yunnan. The present results revealed that there is an evident dynamic relationship between precipitation and food production in Yunnan; the correlations between precipitation and meat and milk output and that between precipitation and grain yield are 0.189 and 0.535, respectively, with p <0.01, implying that precipitation has a significant effect on food production. The analysis results of the influencing mechanisms of water on grain yield at key precipitation thresholds showed that when precipitation is >1500 mm, there is an insignificant and weak correlation between precipitation and grain yield. However, when precipitation ranges from 700 to 1500 mm, it has a significant positive correlation with grain yield. Finally, when precipitation is ≤700 mm, it has a significant positive correlation with grain yield. Based on the response characteristics of the grain yield to precipitation in Yunnan Province, the precipitation deficit region accounted for 2.8% of Yunnan’s total area, precipitation equilibrium accounted for 84.3%, and precipitation surplus region accounted for 12.9%. Considering these findings, appropriate countermeasures to stabilize grain yield have been proposed. Finally, the influencing mechanism of precipitation or water on crop yield was elucidated. Relevant research has demonstrated that the response threshold of crop plants to precipitation was controlled by the molecular-level mechanisms of water-crop plant interaction, in which ROS played a key regulatory function.
[1]
Ault T R, 2020. On the essentials of drought in a changing climate. Science, 368(6488): 256-260.

DOI

[2]
Blöschl G, Hall J, Viglione A et al., 2019. Changing climate both increases and decreases European river floods. Nature, 573(7772): 108-111.

DOI

[3]
Cai Y, Fung I Y, Edwards R L et al., 2015. Variability of stalagmite-inferred Indian monsoon precipitation over the past 252,000 y. Proceedings of the National Academy of Sciences, 112(10): 2954-2959.

DOI

[4]
Cao Y, Wang J, Huang Y et al., 2017. Research on spatial and temporal variation characteristics of climate dry-wet status in Yunnan Province. Water Resources and Power, 35(8): 6-9. (in Chinese)

[5]
Chadwick R, Boutle I, Martin G, 2013. Spatial patterns of precipitation change in CMIP5: Why the rich do not get richer in the tropics. Journal of Climate, 26(11): 3803-3822.

DOI

[6]
Chao M, Shi X, Zhang J et al., 2020. Effects of persistent drought at grain filling stage on flag leaf photosynthesis, antioxidant enzyme activity, grain yield and quality of wheat. Journal of Triticeae Crops, 40(4): 494-502. (in Chinese)

[7]
Chen L, Liu X, 2003. Effects of water stress on some enzyme activities related to respiratory metabolism in litchi chinensis leaves. Scientia Silvae Sinicae, 39(2): 39-43.

[8]
Chen S A, Michaelides K, Grieve S et al., 2019. Aridity is expressed in river topography globally. Nature, 573(7775): 573-577. (in Chinese)

DOI

[9]
Fang C, Liu H, Luo K et al., 2017. Comprehensive regionalization of human geography in China. Acta Geographica Sinica, 72(2): 179-196. (in Chinese)

[10]
Han F, Zhang J, Cheng L et al., 2019. Impact of climate change on rice yield and its regional heterogeneity in China. Journal of Ecology and Rural Environment, 35(3): 283-289. (in Chinese)

[11]
He J, Yang K, Tang W et al., 2020. The first high-resolution meteorological forcing dataset for land process studies over China. Scientific Data, 7(1): 25.

DOI

[12]
Hu T, van Dijk A I J M, Renzullo L J et al., 2020. On agricultural drought monitoring in Australia using Himawari-8 geostationary thermal infrared observations. International Journal of Applied Earth Observation and Geoinformation, 91: 1-13.

[13]
Hulme M, 1996. Recent climatic change in the world’s drylands. Geophysical Research Letters, 23(1): 61-64.

DOI

[14]
IPCC, 2014. Climate change 2014 impacts, adaptation, and vulnerability part a: Global and sectoral aspects

[15]
Kahiluoto H, Kaseva J, Balek J et al., 2019. Decline in climate resilience of European wheat. Proceedings of the National Academy of Sciences, 116(1): 123-128.

DOI

[16]
Kharin V V, Zwiers F W, Zhang X et al., 2013. Changes in temperature and precipitation extremes in the CMIP5 ensemble. Climatic Change, 119(2): 345-357.

DOI

[17]
Knutti R, Sedláček J, 2013. Robustness and uncertainties in the new CMIP5 climate model projections. Nature Climate Change, 3(4): 369-373.

DOI

[18]
Konapala G, Mishra A K, Wada Y et al., 2020. Climate change will affect global water availability through compounding changes in seasonal precipitation and evaporation. Nature Communications, 11(1): 1-10.

DOI

[19]
Krishnamurthy L, Krishnamurthy V, 2014. Decadal scale oscillations and trend in the Indian monsoon rainfall. Climate Dynamics, 43(1/2): 319-331.

DOI

[20]
Kumar S, Lawrence D M, Dirmeyer P A et al., 2014. Less reliable water availability in the 21st century climate projections. Earth's Future, 2(3): 152-160.

DOI

[21]
Li H, Jiang Y, Jia S et al., 2020. Research progress on drought stress affecting ear and tassel development of maize. Journal of Maize Sciences, 28(2): 90-95. (in Chinese)

[22]
Li Q, Wu Z, Wang X, 2020. The characteristics of summer precipitation in China since 1981 and its relationship with SST and pre-circulation. Plateau Meteorology, 39(1): 58-67. (in Chinese)

[23]
Lu F, Ma C, Zhu C et al., 2019. Variability of East Asian summer monsoon precipitation during the Holocene and possible forcing mechanisms. Climate Dynamics, 52(1/2): 969-989.

DOI

[24]
Lv G, Wang C, Jin X et al., 2020. Effects of water-nitrogen interaction on dry matter, nitrogen accumulation and yield of winter wheat. Chinese Journal of Applied Ecology, 31(8): 2593-2603. (in Chinese)

[25]
Miralles D G, Gentine P, Seneviratne S I et al., 2019. Land-atmospheric feedbacks during droughts and heatwaves:State of the science and current challenges. Annals of the New York Academy of Sciences, 1436(1): 19-35.

[26]
Nyström M, Jouffray J B, Norström A V et al., 2019. Anatomy and resilience of the global production ecosystem. Nature, 575(7781): 98-108.

DOI

[27]
Pendergrass A G, 2018. What precipitation is extreme? Science, 360(6393): 1072-1073.

DOI PMID

[28]
Peng J, Hu X, Wang X et al., 2019. Simulating the impact of Grain-for-Green Programme on ecosystem services trade-offs in northwestern Yunnan, China. Ecosystem Services, 39: 1-9.

[29]
Polade S D, Pierce D W, Cayan D R et al., 2014. The key role of dry days in changing regional climate and precipitation regimes. Scientific Reports, 4(1): 1-8.

[30]
Ru X, Li G, Chen G et al., 2019. Regulation effects of water and nitrogen on wheat yield and biomass in different precipitation years. Acta Agronomica Sinica, 45(11): 1725-1734. (in Chinese)

[31]
Sadri S, Pan M, Wada Y et al., 2020. A global near-real-time soil moisture index monitor for food security using integrated SMOS and SMAP. Remote Sensing of Environment, 246: 1-22.

[32]
Shen Y, Wang X, Cheng W et al., 2016. Integrated physical regionalization of stony deserts in China. Progress in Geography, 35(1): 57-66. (in Chinese)

[33]
Shi Y, Shen Y, Li D et al., 2003. Discussion on the present climate change from warm-dry to warm wet in northwest China. Quaternary Sciences, 23(02): 152-164. (in Chinese)

[34]
Sillmann J, Kharin V V, Zwiers F W et al., 2013. Climate extremes indices in the CMIP5 multimodel ensemble: Part 2. Future climate projections. Journal of Geophysical Research: Atmospheres, 118(6): 2473-2493.

DOI

[35]
Valmassoi A, Dudhia J, Di Sabatino S et al., 2020. Irrigation impact on precipitation during a heatwave event using WRF-ARW: The summer 2015 Po Valley case. Atmospheric Research, 241: 1-15.

[36]
Wang F, Xiao K, Jiang S et al., 2019. Mechanisms of reactive oxygen species in plants under drought stress. Chinese Science Bulletin, 64(17): 1765-1779. (in Chinese)

[37]
Wang P X, Wang B, Cheng H et al., 2017. The global monsoon across time scales: Mechanisms and outstanding issues. Earth-Science Reviews, 174: 84-121.

DOI

[38]
Wu W, Peng J, Liu Y et al., 2017. Tradeoffs and synergies between ecosystem services in Ordos City. Progress in Geography, 36(12): 1571-1581. (in Chinese)

[39]
Yan B, Dai Q, Liu X et al., 1995. Accumulation of superoxide radical in corn leaves during waterlogging. Acta Botanica Sinica. 37(9): 738-744. (in Chinese)

[40]
Yang Z, Tang C, Qian J et al., 2020. Effects of exogenous 6-ba and br on photosynthetic pigment content and antioxidant system of rice in tillering stage under drought stress. Molecular Plant Breeding, 31(08): 2733-2739. (in Chinese)

[41]
Yunnan Provincial Bureau of Statistics YPBS, 2019. Yunnan Statistical Yearbook. Beijing: China Statistics Press, 122.

[42]
Zampieri M, Ceglar A, Dentener F et al., 2019. When will current climate extremes affecting maize production become the norm? Earth’s Future, 7(2): 113-122.

DOI

[43]
Zhang Z, Chen B, Xin X, 2018. Variations of temperature and precipittion pattern in Hulunber grassland from 1960 to 2015. Chinese Journal of Agricultural Resources and Regional Planning, 39(12): 121-128. (in Chinese)

[44]
Zhao W, He Z, He J et al., 2012. Remote sensing estimation for winter wheat yield in Henan based on the MODIS-NDVI data. Geographical Research, 31(12): 2310-2320. (in Chinese)

[45]
Zheng D, Ge Q, Zhang X et al., 2005. Regionalization in China: Retrospect and prospect. Geographical Research, 24(03): 330-344. (in Chinese)

Outlines

/