
Journal of Geographical Sciences >
Vulnerability of glacier change in the Tianshan Mountains region of China
|
Cai Xingran, PhD Candidate, specialized in cryosphere and sustainable development. E-mail: xingrancai@126.com |
Received date: 2021-01-27
Accepted date: 2021-07-30
Online published: 2021-12-25
Supported by
Strategic Priority Research Program of the Chinese Academy of Sciences(XDA20020102)
Strategic Priority Research Program of the Chinese Academy of Sciences(XDA 20060201)
National Natural Science Foundation of China(41761134093)
National Natural Science Foundation of China(41471058)
National Natural Science Foundation of China(42001067)
The Second Tibetan Plateau Scientific Expedition and Research Program(2019QZKK0201)
National Cryosphere Desert Data Center(20D03)
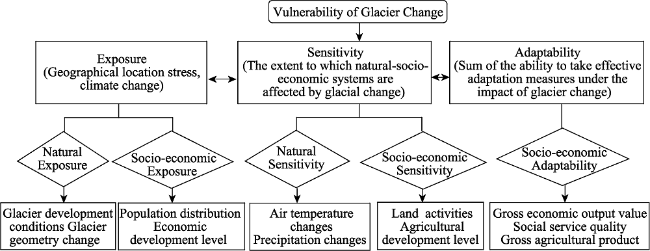
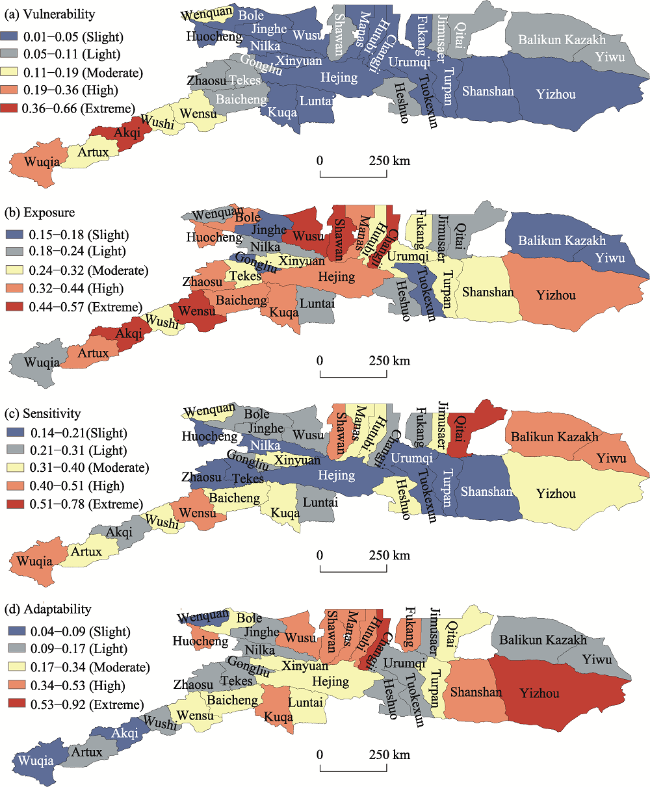
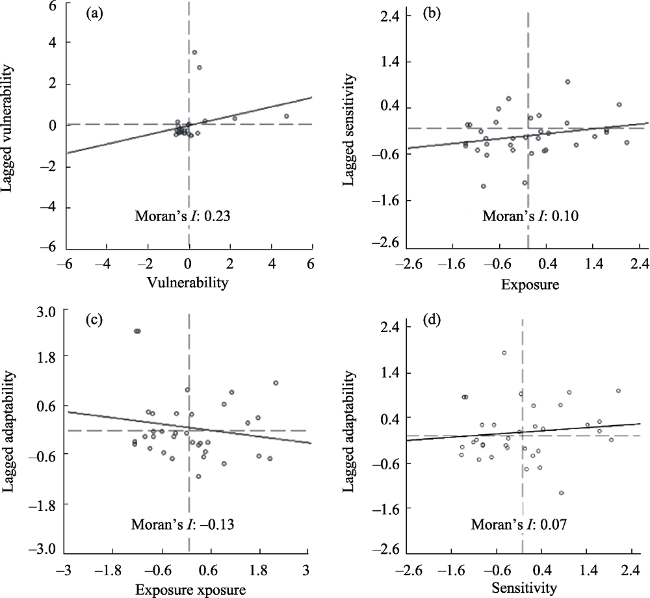
The glacier is a crucial freshwater resource in arid and semiarid regions, and the vulnerability of the glacier change is intimately linked to regional ecological services and socio-economic sustainability. Taking the Tianshan Mountains region in China as an example, a basic framework for studying the vulnerability of glacier change was constructed so as to address factors such as physical geography, population status, socio-economic level, agricultural development, and social services. The framework was based on key dimensions, that is, exposure, sensitivity, and adaptability, and this constituted a targeted evaluation index system. We examined the spatial structure and spatial autocorrelation of the glacier change vulnerability using ArcGIS and GeoDa software. The influence and interaction of natural, social, economic, population and other factors on glacier change adaptability was examined using the GeoDetector model. The results suggested the following: (1) The vulnerability level decreased from the western region to the eastern region with significant differences between the two regions. The eastern region had the lowest vulnerability, followed by the central region, and then western region which had the highest vulnerability. (2) Significant positive and negative correlations were found between exposure, sensitivity, and adaptability, indicating that the areas with high exposure and high sensitivity to glacier change tended to have a low adaptive capacity, which led to high vulnerability, and vice versa. (3) The spatial heterogeneity regarding the ability to cope with glacier change reflected the combined effects of the natural, social, economic, and demographic factors. Among them, factors such as the production value of secondary and tertiary industries, the urban population, urban fixed-asset investment, and the number of employees played major roles regarding the spatial heterogeneity of glacier change.
Key words: glacier change; vulnerability; adaptability; GeoDetector model; Tianshan Mountains; China
CAI Xingran , LI Zhongqin , ZHANG Hui , XU Chunhai . Vulnerability of glacier change in the Tianshan Mountains region of China[J]. Journal of Geographical Sciences, 2021 , 31(10) : 1469 -1489 . DOI: 10.1007/s11442-021-1907-z
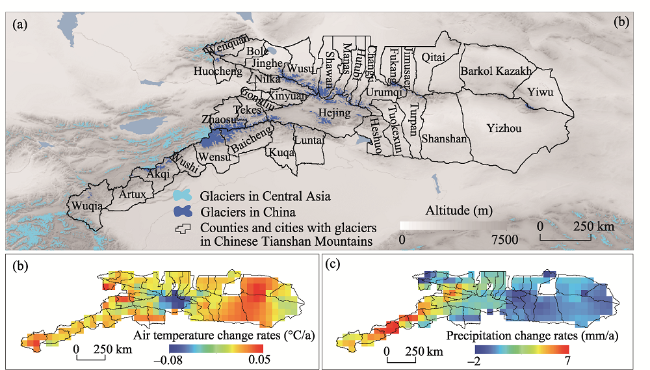
Figure 1 The geographical location of the Tianshan Mountains and distribution of glaciers (a); rates of change of the air temperature (b) and precipitation (c) during the period 1961‒2010 |
Table 1 Vulnerability assessment index system of glacier change in the Tianshan Mountains region |
| Rule layer | Index layer | Comprehensive weight | Index description |
|---|---|---|---|
| Exposure | Relative rate of change of glacier area (%) | 0.11 | The area change was reflected by the difference in area between two glacial periods (Xing et al., 2017) |
| Relative rate of change of glacier volume (%) | 0.02 | The volume change was reflected by the difference in volume between two glacial periods (Zhang et al., 2017) | |
| Elevation of glacier tongue (m) | 0.03 | Reflects the change of height of the tip of the glacier tongue | |
| Glacier altitude distribution (m) | 0.03 | Based on DEM data, the elevation distribution of the glacier is statistically analyzed to reflect the conditions for development | |
| Urbanization rate (%) | 0.04 | Reflects the urbanization process affected indirectly by glacier change | |
| Gross domestic product ($) | 0.07 | Reflects the overall economic development level of the administrative region | |
| Population density (person/km2) | 0.06 | Reflects the population density under the influence of glacier change | |
| Sensitivity | Rate of change of temperature (°C/10a) | 0.03 | Reflects the temperature change |
| Rate of change of precipitation (mm/10a) | 0.05 | Reflects the precipitation change | |
| Total grain output (t) | 0.07 | Reflects the grain production capacity of the administrative region | |
| Per capita effective irrigation area (ha) | 0.04 | Reflects the abundance of regional water resources and their stability in the process of agricultural production | |
| Adapt- ability | Per capita net income of rural residents (USD) | 0.02 | Reflects changes in the production level and quality of life of rural residents |
| Per capita GDP (USD) | 0.09 | Reflects regional economic status and people’s living standards | |
| Urban fixed-asset investment completed (USD) | 0.08 | Reflects the scale, structure, and speed of development of regional capital investment | |
| Education level (person basis) | 0.06 | Adopts the number of students in secondary school to reflect the degree of popularity of education and the level of educational facilities | |
| Medical level (bed) | 0.07 | Adopts the number of hospital beds to reflect the level of medical infrastructure | |
| Gross agricultural product (USD) | 0.04 | Reflects the scale and level of agricultural production | |
| Added value of secondary industry (USD) | 0.10 | Reflects the benefits brought by the development of the secondary industry |
Figure 2 Framework of vulnerability assessment of glacier change in the Tianshan Mountains region |
Table 2 Types of interaction detection |
| Type | Formula | |
|---|---|---|
| Enhanced | Ordinary | PD, E (D1∩D2) > PD, E (D1) or PD, E (D2) |
| Bilinear | PD, E (D1∩D2) > PD, E (D1) and PD, E (D2) | |
| Nonlinear | PD, E (D1∩D2) > PD, E (D1) + PD, E (D2) | |
| Weakened | Ordinary | PD, E (D1∩D2) < PD, E (D1) + PD, E (D2) |
| Bilinear | PD, E (D1∩D2) < PD, E (D1) or PD, E (D2) | |
| Nonlinear | PD, E (D1∩D2) < PD, E (D1) and PD, E (D2) | |
| No dependence | Ordinary | PD, E (D1∩D2) = PD, E (D1) + PD, E (D2) |
Figure 3 Spatially distributed vulnerability levels of glacier change in the Tianshan Mountains region |
Figure 4 Spatial relationship between the vulnerability of glacier change and the various dimensions in the Tianshan Mountains region |
Table 3 Detection results for factors influencing the adaptability of glacier change in the Tianshan Mountains region |
| Impact factors | PD,E value | PD,E value sorting | Impact factors | PD,E value | PD,E value sorting |
|---|---|---|---|---|---|
| Altitude | 0.20 | 10 | Per capita net income of farmers and herdsmen | 0.53 | 7 |
| Urban fixed-asset investment | 0.63 | 3 | Urban population | 0.79 | 2 |
| Production value of secondary and tertiary industries | 0.86 | 1 | Volume of postal business | 0.57 | 5 |
| Total output value of agriculture, forestry, animal husbandry, fisheries and services industry | 0.12 | 11 | Number of students beyond secondary school | 0.36 | 9 |
| Number of year-end employees | 0.60 | 4 | Number of professional health technicians | 0.56 | 6 |
| Local financial revenue | 0.37 | 8 |
Table 4 Detection results for the interactions of influencing factors on the adaptability of glacier change in the Tianshan Mountains region |
| X1 | X2 | X3 | X4 | X5 | X6 | X7 | X8 | X9 | X10 | X11 | |
|---|---|---|---|---|---|---|---|---|---|---|---|
| X1 | |||||||||||
| X2 | 0.86 | ||||||||||
| X3 | 0.97 | 0.92 | |||||||||
| X4 | 0.54 | 0.76 | 0.95 | ||||||||
| X5 | 0.81 | 0.93 | 0.95 | 0.84 | |||||||
| X6 | 0.61 | 0.83 | 0.87 | 0.60 | 0.92 | ||||||
| X7 | 0.65 | 0.84 | 0.94 | 0.73 | 0.85 | 0.92 | |||||
| X8 | 0.94 | 0.88 | 0.95 | 0.89 | 0.91 | 0.88 | 0.91 | ||||
| X9 | 0.83 | 0.93 | 0.95 | 0.73 | 0.79 | 0.86 | 0.89 | 0.88 | |||
| X10 | 0.67 | 0.94 | 0.97 | 0.47 | 0.85 | 0.89 | 0.76 | 0.89 | 0.87 | ||
| X11 | 0.69 | 0.77 | 0.95 | 0.62 | 0.93 | 0.92 | 0.88 | 0.91 | 0.88 | 0.69 |
Note: X1 - altitude, X2 - urban fixed-asset investment, X3 - production value of secondary and tertiary industries, X4 - total output value of agriculture, forestry, animal husbandry, fisheries and services industry, X5 - number of year-end employees, X6 - local financial revenue, X7 - per capita net income of farmers and herdsmen, X8 - urban population, X9 - the volume of postal business, X10 - number of students beyond secondary school, and X11 - number of professional health technicians. |
| [1] |
|
| [2] |
|
| [3] |
|
| [4] |
|
| [5] |
|
| [6] |
|
| [7] |
|
| [8] |
|
| [9] |
|
| [10] |
|
| [11] |
|
| [12] |
|
| [13] |
|
| [14] |
|
| [15] |
|
| [16] |
|
| [17] |
|
| [18] |
|
| [19] |
|
| [20] |
|
| [21] |
|
| [22] |
|
| [23] |
|
| [24] |
|
| [25] |
|
| [26] |
|
| [27] |
|
| [28] |
|
| [29] |
|
| [30] |
|
| [31] |
|
| [32] |
|
| [33] |
|
| [34] |
|
| [35] |
|
| [36] |
|
| [37] |
|
| [38] |
|
| [39] |
|
/
| 〈 |
|
〉 |